SlideShare a Scribd company logo
ORIGINAL RESEARCH ARTICLE
published: 17 December 2014
doi: 10.3389/fmicb.2014.00679
Comparisons of the composition and biogeographic
distribution of the bacterial communities occupying South
African thermal springs with those inhabiting deep
subsurface fracture water
Cara Magnabosco1
*, Memory Tekere2
, Maggie C. Y. Lau1
, Borja Linage3
, Olukayode Kuloyo3
,
Mariana Erasmus3
, Errol Cason3
, Esta van Heerden3
, Gaetan Borgonie4
, Thomas L. Kieft5
,
Jana Olivier2
and Tullis C. Onstott1
1
Department of Geosciences, Princeton University, Princeton, NJ, USA
2
Department of Environmental Sciences, School of Agriculture and Environmental Sciences, University of South Africa, Florida, South Africa
3
Department of Microbial, Biochemical and Food Biotechnology, University of the Free State, Bloemfontein, South Africa
4
Extreme Life Isyensya, Gentbrugge, Belgium
5
Biology Department, New Mexico Institute of Mining and Technology, Socorro, NM, USA
Edited by:
D’Arcy Renee Meyer-Dombard,
University of Illinois at Chicago, USA
Reviewed by:
Trinity Hamilton, Pennsylvania State
University, USA
Stephanie Ann Carr, Colorado
School of Mines, USA
*Correspondence:
Cara Magnabosco, Department of
Geosciences, Guyot Hall, Princeton
University, Princeton, NJ 08544,
USA
e-mail: cm13@princeton.edu
South Africa has numerous thermal springs that represent topographically driven meteoric
water migrating along major fracture zones. The temperature (40–70◦C) and pH (8–9)
of the thermal springs in the Limpopo Province are very similar to those of the low
salinity fracture water encountered in the South African mines at depths ranging from
1.0 to 3.1 km. The major cation and anion composition of these thermal springs are very
similar to that of the deep fracture water with the exception of the dissolved inorganic
carbon and dissolved O2, both of which are typically higher in the springs than in the
deep fracture water. The in situ biological relatedness of such thermal springs and the
subsurface fracture fluids that feed them has not previously been evaluated. In this
study, we evaluated the microbial diversity of six thermal spring and six subsurface
sites in South Africa using high-throughput sequencing of 16S rRNA gene hypervariable
regions. Proteobacteria were identified as the dominant phylum within both subsurface
and thermal spring environments, but only one genera, Rheinheimera, was identified
among all samples. Using Morisita similarity indices as a metric for pairwise comparisons
between sites, we found that the communities of thermal springs are highly distinct from
subsurface datasets. Although the Limpopo thermal springs do not appear to provide a
new window for viewing subsurface bacterial communities, we report that the taxonomic
compositions of the subsurface sites studied are more similar than previous results would
indicate and provide evidence that the microbial communities sampled at depth are more
correlated to subsurface conditions than geographical distance.
Keywords: subsurface, thermal springs, diversity, 16S rRNA gene, V6 hypervariable region
INTRODUCTION
Although Whitman et al. (1998) estimated that the terrestrial
subsurface biosphere comprises 40–50% of the world’s biomass;
comprehensive surveys of its phylogenetic diversity and distribu-
tion are geographically sparse relative to the immense volume the
subsurface encompasses. Traditionally, mines and drilling have
been used to access the deep biosphere; however, these activi-
ties are costly and alternative means of studying the subsurface
are desired. Deming and Baross (1993) were among the first to
propose that deep-sea hydrothermal vents could provide “win-
dows” to the deep biosphere of the oceanic crust. This was based
upon the reasoning that only subsurface hyperthermophiles could
survive within the hydrothermal vent fluids and that these flu-
ids are representative of the sub-seafloor ocean crust at ridges
and, by extension, the deep ocean crust globally. More recently,
serpentinite seeps and springs have become a popular site for
viewing the marine subsurface (Schrenk et al., 2010) as well as the
terrestrial subsurface biosphere in California (Barnes et al., 1967;
Morrill et al., 2013; Suzuki et al., 2013), Canada (Brazelton et al.,
2012, 2013; Szponar et al., 2013), Portugal (Marques et al., 2008),
Turkey (Hosgörmez, 2007), Yugoslavia, and Oman (Barnes et al.,
1978). The reasoning is that the extremely high pH of these fluids
(pH 10–12) can only support subsurface alkaliphilic microor-
ganisms and that these fluids are representative of the ultrabasic
serpentinite at depth. These springs provide an attractive target
for sampling the terrestrial subsurface at lower cost; however, only
a handful of terrestrial serpentinite sites are known and studied.
In order to obtain a global picture of the deep terrestrial subsur-
face, more surficial, terrestrial portals need to be studied and the
means for identifying which microorganisms are truly “denizens”
www.frontiersin.org December 2014 | Volume 5 | Article 679 | 1
Magnabosco et al. Subsurface and thermal water diversity
of the deep as opposed to spring communities merits further
investigation (Brazelton et al., 2012).
Thermal springs are widespread across the continents.
Thermal water emerging at the surface has been warmed as
a result of volcanic activity or deep circulation of ground-
water (Todd, 1980). Gravity driven circulation can transport
meteoric water to considerable depths, along fracture zones or
dykes, before resurfacing at thermal springs. As water pene-
trates underground, it is believed to warm at a rate of approx-
imately 2–3◦C per 100 m (geothermal gradient) (Press and
Siever, 1986) and, thus, the temperature of a thermal spring is
directly related to both the depth of water penetration and the
rate at which it ascends to the surface (Grasby and Hutcheon,
2001).
There are over 90 thermal springs identified within South
Africa (Olivier et al., 2011) and, since volcanic activity has not
occurred in over 90 million years, these thermal springs have been
attributed to the deep circulation of groundwater (Olivier et al.,
2008). The bacterial and algal diversity of the springs have been
reported by Tekere et al. (2011, 2012) and Jonker et al. (2013)
along with geochemical data (Olivier et al., 2008). Additionally,
South Africa is home to 1600 mines and 8 of the 10 deepest
mines in the world (Kidd Creek Mine and Creighton Mine of
Canada are the other two). Extensive studies of the water biodi-
versity and geochemistry have been reported (Takai et al., 2001;
Moser et al., 2003, 2005; Kieft et al., 2005; Gihring et al., 2006;
Lin et al., 2006a,b; Borgonie et al., 2011). The thermal springs of
the Limpopo Province occur at low elevations, in the Lowveld,
whereas the mines used to access the subsurface meteoric water
occur at high elevations, in the Highveld mostly. In principle the
meteoric water recharging the water in the Highveld and migrat-
ing to depth could be the source of thermal spring discharge in the
Lowveld on a regional scale. This unique hydrogeological setting
and infrastructure in South Africa provides an unprecedented
opportunity to compare the microbial communities of deep frac-
ture water microbial communities to those of thermal springs and
assess whether the latter provide portals to the deep biosphere.
This study is the first multi-site comparison of thermal springs
and deep subsurface fracture waters in South Africa to address
this question.
MATERIALS AND METHODS
As a preliminary investigation of the biological connectivity of
thermal springs to the subsurface, 6 thermal springs (Eiland,
Mphephu, Sagole, Siloam, Souting, Tshipise) and the fracture
water from 6 mines, Beatrix gold mine (Be326), Driefontein
gold mine (Dr5IPC), Finsch diamond mine (FI88), Masimong
gold mine (MM51940), Zondereinde platinum mine (NO14),
and Tau Tona gold mine (TT109) were sampled. The thermal
springs are distributed over a distance of 120 km in the Limpopo
Province of northern South Africa. The mines occur of a dis-
tance of 500 km from northern South Africa to central South
Africa. Access to these sites is difficult and, therefore, samples
for thermal spring and subsurface datasets were collected sepa-
rately and later combined for the purpose of this study. A more
detailed description of sample collection and analysis is provided
below.
SAMPLE COLLECTION AND DNA EXTRACTION
Thermal spring and subsurface samples were collected using
separate procedures. Notably, the geochemical descriptions of
Mphephu, Sagole, Siloam, and Tshipsie thermal springs have
been previously published in Olivier et al. (2011). For both
thermal spring and subsurface locations, water quality measure-
ments such as temperature, pH, electrical conductivity (EC), and
total dissolved salinity (TDS) were made in situ using hand-
held probes (thermal spring: Mettler Toledo meters; subsurface:
Hanna Instruments). Biological samples from thermal springs
represent a combination of both the planktonic and biofilm com-
munities, whereas the subsurface samples encapsulate only the
planktonic community.
In total, six thermal springs were sampled in the Limpopo
province of South Africa, five from locations within the pools
where the spring water was emerging from the ground and one,
Siloam, from both the pool and from a pipe inserted into the
spring source (Tekere et al., 2011, 2012). Analysis for chemi-
cal parameters of the thermal spring water was performed at
the Institute for Soil, Climate, and Water (Agricultural Research
Council; Pretoria, South Africa) and described in Olivier et al.
(2011). Water from Eiland and Souting thermal spring were ana-
lyzed in parallel with these samples but not included in the
Olivier et al. (2011) publication. For each thermal spring, 2 L of
water were filtered onto a 1.2-µm pore size nitrate cellulose fil-
ter and biofilm samples were collected and centrifuged at 2,000×
g for 10 min. Upon collection, samples were placed in cooler
boxes without temperature control and transported back to the
University of South Africa for subsequent analysis. DNA was
extracted from both the filter and cell pellet using the Genomic
DNA Tissue Mini-Prep Kit (Zymo Research) with an additional
DNA wash step (Tekere et al., 2011). DNA extracts from the
biofilm and filter were pooled for each site and sequenced. In
order to estimate the minimum depth from which the thermal
water had originated, we subtracted the mean annual surface tem-
perature from the in situ temperature of the water as an estimate
for how much the thermal water had warmed at depth and then
divided this value by the geothermal gradient in the region. In
this calculation, we assumed that the average annual temperature
of the Limpopo province was 20◦C and that the geothermal gra-
dient was between 20◦C km−1 and 30◦C km−1 (Dhansay et al.,
2014).
Access to deep fracture water for sampling was obtained
through boreholes located within gold, platinum and diamond
mines throughout South Africa that have been drilled by the
mines to detect water-filled fractures and, thus, prevent flood-
ing in the mine. At each underground site, the borehole was
opened and water was allowed to flow freely for 5 min to flush
the borehole of contaminants. Subsurface fracture water and gas
was analyzed using previously published methods (Lin et al.,
2006a; Onstott et al., 2006; Lollar et al., 2008). An autoclaved,
stainless steel manifold was attached to the borehole and con-
nected to a stainless steel casing containing a pleated, 25-cm
long Memtrex NY filter (MNY filter; Cat. No. MNY-91-1-AAS or
MNY-92-1-AAS, General Electric Co.). Water was allowed to flow
at a rate of ∼4 L/min through the filter and left for a period of
approximately 2 weeks to collect biomass. The volume of water
Frontiers in Microbiology | Extreme Microbiology December 2014 | Volume 5 | Article 679 | 2
Magnabosco et al. Subsurface and thermal water diversity
that flowed through the filter was measured with a flow accu-
mulator and the amount of captured biomass was estimated by
multiplying this volume by the cell counts (Supplement Table 1).
The filters were transported back to Princeton using a MVE ZC
20/3V vapor shipper and stored at −80◦C until further process-
ing. The borehole located in the Beatrix gold mine was sampled
on two occasions, January 25, 2011 and July 27, 2012, and are
reported as Be326_11 and Be326_12, respectively. DNA extrac-
tion from the MNY filters was performed as outlined in Lau et al.
(2014).
SEQUENCING
Extracted DNA from the thermal springs underwent two steps
of PCR amplification. DNA was first amplified using universal
degenerate primers (27F and 1492R) (DeSantis et al., 2007) and
30 PCR cycles under the conditions outlined in Tekere et al.
(2011). After amplification, the entire PCR was loaded onto a 1%
agarose gel and an approximately 1500-base pair (bp) band was
excised and DNA was recovered using the GeneJET gel extrac-
tion kit (Fermentas). The V4-7 region was then amplified using
the primers outlined in Table 1 and an annealing temperature
of 56◦C for 30 cycles. PCR product was then size-selected for
500–600-bp amplicons. Amplicons from each site were pooled
at equal concentration and sequenced using a GS-FLX-Titanium
(Roche) platform (Inqaba Biotechnology, South Africa).
The subsurface DNA samples were shipped to the Marine
Biological Laboratory (Woods Hole, MA) for sequencing. The V6
region of bacteria was first amplified for 25 cycles using a domain
specific amplification by unfused primers (Table 1) and followed
by a nested PCR for 5 cycles and fusion primers under the condi-
tions outlined in Eren et al. (2013b). Platinum Taq Hi-Fidelity
Polymerase (Life Technologies, Carlsbad CA) was used during
PCR amplification. A 101-bp paired-end run was performed on
one lane of an Illumina Hiseq 1000.
SEQUENCE ANALYSIS
The V4-7 hypervariable region of the 16S rRNA gene for the
thermal spring sites were classified using the Ribosomal Database
Project Classifier (Wang et al., 2007). A minimum bootstrap value
of 60% at the phylum level was applied to remove sequences with
poor annotation quality.
Upon the completion of subsurface V6 sequencing, paired
ends were joined and filtered under the requirement that the
forward and reverse paired-end reads needed to exhibit 100%
consensus in the overlap of the assembled sequence (Eren et al.,
2013b). Sequences that matched contaminating sequences previ-
ously identified in HiSeq runs at the Marine Biological Laboratory
were also removed (Hilary Morrison, personal communication)
(Supplement Table 2). Unique sequences and their respective
abundance were then identified in the filtered dataset using
the USEARCH (Edgar, 2010) “derep_prefix” command. Twelve
chimeras were identified and removed using USEARCH’s refer-
ence based chimera checker (Edgar et al., 2011) and Visualization
and Analysis of Microbial Population Structures (VAMPS) refV6
database (http://vamps.mbl.edu/data_downloads/refv6.tgz). This
was followed by a de novo chimera check (-uchime_denovo) that
removed one sequence from the total dataset.
The remaining sequences were annotated using the global
alignment for sequence taxonomy (GAST) algorithm (Huse et al.,
2008). GAST alignment was performed on a modified version
of the refV6 database provided by VAMPS designed to include
the V6 regions of bacteria belonging to Ignavibacteria (phylum
Chlorobi) and South African subsurface clones that have been
identified in previous subsurface studies (Takai et al., 2001; Moser
et al., 2003, 2005; Kieft et al., 2005; Gihring et al., 2006; Lin et al.,
2006a,b; Borgonie et al., 2011; Chehoud, 2011). Rather than pro-
viding an e-value like BLAST, GAST returns a GAST distance
that corresponds to a percent divergence of a queried sequence
away from its best match. Huse et al. (2008) reported that a
maximum distance cutoff of 0.15 is appropriate to maintain accu-
racy in taxonomic annotation and, thus, a 0.15 distance cutoff
was applied. In order to assess whether or not the fracture had
experienced significant contamination from mining processes, we
built a database of 16S rRNA sequences that had been previously
identified in mine water and mine air of the South African subsur-
face (Takai et al., 2001; Onstott et al., 2003; Gihring et al., 2006;
Lin et al., 2006a,b; Davidson et al., 2011). In total, these studies
identified 206 unique sequences of potential mining contami-
nants from the environment that represented a total of 70 genera.
These “potentially contaminating” genera were searched for in the
subsurface GAST annotations and their relative abundance was
calculated.
To generate operational taxonomic units (OTUs), thermal
spring sequences were first aligned using the RDP Infernal Aligner
(Version 1.1.rc4) and filtered to include only sequences that
aligned within the V4-7 region of the bacterial 16S rRNA gene
Table 1 | Primers used.
Environment Target variable Annealing Forward (F)/ Primer Primer Reference
region temperature Reverse (R) name sequence (5 to 3 ) for primer
Thermal Spring V4-7 56◦C F 530F GTGCCAGCMGCNGCGG Dowd et al., 2008
R 1073R ACGAGCTGACGACARCCATG Sundquist et al., 2007
Subsurface V6 60◦C F 967F CTAACCGANGAACCTYACC Sogin et al., 2006
CNACGCGAAGAACCTTANC
CAACGCGMARAACCTTACC
ATACGCGARGAACCTTACC
R 1064R CGACRRCCATGCANCACCT Sogin et al., 2006
www.frontiersin.org December 2014 | Volume 5 | Article 679 | 3
Magnabosco et al. Subsurface and thermal water diversity
sequence template (Cole et al., 2014). Subsurface sequences were
aligned in mothur (Schloss et al., 2009) against the aligned
greengenes “core set” (DeSantis et al., 2006) using a gap penalty
of −5. After alignment, a preliminary, pseudo-single linkage
clustering step (Huse et al., 2010) was applied to the aligned sub-
surface sequences using the “pre.cluster” command in mothur
(Schloss et al., 2009). The mothur platform was then used to gen-
erate a distance matrix (“dist.seqs,” calc=eachgap, countend=F)
from which average linkage clustering (“cluster.split”) was per-
formed. OTU clustering at the traditional 0.03 distance (97%
of identity or OTU0.03) threshold exhibited a high percentage
of singletons (>50%) that dramatically inflated the number of
observed OTUs in the subsurface sequences (Supplement Table
3). As the total subsurface dataset was very large, shared OTUs
were identified between sites through the following procedure:
(1) each OTU0.03 was represented by the most abundant member;
(2) sequences were merged and dereplicated using USEARCH; (3)
unique sequences were aligned using the RDP Infernal Aligner
(Version 1.1.rc4); (4) a distance matrix was constructed and clus-
tered in mothur as previously described; (5) shared OTUs were
identified as those OTUs that clustered at a distance of 0.0049 in
mothur.
Singletons were included in this study as the taxonomic dis-
tribution of the subsurface dataset was unaffected by singletons
at the phylum level (Supplement Figure 1A). The distribution of
annotation quality score, given by the GAST distance, for V6 sin-
gletons was slightly skewed to the right when compared to the
total V6 dataset due to an increased proportion of 0.01–0.02 range
GAST distances (Supplement Figure 2). Diversity results after the
removal of singletons are reported in Supplement Table 4.
Rarefaction curves, Pielou’s Evenness (Equation 1) (Pielou,
1967), Chao1 estimates (Equation 2) (Chao, 1984), and Sørensen
(Equation 3) (Sorensen, 1948) and Morisita (Equation 4)
(Morisita, 1959) similarity indices for all samples were calculated
on the genus level using the Vegan Package (Oksanen et al., 2013)
in R and following equations:
Pielou’s Evenness = H’/log2(Gobs) (1)
where H’ = − G
i = 1 pi log2 pi, pi is the proportion of genera i in
a sample, and Gobs is the number of genera observed in a sample.
Chao1 = Gobs + F2
1/2F2 (2)
where Gobs is the number of genera observed, F1 is the number of
observed singleton genera for a sample and F2 is the number of
observed doubleton genera for a sample.
Sørenson index =
2c
a + b
(3)
where a is the number of genera in sample 1, b is the number of
genera in sample 2, and c is the number of genera in common
between 1 and 2.
Morisita Index = Cλ =
2 G
i = 1 n1in2i
(λ1 + λ2)N1N2
(4)
where λj =
G
i = 1 nji(nji−1)
Nj(Nj−1) , nji is the number of individuals of
genera i in sample j and Nj is the number of individuals in
sample j.
The Morisita similarity index was calculated to compare sites
because, unlike the Sørensen index, it is robust to differences in
sample size (Wolda, 1981). The Morisita similarity index was then
transformed into what we designate as the “Morisita dissimilarity
index” (1-Morisita Index) for subsequent hierarchical clustering.
Although the majority of comparisons in this study were made
at the genus level, we also sought to identify what sequences were
shared between the thermal spring subsurface sites. To perform
this analysis, Bowtie (Langmead et al., 2009) was used to map sub-
surface V6 sequences to the thermal spring V4-7 dataset under
two schemes: (1) a perfect match scenario (-v 0); and (2) a 2
mismatches (-v 2) scenario.
In order to better assess the veracity of the taxonomic infer-
ences drawn from our V6 dataset, we employed oligotyping
techniques developed by Eren et al. (2013a) (http://oligotyping.
org/) to identify nucleotide level variation within the OTU
and genus levels. During oligotyping, the Shannon entropy
of each nucleotide position within a group of highly simi-
lar sequences, such as an OTU or genus, was calculated and
followed by a supervised strategy to identify and decompose
the variable sites into oligotypes. For this study, all subsurface
sequences found to be closely related (maximum GAST dis-
tance of 0.03) to Candidatus (Ca.) Desulforudis (n = 1381) and
Dehalogenimonas (n = 1, 226) were analyzed using this oligotyp-
ing pipeline. Shannon entropy profiles were generated using the
“entropy-analysis” command on the following groups of sub-
surface sequences: (1) all sequences related to Ca. Desulforudis;
(2) all sequences related to Dehalogenimonas; and (3) the largest
OTU0.03 of Dehalogenimonas (n = 260). These entropy profiles
were then used to select the appropriate number of components
(−c) for the “oligotype” command. A minimum substantive
abundance (−M) of 20 was applied to remove erroneous reads.
Notably, Ca. Desulforudis and Dehalogenimonas were selected
for oligotyping because they were the most abundant genera
identified within all subsurface sites.
STATISTICAL ANALYSIS
Individual sequences of both subsurface and thermal spring sites
were used in the implementation of weighted and unweighted
UniFrac significance tests (1,000 iterations, subsample = T)
(Lozupone and Knight, 2005). These tests were performed in
mothur to determine whether or not the communities within
each environment type (thermal spring or subsurface) were sig-
nificantly different from one another. FastTree (Price et al., 2009)
was used to generate the tree for UniFrac significance tests under
default settings with Methanobrevibacter woesei (NCBI accession
number DQ445721) as the outgroup.
A thermal spring geographic distance matrix and (separate)
subsurface geographic distance matrix were calculated from the
longitude and latitude coordinates of thermal spring and sub-
surface sampling locations using the “rdist.earth” command
in R. Each distance matrix was then correlated to its respec-
tive Morisita dissimilarity matrix using the “Pearson” function
Frontiers in Microbiology | Extreme Microbiology December 2014 | Volume 5 | Article 679 | 4
Magnabosco et al. Subsurface and thermal water diversity
in Excel. The resulting Pearson product-moment correlation
coefficient (PCC) was converted to an R2 value for future
comparisons.
In order to determine the subset of environmental vari-
ables with the highest correlation to the Morisita community
dissimilarity matrix, the “bioenv” command in the vegan R pack-
age was applied (Oksanen et al., 2013). This function builds a
Euclidean distance matrix (site × site) based on a subset of scaled
environmental variables. The PCC between the environmental
distance matrix and phylum-based Morisita community dissimi-
larity matrix was then calculated. This procedure was performed
on environmental distance matrices generated from all possible
subsets of environmental variables that the user inputs. For exam-
ple, environmental distance matrices were generated from all
possible combinations of surface elevation, temperature, depth,
pH, TDS, Na+, K+, Ca2+, Mg2+ of the thermal spring dataset.
The correlation between the 511 thermal spring environmental
distance matrices and the thermal spring Morisita dissimilarity
matrix were then, individually, calculated. The subset of envi-
ronmental variables that provided the distance matrix with the
highest correlation to the Morisita dissimilarity matrix was then
returned with a PCC and R2 value. The same procedure was
carried out on the subsurface dataset using the environmental
parameters of surface elevation, temperature, depth, pH, TDS,
biomass and the concentrations of Na+, K+, Ca2+, Mg2+, O2,
NO−
3 , Cl−, SO2−
4 , dissolved inorganic carbon (DIC), CH4, H2,
and dissolved organic carbon (DOC). Thermal spring and sub-
surface datasets were analyzed separately due to the fact that the
experimental design used to study these two environments was
different.
Additionally, pairwise (column × column) Pearson corre-
lations and significance were computed for a matrix contain-
ing environmental data and the relative abundance of each
phylum (columns) for each sample (rows) using the rcor.test
function (ltm R package; Rizopoulos, 2006). This analysis was
performed on the thermal spring and subsurface datasets, sep-
arately. Notably, the relative abundance of phyla for each group
(either thermal spring or subsurface) was calculated from the
average of subsampling each sample to 85% of the smallest sample
in the group over 1,000 iterations. Significance values (p-values)
returned by rcor.test were adjusted for multiple tests using the
“qvalue” package in R (Dabney et al., 2010). Only pairwise cor-
relations with a p-value of <0.05 and q of <0.05 were declared
significant.
RESULTS
GEOGRAPHIC LOCATION AND GEOCHEMISTRY
All six thermal springs are located within the Limpopo Province
of South Africa, within 120 km of each other. Four of the springs,
Mphephu, Sagole, Siloam, and Tshipise are located in sediments
and volcanic units of the Karoo Supergroup, ranged in elevation
from 446 to 841 masl. (Table 2A), and are likely fed by mete-
oric recharge in the Soutpansberg Mountains formed by Karoo
Supergroup sandstones. Eiland and Souting occur in Archean
gneiss. They occur in the Lowveld, east of the escarpment that
marks the boundary with the Highveld and range in elevation
from 389 to 433 masl. (Olivier et al., 2011).
The six mines are distributed over 500 km of the Kaapvaal
Craton and, with the exception of NO14, occur in the Highveld
with elevations ranging from 1375 to 1681 masl. (Table 2B).
NO14 was collected at the Zondereinde platinum mine, which
occurs in the Bushveld Igneous Complex. Geographically, it lies
closer to the thermal springs than to Finsch diamond mine
(FI88), Beatrix (BE326), or Masimong gold mines (MM51940)
(Supplement Figure 3).
Siloam was the warmest thermal spring with measured tem-
peratures of 63–67◦C, comparable to the hottest subsurface site,
NO14, with a measured temperature above 65◦C. The shallowest
subsurface sites (Dr5IPC and FI88) contained the coolest water
sampled (26.8◦C and 28.6◦C, respectively) and were more than
10◦C cooler than the coolest thermal spring sampled, Eiland
(40–42◦C). The thermal spring temperatures were consistent with
a minimum depth of ground water circulation ranging from
700–2250 m (Table 2A). These minimum depth estimates over-
lapped the 1046–3136 m below surface (mbs.) sampling depths of
the fracture water samples.
The pH of the six thermal springs sampled ranged from 7.6
(Eiland) to 9.7 (Sagole), whereas the pH of the subsurface frac-
ture water was more narrowly restrained from 7.4 (Dr5IPC) to
8.3 (Be326). The TDS of the thermal springs ranged from fresh
to brackish (237 ppm for Sagole to 10,130 ppm for Souting),
overlapping the TDS of the fracture water, which ranged from
188 (Dr5IPC) to 4473 ppm (Be326_11). The O2 concentra-
tion of the thermal springs ranged from 20 µM (Sagole) to
130 µM (Mphephu) and were elevated above the subsurface O2
concentrations that ranged from below detection (<1 µM) to
9.4 µM (Be326_2012). The thermal springs located in the Karoo
Supergroup had a sodium carbonate composition, whereas the
thermal springs located in the Archean gneiss had a sodium
chloride composition (Olivier et al., 2011). The fracture water
composition ranged from a calcium, magnesium carbonate
(Dr5IPC) to sodium chloride composition (Be326). When plot-
ted on a Durov projection Dr5IPC was geochemically very similar
to the Mphephu thermal spring water (Figure 1).
SEQUENCING SUMMARY
A total of 3,055 sequences from the V4-7 hypervariable region of
the 16S rRNA gene were generated for the thermal spring sites.
Sequences generated for each site varied in length (average length
360 ± 144 bp) (Supplement Figure 4) and number (Table 3). A
total of 291 genera within 17 phyla were observed in the thermal
springs after annotation quality filtering was applied.
The number of V6 sequences passing the 100% overlap qual-
ity filtering was 139,092 and ranged from 14,227 (Be326_2011) to
23,343 (Be326_2012) sequences per site. After annotation using
GAST, 87% (Dr5IPC) to 94% (Be326_2011) of the sequences
were assigned an annotation and used in downstream analy-
ses (Table 3). The number of genera identified for each site
ranged from 549 (Dr5IPC) to 655 (MM51940), and the num-
ber of OTU0.03 ranged from 5,952 (Be326_2011) to 9,456
(MM51940). A total of 874 genera spanning 44 phyla were
observed in the subsurface sequences. When singletons were
removed, a total of 616 genera were identified and the number of
OTU0.03 ranged from 2,478 (Be326_2011) to 3,987 (Be326_2012)
www.frontiersin.org December 2014 | Volume 5 | Article 679 | 5
Magnabosco et al. Subsurface and thermal water diversity
Table 2A | Physical and chemical properties of hot spring water samplesa.
Parameter Eiland Mphephu Sagole Siloam Souting Tshipise
Latitude (S) 23◦39 31 22◦54 20 22◦31 45.4 22◦53 22.6 23◦25 9 22◦36 31.5
Longitude (E) 30◦40 23.6 30◦10 38 30◦40 50 30◦11 39 30◦54 44 30◦10 16.7
Elevation (masl.) 433 796 446 841 389 542
Temperature (◦C) 40–42 43 45 63–67 40.1–43.9 58
Estimated depth (m)b 700–1050 767–1150 830–1250 1500–2250 730–1100 1267–1900
pH 7.63 8.08–8.19 9.24–9.70 8.8–9.5 7.8 8.3–8.94
TDS (ppm) >1862 275 237 252 10130 523
O2 (M) n.a. 1.3 × 10⁻⁴ 1.9 × 10⁻⁵ 6.9 × 10⁻⁵ n.a. 6.1 × 10⁻⁵
Na+ (M) 2.7 × 10⁻² 1.9 × 10⁻³ 2.8 × 10⁻³ 2.9 × 10⁻³ 1.5 × 10⁻¹ 6.8 × 10⁻³
K+ (M) 5.6 × 10⁻⁴ 2.9 × 10⁻⁵ 2.8 × 10⁻⁵ 7.2 × 10⁻⁵ 7.9 × 10⁻⁴ 1.1 × 10⁻⁴
Ca2+ (M) 1.3 × 10⁻³ 3.4 × 10⁻⁴ 3.3 × 10⁻⁵ 3.4 × 10⁻⁵ 6.0 × 10⁻³ 1.4 × 10⁻⁴
Mg2+ (M) 3.9 × 10⁻⁴ 4.6 × 10⁻⁴ 2.9 × 10⁻⁶ 5.5 × 10⁻⁴ 3.3 × 10⁻³ 6.7 × 10⁻⁶
NO−
3 (M) 4.0 × 10⁻⁵ 3.4 × 10⁻⁵ <d.l. <d.l. 4.3 × 10⁻⁵ 9.8 × 10⁻⁶
Cl− (M) 2.8 × 10⁻² 1.1 × 10⁻³ 1.4 × 10⁻³ 1.3 × 10⁻³ 1.6 × 10⁻¹ 4.8 × 10⁻³
SO2−
4 (M) 1.5 × 10⁻³ 9.5 × 10⁻⁵ 1.9 × 10⁻⁴ 1.1 × 10⁻⁵ 7.9 × 10⁻³ 5.5 × 10⁻⁴
HPO2−
4 (M) 2.6 × 10⁻⁴ <d.l. <d.l. <d.l. <2.5 × 10⁻⁵ 2.8 × 10⁻⁵
DIC (M) <d.l. 2.5 × 10⁻³ 2.0 × 10⁻³ 2.0 × 10⁻³ n.a. 2.2 × 10⁻³
aThis table is adapted from Olivier et al. (2011). Adaptions include the conversion of the various geochemical quantities of Mphephu, Sagole, Siloam, and Tshipise
into molar concentrations and the addition of Eiland and Souting into the dataset.
bEstimated depth = (temperature − mean annual surface temperature)/geothermal gradient, where the mean annual surface temperature was assumed to equal
20 ◦C and the geothermal gradient was assumed to be 20 ◦C km−1 and 30 ◦C km−1.
masl., meters above sea level; n.a., data not available; <d.l., below detection limit.
Table 2B | Physical and chemical properties of fracture water samples.
Parameter Be326_2011 Be326_2012 Dr5IPC FI88 MM51940 NO14 TT109_Bh2
Sampling Code FW250111Bh2 FW270712Bh2 FW280711 FW031012 FW200712 FW130912 FW060312
Latitude (S) 28◦14 24.3 28◦14 24.3 26◦25 12 28◦22 43 27◦58 24 24◦49 43 26◦24 55
Longitude (E) 26◦47 49.2 26◦47 49.2 27◦30 10 23◦26 45 26◦52 39 27◦20 26 27◦27 45
Surface Elevation (masl.) 1375 1375 1654 1545 1386 985 1681
Depth (mbs.) 1339 1339 1046 1056 1900 2100 3136
T (◦C) 36.9 38.1 26.8 28.6 40.7 >65** 48.7
pH 8.83 8.55 7.39 7.9 7.71–8.18 8.48 8.19
TDS (ppm) 4473 3586 188 1282 3120 2374 296
O2 (M) <3.1 × 10⁻⁷ 9.4 × 10⁻⁶ 1.9 × 10⁻⁶ 1.3 × 10⁻⁶ 1.9 × 10⁻⁶ 3.1 × 10⁻⁶ 6.3 × 10⁻⁶
CH4(M) 2.0 × 10⁻³ 9.0 × 10⁻⁴ 2.6 × 10⁻⁵ <10−4 8.9 × 10⁻³ 3.2 × 10⁻⁴ 2.3 × 10⁻³
H2 (M) 1.3 × 10⁻⁷ 8.9 × 10⁻⁹ 3.2 × 10⁻⁹ <10−8 1.9 × 10⁻⁷ 4.5 × 10⁻⁶ 3.6 × 10⁻⁷
Na+ (M) 7.8 × 10⁻² 4.8 × 10⁻² 2.2 × 10⁻³ 9.9 × 10⁻³ 4.5 × 10⁻² 9.4 × 10⁻² 3.4 × 10⁻³
K+ (M) 7.3 × 10⁻⁴ 8.5 × 10⁻⁴ 5.6 × 10⁻⁵ 1.8 × 10⁻⁴ 4.0 × 10⁻⁴ 4.1 × 10⁻³ 4.2 × 10⁻⁵
Ca2+ (M) 2.9 × 10⁻³ 3.9 × 10⁻³ 5.0 × 10⁻⁴ 5.6 × 10⁻³ 1.9 × 10⁻³ 2.5 × 10⁻³ 5.2 × 10⁻⁴
Mg2+ (M) 5.6 × 10⁻⁵ 2.6 × 10⁻⁵ 4.0 × 10⁻⁴ 1.5 × 10⁻⁴ 9.9 × 10⁻⁵ 6.4 × 10⁻⁴ 3.4 × 10⁻⁵
NO−
3 (M) 3.7 × 10⁻⁷ 6.0 × 10⁻⁶ 1.5 × 10⁻⁶ 1.5 × 10⁻⁵ 9.7 × 10⁻⁷ n.a. 1.1 × 10⁻⁷
Cl− (M) 7.0 × 10⁻² 6.2 × 10⁻² 1.4 × 10⁻³ 2.2 × 10⁻² 5.5 × 10⁻² 5 × 10⁻² 3.2 × 10⁻³
SO2−
4 (M) 1.4 × 10⁻⁴ 6.2 × 10⁻⁴ 1.4 × 10⁻⁴ 3.0 × 10⁻⁴ 7.0 × 10⁻⁶ n.a. 1.0 × 10⁻⁴
HPO2−
4 (M) <1.1 × 10⁻⁶ 3.0 × 10⁻⁷ 1.6 × 10⁻⁷ 3.5 × 10⁻⁷ <3.2 × 10⁻⁷ 1.1 × 10⁻⁷ 1.2 × 10⁻⁶
DOC (M) 1.5 × 10⁻⁵ 2.9 × 10⁻⁵ 8.5 × 10⁻⁵ 1.3 × 10⁻⁴ 4.5 × 10⁻⁵ 2.6 × 10⁻⁵ 3.9 × 10⁻⁵
DIC (M) 5.1 × 10⁻⁴ 3.3 × 10⁻⁴ 2.4 × 10⁻³ 5.4 × 10⁻⁵ 4.3 × 10⁻⁴ 5.2 × 10⁻⁴ 6.9 × 10⁻⁴
DIC Age (kyr) >32 >20 16–23 >32 >32 4.28 16-21
**65◦C was the upper temperature limit of the thermometer used.
masl., meters above sea level; mbs., meters below surface; n.a., data not available.
Frontiers in Microbiology | Extreme Microbiology December 2014 | Volume 5 | Article 679 | 6
Magnabosco et al. Subsurface and thermal water diversity
(Supplement Table 3). Of the 258 genera that were represented
solely by a single sequence at any subsurface site, 125 were
“true” singletons—meaning that the genus was represented by
only 1 sequence in the combined subsurface dataset. Upon
removal of the 258 singleton genera, the taxonomic distribution
and similarity indices remained largely the same (Supplement
FIGURE 1 | Durov plot of thermal spring and subsurface chemistry.
Geochemical parameters of thermal spring (filled circles) and subsurface
(open circles) are plotted on a Durov Plot.
Figure 1) and, thus, singletons were included in the subsequent
analyses.
TAXONOMIC DISTRIBUTION OF THERMAL SPRINGS
Rarefaction curves (Supplement Figure 5) revealed that
sequences from Eiland, Mphephu, Sagole and Siloam thermal
springs captured more of the diversity within those sites than
the limited number of sequences from Souting (n = 132)
and Tshipise (n = 120) thermal springs did. A comparison
of the observed number of genera vs. the number estimated
by the Chao1 parameter (Chao, 1984) suggested that the
sequences represent 47% (Tshipise) to 68% (Mphephu) of
the predicted total number of genera present in the thermal
springs (Table 3). All thermal spring samples yielded taxonomic
distributions that were found to be significantly different
(p < 0.001) from one another through both weighted and
unweighted pairwise Unifrac significance tests (Lozupone and
Knight, 2005). Four of the six thermal springs (Eiland, Siloam,
Souting, and Tshipise) were found to be dominated (>50%)
by Proteobacteria, whereas approximately 55% of Mphephu’s
sequences belonged to Bacteroidetes. Sagole’s most abundant
phylum was Cyanobacteria (32%) (Figure 2). Souting was
found to be the thermal spring site with the highest even-
ness (Pielou’s evenness = 0.83; Table 3) with 30 different
genera of Gammaproteobacteria present. Eiland exhibited
the lowest Pielou’s evenness (0.57) with 60% of sequences
belonging to two genera of Proteobacteria: Hydrogenophaga
(class Betaproteobacteria) and Stenotrophomonas (class
Gammaproteobacteria). Sequences from Siloam contained
the highest number of unique genera (119), whereas Tshipise
Table 3 | Summary of diversity statistics for thermal spring and subsurface samples.
Site Number of Number of reads Number of Pielou’s Chao1a
reads classified by RDP* or GAST∧ genera observed evenness
Eiland 720 698 (97%)b 49 (62%)c 0.57 79 ± 19
Mphephu 721 673 (93%)b 92 (68%)c 0.69 135 ± 20
Sagole 794 662 (83%)b 113 (59%)c 0.72 190 ± 30
Siloam 568 515 (91%)b 119 (57%)c 0.78 209 ± 34
Souting 132 120 (91%)b 39 (57%)c 0.83 68 ± 21
Tshipise 120 110 (92%)b 30 (47%)c 0.74 64 ± 31
Total thermal springs 3,055 2, 778 (91%)b 291 (70%)c 0.73 412 ± 31
Beatrix Au Mine—Be326_2011 14,227 13, 328 (94%)d 551 (77%)c 0.80 716 ± 37
Beatrix Au Mine—BE326_2012 23,343 21, 806 (93%)d 634 (86%)c 0.80 739 ± 25
Driefontein Au Mine—Dr5IPC 18,215 15, 876 (87%)d 549 (84%)c 0.80 653 ± 24
Finsch Diamond Mine—FI88 18,719 17, 282 (92%)d 573 (79%)c 0.78 725 ± 34
Masimong Au Mine—MM51940 22,984 20, 768 (90%)d 655 (86%)c 0.80 760 ± 24
Zondereinde Pt Mine—NO14 22,237 20, 676 (93%)d 640 (86%)c 0.79 744 ± 24
Tau Tona Au Mine—TT109 19,367 17, 792 (92%)d 569 (83%)c 0.77 689 ± 27
Total subsurface 139,092 127, 528 (92%)d 874 (88%)c 0.77 991 ± 28
aChao1 is estimated at the genus level.
bMinimum bootstrap value of 60% at phylum level.
cObserved Genera/Chao1 in percent.
d Maximum distance of 0.15.
www.frontiersin.org December 2014 | Volume 5 | Article 679 | 7
Magnabosco et al. Subsurface and thermal water diversity
FIGURE 2 | Thermal spring taxonomic distribution. A bar plot of the
relative abundance (x-axis) of various phyla (color) per thermal spring
site (y-axis). Due to its high relative abundance, the phylum
proteobacteria was split into its corresponding classes. Members of
the “Other” bin include: Armatimonadetes, Spirochaetes, SR1, and
Synergisetes.
contained the fewest unique genera (30) (Table 3). No sequences
derived from Tshipise were related to Alphaproteobacteria.
TAXONOMIC DISTRIBUTION OF SOUTH AFRICAN SUBSURFACE SITES
Although the subsurface rarefaction curves (Supplement Figure
5) did not attain a plateau, the reduced slope of each curve
toward the terminus suggested that the sequences for each of
these samples are representative of their bacterial community.
Across all sites, Proteobacteria were the most abundant phylum,
with relative abundances ranging from 49% (Dr5IPC) to 59%
(Be326_2012) (Figure 3). Weighted, pairwise Unifrac signifi-
cance tests indicated that all sites were significantly different
(p < 0.001); however, unweighted, pairwise UniFrac significance
tests revealed that only 7 of the 21 pairs of sites were found to be
significantly different (p < 0.05) from one another (Supplement
Figure 6). All subsurface sites displayed a Pielou’s evenness
between 0.77 (TT109) and 0.80 (MM51940) (Table 3). Previous
studies of South African fracture fluids (Takai et al., 2001; Moser
et al., 2003, 2005; Kieft et al., 2005; Gihring et al., 2006; Lin et al.,
2006a,b; Borgonie et al., 2011) identified a total of 243 unique
genera in the South African subsurface (Chehoud, 2011). Of these
243 genera, 139 were observed in our V6 datasets.
POTENTIAL CONTAMINANTS IN THE SUBSURFACE
Within the subsurface V6 dataset, 49 of the 70 designated con-
taminant genera (see Section Sequence Analysis) were identified
in our subsurface samples. The relative abundance of these genera
ranged from 4.3% (Dr5IPC) to 8.6% (Be326_2012) of each site’s
V6 dataset. Unfortunately, we cannot unambiguously determine
whether or not these genera are true contaminants because min-
ing water is a mixture of water released during dewatering of
fractures and water derived from regional water supplies; how-
ever, we make the conservative assumption that they could be
contaminants that penetrated the fractures during drilling with
mining water.
OLIGOTYPING
Oligotyping was performed on all subsurface sequences related to
the two most abundant subsurface genera, Ca. Desulforudis and
Dehalogenimonas, to identify nucleotide level variation within
the OTU and genus level. A total of 1,381 sequences were
identified as related to Ca. Desulforudis while 1,226 sequences
were identified as related to Dehalogenimonas representing 62
and 164 OTUs at the 97% identity level, respectively. Entropy
profiles for all sequences from each genus can be found in
Figures 4Ai,B. Eren et al. (2013a) reported that random sequenc-
ing errors generate entropy values near or below 0.2. For Ca.
Desulforudis, 59 of the 61 positions exhibited Shannon entropy
values less than 0.2, while the remaining two positions had
entropy values of 0.2487 and 0.2125. Oligotyping of these 2
positions (−c 2, −M 20) revealed that only one oligotype was
present (Figure 4Aii), suggesting that the Ca. Desulforudis genus
Frontiers in Microbiology | Extreme Microbiology December 2014 | Volume 5 | Article 679 | 8
Magnabosco et al. Subsurface and thermal water diversity
FIGURE 3 | Subsurface taxonomic distribution. A bar plot of the
relative abundance (x-axis) of various phyla (color) per subsurface
site (y-axis). Due to its high relative abundance, the phylum
proteobacteria was split into its corresponding classes. Members
of the “Other” bin include: BRC1, Caldiserica, Chlamydiae,
Chloroplast, Crenarchaeota, Dictyoglomi, Elusimicrobia, Euryarchaeota,
Fibrobacteres, Gemmatimonadetes, Lentisphaerae, Mitochondria, OP1,
OP2, OP8, OP10, OP11, Spirochaetes, Synergistetes, TA06,
Tenericutes, TG-1, Thermotogae, TM6, TM7, WS1, WS3, WS6, and
Zetaproteobacteria.
identified within the subsurface contain highly similar V6 regions.
On the other hand, the Shannon entropy profile of all sequences
related to Dehalogenimonas showed that 33 of the 61 positions
of the V6 region contained entropy values greater than 0.2
(Figure 4B). Due to the large number of high entropy posi-
tions in Dehalogenimonas-related V6 sequences, oligotyping was
performed on the most abundant OTU0.03 (n = 260) instead
of the complete set of sequences assigned to this genus. For
this OTU, Shannon entropy profiles indicated two high entropy
positions that decomposed into 2 oligotypes (−c 2, −M 20;
Figure 4C).
SHARED TAXA
There was a very large difference between the communities of
individual thermal springs. No individual sequence was found in
multiple thermal spring sites, however, when sequences were clus-
tered into OTUs at a distance of 0.03, two OTU0.03 were shared
between Eiland and Mpephu, one OTU0.03 was shared between
Eiland and Sagole, and one OTU0.03 was shared between Sagole
and Siloam. At the genus level, Sagole and Siloam shared the
greatest number of genera (n = 41; Sørensen index = 0.35) while
Souting and Tshipise shared the lowest number of genera (n = 5;
Sørensen Index = 0.14) (Figures 5A,B).
All seven subsurface samples shared 220 genera and 1410 V6
sequences. Shared V6 sequences were present at similar rela-
tive abundances within each subsurface site (Supplement Figure
7). NO14 and MM51940 shared the most genera (n = 551)
and exhibited the highest Sørensen indices (0.85) (Figures 5A,B,
respectively). At the OTU0.03 level, Sørensen similarity indices
ranged from 0.59 to 0.69 between sites—a range higher than
previously reported in the South African subsurface (Figure 6).
When singleton genera were removed, Sørensen indices increased
slightly (0.70–0.85 to 0.80–0.88), while Morisita dissimilarity
indices remain unchanged (Figures 5B,D; Supplement Figure
1B,D).
A direct alignment of subsurface V6 sequences onto the
collection of thermal spring sequences allowed us to determine
whether or not subsurface V6 sequences were present in the
thermal springs. However, only 367 (12%) of thermal spring
sequences were long enough to capture the V6 region of the
16S rRNA gene and, therefore, this direct comparison of V6
sequences is not a complete representation of the presence or
absence of V6 sequences shared between both environments.
Despite this shortcoming, through alignment, we found that
13 thermal spring V6 sequences were present in the subsurface
samples (Supplement Figure 8A). These shared sequences were
related to Proteobacteria, Bacteroidetes, Deinococcus-Thermus,
and Fusobacteria. Five of the 13 shared sequences were present
in all seven subsurface V6 datasets. When a 2-bp mismatch
was allowed, only 2 additional thermal spring sequences
[relating to Azonexus (Proteobacteria) and Propionigenium
(Fusobacteria)] were identified in the subsurface (Supplement
www.frontiersin.org December 2014 | Volume 5 | Article 679 | 9
Magnabosco et al. Subsurface and thermal water diversity
FIGURE 4 | Oligotypes of abundant genera. Entropy profiles for
Desulforudis (Ai), Dehalogenimonas (B), and Dehalogenimonas OTU1 (Ci)
are a discrete xy plot where the x-axis is the nucleotide position in the
alignment and the y-axis is the calculated Shannon entropy for that position.
Figures (Aii) and (Cii) display the relative abundance of the oligotypes
observed. For Desulforudis, only one oligotype (AA) was observed while
Dehalogenimonas revealed two oligotypes (AA, GG). The position of these
distinctive nucleotides can be found in the entropy plot of (Ci). The elevated
entropy at positions 1 and 40 reveal that these positions are where the single
nucleotide changes occur.
Figure 8B). As the occurrence of sequences within multiple sub-
surface samples may be a result of contamination from surface
water sources during mining, we also compared the genera of
sequences shared between the thermal spring and subsurface
environments with the genera in our mining contaminant
dataset (see Section Sequence Analysis). We found that 4 of
the 12 genera (Blastomonas, Novosphigmodium, Meithermus,
and Rheinheimera) identified in both thermal springs and
subsurface sites were also identified as possible mining
contaminants.
RELATIONSHIP OF TAXONOMY TO ENVIRONMENT
After performing a pairwise-Pearson correlation for all combina-
tions of phyla and environmental variables in the thermal spring
and subsurface datasets (separately), no significant correlations
were found. However, we were able to identify which sets of
environmental variables had the highest correlation to each envi-
ronment’s respective Morisita dissimilarity matrix. The Morisita
dissimilarity matrix of the thermal springs was most correlated
to a Euclidian distance matrix constructed from the scaled values
of surface elevation and pH (R2 = 0.20). The subsurface Morisita
dissimilarity matrix was most correlated to a Euclidian distance
matrix constructed from the scaled values of surface elevation,
pH, TDS and the concentrations of O2, Ca+, DIC, CH4, and
Cl− (R2 = 0.83). The geographical distance matrices were not
highly correlated to the thermal spring (R2 = 0.03) or subsurface
(R2 = 0.12) Morisita dissimilarity matrices.
DISCUSSION
The similarity in geochemistry of the Limpopo thermal springs
and South African subsurface suggested that the springs might
provide a portal to the deep biosphere. However, although
Proteobacteria dominated the majority of thermal spring and
subsurface sites, there are more differences than similarities when
the microbial communities of the thermal springs and subsurface
sites are compared.
DIFFERENCES IN THE DIVERSITY OF THERMAL SPRINGS AND
SUBSURFACE SITES
In order to compare the community composition of various envi-
ronments, Morisita dissimilarity indices (MDI) were calculated
for all pairs of samples (Figure 5D). Hierarchical clustering of
this dissimilarity matrix indicates that the communities of ther-
mal springs and subsurface environments are distinct from one
another (Figure 5C). Although Mphephu and Dr5IPC were, geo-
chemically, the most similar thermal spring and subsurface frac-
ture, they are, taxonomically, further apart from each other (MDI:
0.99) than Mphephu is from the geochemically quite dissimilar
thermal spring of Souting (MDI: 0.92). The number of genera
observed in the thermal springs (30–119) was much lower than
in the subsurface sites (549–655), although this may reflect the
smaller sample volumes and lower number of reads of the thermal
spring samples (see Section Comments on Experimental Design).
Within environment types, the microbial communities of thermal
springs exhibited higher MDIs (MDIs 0.45–0.99) when compared
Frontiers in Microbiology | Extreme Microbiology December 2014 | Volume 5 | Article 679 | 10
Magnabosco et al. Subsurface and thermal water diversity
FIGURE 5 | Measurements of similarity between thermal spring and
subsurface sites. Pair-wise comparisons have been made by counting
the total number genera shared between sites (A) and calculation of
the Sorensen similarity index (B) and Morisita dissimilarity indices
(1-Morisita index) (D). Color-coding of (A,B,D) are purely for visual aid
where red indicates more similar pairs and blue is indicative of more
distant pairs. The diagonal of (A) indicates the number of genera
identified in the sample. (C) is a visual representation of the
hierarchical clustering of the Morisita dissimilarity matrix
(D). Subsurface sites in (C) are labeled with pink squares and thermal
spring sites are labeled with green circles. The columns of (D) are
indicated by the branches of (C) whereas the columns of (A,B) are
labeled. Black squares labeled 0.00 in (D) indicate the same sample
in the row and (C)’s branch.
to the subsurface samples (MDIs 0.04–0.49). It has been well
reported that the microbial communities of hot springs are highly
variable due to effects of water flow, hail, trampling, and sea-
sonal variation (Brock and Brock, 1969; Ferris et al., 1997; Ward
et al., 1998; Fouke et al., 2003). Tekere et al. (2012) attributed
the distinctive taxonomic distributions of the Limpopo thermal
springs to differences in geographical settings such as the large
populations of fermentative Bacteroidetes found at the Mphephu
springs—a site with a high input of organic carbon from the sur-
rounding vegetation. Furthermore, as the thermal spring dataset
is a combination of planktonic and biofilm communities, it is
likely that the biofilm communities play a large role in the inter-
site variation observed in the thermal springs. Fouke et al. (2003)
and Meyer-Dombard et al. (2011) have reported that the com-
munities formed on a biofilm can vary locally even when fed by
the same source water. For the thermal springs sampled, only one
section of each spring’s biofilm was collected and analyzed in con-
junction with 2 L of filtered water. The small sample size in the
thermal spring dataset undoubtedly amplifies local effects within
a thermal spring community and further elevates the amount of
variation observed between thermal spring samples.
UBIQUITOUS MICROORGANISMS
The only genus observed in all 13 datasets was a heterotrophic,
non-spore forming Gammaproteobacteria, Rheinheimera. The
relative abundance of this genus was highly variable between ther-
mal spring sites (maximum: 35% for Tshipise; minimum: 0.1%
for Eiland) and only a trace component of subsurface samples
(<0.1%). Isolated species of Rheinheimera have been found in
marine and soil environments with a maximum growth tempera-
ture of ∼40◦C (Brettar et al., 2006; Yoon et al., 2007; Zhang et al.,
2008), making it surprising that Rheinheimera would dominate
a warmer thermal spring site and not the other, cooler loca-
tions. This suggests that the strain of Rheinheimera observed in
Tshipise is adapted to higher temperatures than previously iso-
lated species. Despite the low relative abundance of Rheinheimera
in the subsurface samples, Rheinheimera has been identified in
two other South African sites. One was an isolate from a water
sample from the Transvaal dolomite chamber of Driefontein 4
shaft, Dr4IPC, (NCBI accession number DQ133435) and the
other was from an earlier 16S rRNA gene clone library of Be326
(n = 3) (Borgonie et al., 2011), the same borehole that was sam-
pled twice in this study. Due to the low relative abundance of
www.frontiersin.org December 2014 | Volume 5 | Article 679 | 11
Magnabosco et al. Subsurface and thermal water diversity
FIGURE 6 | Sørensen similarity index in relation to geographical
distance. The OTU0.03 Sørensen similarity index (y-axis) of subsurface sites
is shown in relationship to the geographical distance between the two sites
used to calculate the Sørensen index (x-axis). The V6 data used in this study
is displayed as both the Sørensen indices of the total subsurface OTU0.03
dataset (V6 Data, red circle) and a rarefied OTU0.03 Sørensen Index (V6
Data*, blue square). The rarefied OTU0.03 Sørensen index was calculated
by averaging the result of 100 iterations of subsampling the OTU0.03
community data table to 85% of the smallest sample. A third set of
OTU0.03 Sørensen similarity indices and distances (Previous Data, green
triangle) was calculated from previous South African subsurface studies
(Takai et al., 2001; Moser et al., 2003, 2005; Kieft et al., 2005; Gihring et al.,
2006; Lin et al., 2006a,b; Borgonie et al., 2011; Chehoud, 2011).
Rheinheimera-related sequences in the subsurface V6 datasets and
the fact that it is a mesophilic aerobic heterotroph, it is unlikely
that Rheinheimera plays an important role in subsurface ecol-
ogy. Instead, Rheinheimera is likely a product of either mining
contamination or preserved extracellular DNA in the subsurface.
Rheinheimera has been identified as a potential mining con-
taminant as it was found in the service water of Evander mine
(Davidson et al., 2011). Although no efforts have been made to
identify extracellular DNA in the South African subsurface, the
preservation of extracellular DNA in marine sediments has been
well reported (Danovaro et al., 2005; Coolen and Overmann,
2007; Corinaldesi et al., 2008, 2011) and suggested to occur due
to the adsorption of DNase onto sediment particles (Demanèche
et al., 2001) as well as the adsorption of extracellular DNA onto
mineral and organic particles under anoxic conditions (Coolen
and Overmann, 2007). If similar processes are occurring in the
terrestrial subsurface fracture water, then it will be difficult to elu-
cidate the authenticity of low abundance genera like Rheinheimera
based on V6 amplicon studies.
Although not identified in the thermal springs, a member
of the shared subsurface community that is worth mentioning
is the sulfate reducing bacterium Ca. Desulforudis. This firmi-
cute was found within all subsurface sites sampled and appears
to be an important member of the subsurface community. In
2008, Ca. Desulforudis was identified as the sole member of a
subsurface fracture community (Chivian et al., 2008) and, since
then, Ca. Desulforudis has been identified in other South African
subsurface studies (e.g., Davidson et al., 2011). Additionally,
close relatives of Ca. Desulforudis have also been identified at
other subsurface sites (Itävaara et al., 2011; Suzuki et al., 2013;
Tiago and Veríssimo, 2013). Interestingly, despite the slight vari-
ations in the partial 16S rRNA gene sequences reported for Ca.
Desulforudis found in geographically dispersed fractures of the
South African subsurface (Gihring et al., 2006; Chivian et al.,
2008; Davidson et al., 2011), these sequences yield only one
oligotype of Ca. Desulforudis V6. The variation in 16S rRNA
gene of South African Ca. Desulforudis was found largely within
the V3-5 hypervariable regions, not in the V6. Such conserva-
tion of the V6 is uncommon; other bacterial species, such as
those relating to Dehalogenimonas (Figure 4C), occur as a vari-
ety of strains and oligotypes. It is unclear why the V6 region
of Ca. Desulforudis is well conserved while the V3-5 is not.
However, conservation of the Ca. Desulforudis genome has been
reported previously, as only 32 single nucleotide polymorphisms
were identified in the Ca. Desulforudis metagenome (Chivian
et al., 2008). With such conservation of Ca. Desulforudis’s 16S
rRNA gene in the South African subsurface, it will be inter-
esting to determine how conserved the whole genomes of
Ca. Desulforudis are across sites in the subsurface of South
Africa.
INCREASED OCCURRENCE OF RARE GENERA IN THE SUBSURFACE
In the subsurface, the identification of low abundance genera like
Rheinheimera has increased the alpha diversity beyond what had
been reported previously. A similar increase in alpha diversity
with V6 sequencing was reported by Sogin et al. (2006) and was
attributed to the successful observation of low-abundance organ-
isms that comprise the “rare biosphere.” However, the authentic-
ity of this “rare biosphere” has been debated as the propagation
of sequencing error may have greatly increased the apparent
diversity (Reeder and Knight, 2009). In the case of the sub-
surface samples reported here, sequencing error has already
been accounted for through the use of the 100% overlap filter.
However, as exhibited by the oligotyping of Ca. Desulforudis-
related sequences, there is a large amount of noise surround-
ing “authentic” V6 sequences that is most likely derived from
PCR error (Eren et al., 2013b). This PCR noise is so large that
the single-linkage preclustering and subsequent average link-
age clustering of pairwise aligned sequences (SLP-PWAL) strat-
egy proposed by Huse et al. (2010) did not effectively reduce
the number of OTUs. Based on these results, it is conceivable
that other artificial sequences may have been generated during
PCR and, falsely, increased the alpha diversity of the subsurface
sites.
DISPERSION OF SUBSURFACE POPULATIONS
Aside from identifying a large number of rare sequences, we
also observe over 200 ubiquitous subsurface genera. This degree
of overlap in South African subsurface communities has not
been previously observed. To illustrate this, we compared the
OTU0.03 Sørensen similarity index for all pairs of datasets gen-
erated in the South African subsurface and compared them with
the OTU0.03 Sørensen indices of this study (Figure 6). When
these Sørensen similarity indices were plotted against the dis-
tance between the pair of sites being compared, our V6 dataset
maintains a steady Sørensen similarity index (0.59–0.69) across
Frontiers in Microbiology | Extreme Microbiology December 2014 | Volume 5 | Article 679 | 12
Magnabosco et al. Subsurface and thermal water diversity
geographical distance while the historical data shows a decay
in Sørensen similarity index values with distance (Chehoud,
2011). Accepting that the level of similarity as defined by our
OTU0.03-based Sørensen similarity indices (0.59–0.69) is not an
artifact of methodology, then the lack of an obvious distance-
decay relationship across hundreds of kilometers (and kilometers
vertically) is challenging to explain.
Further complicating, is the fact that the ubiquitous subsur-
face genera, individually, represent a very small proportion of the
planktonic community and would not be expected to travel far.
In a field transport experiment performed using bacterial strains
selected for their adhesion deficiency, the concentration of the
bacteria in the water diminished by an order of magnitude across
a distance of 7 m (Mailloux, 2003). It is difficult to imagine how
a minority population immersed in fracture water at low concen-
trations (∼10 cells/mL) could maintain that concentration over
a 500 km distance. Even more challenging is the fact that the iso-
topic compositions of the fracture water from Dr5IPC, TT109 and
NO14 are distinct from those of Be326, MM5 and FI88 (Lau et al.,
2014) indicating that the fracture waters have not mixed with each
other. In order for the same taxon to be present in isotopically dis-
tinct fracture water, it would have to be motile and moving more
rapidly than the groundwater flow velocities. The high proportion
of shared genera, therefore, implies that shared microorganisms
have to be capable of high dispersal through a wide range of
subsurface environments. Alternatively, should these ubiquitous
subsurface genera of low abundance represent the sessile commu-
nity that were sloughed off the rock surface by the water current
during sampling, the sessile communities are highly homogenous
in the subsurface.
Although many of the organisms are shared across subsur-
face sites, weighted Unifrac significance tests, which take into
account the relative abundance of individual phylotypes, showed
that all sites are significantly different from one another. This is
consistent with the subsurface microbial communities exploit-
ing niches and forming spatially distinctive communities similar
to those observed in thermal springs. These changes in the rela-
tive abundance of various microorganisms are likely to be tied to
the differences in geochemistry or geographic distance. Fuhrman
and Steele (2008) and Brazelton et al. (2013) have both reported
on the succession of microbes within changing environments
through the community sequencing of a time series dataset.
As in Brazelton et al. (2013), a pair-wise Pearson correlation
analysis between observed subsurface phyla and environmen-
tal factors was performed. Although we did not identify any
significant correlations between pairwise-comparisons of individ-
ual phyla and individual environmental parameters, a Euclidean
distance matrix constructed from the scaled values of surface
elevation, pH, TDS and the concentration of O2, Ca+, DIC,
CH4, and Cl− was highly correlated (R2 = 0.83) to the subsur-
face Morisita dissimilarity matrix reported in Figure 5D. The
geographical distance matrix did not correlate as well with the
subsurface Morisita dissimilarity matrix (R2 = 0.12). Notably,
the Dr5IPC and TT109 microbial communities, separated by
4 km, are more similar to each other (MDI: 0.15) than others
yet the microbial communities of NO14 and MM519540, sepa-
rated by 330 km, are the most similar pair of sites in subsurface
dataset (MDI: 0.04). A similar result is observed in the Limpopo
thermal springs where the geographical distance matrix was
even less correlated to the Morisita dissimilarity matrix (R2 =
0.03). These results suggest that geochemistry, rather distance,
is the most important factor in shaping a subsurface microbial
community.
COMMENTS ON EXPERIMENTAL DESIGN
As our results are entirely based on the analysis of high-
throughput sequence data, there are several technical variables
that should not be dismissed when evaluating whether or not
thermal springs should be used as windows to the subsurface.
Firstly, it has been well reported that different primer sets and
sequencing technologies result in different taxonomic profiles
(Liu et al., 2008; Petrosino et al., 2009; Kumar et al., 2011) and,
unfortunately, due to the difficulty in coordinating research in
these exotic locations, the same primers and sequencing plat-
form for thermal spring and subsurface datasets were not applied.
Additionally, archaea were not included in this current study and,
although we have no reason to expect that the majority of the
overlap between thermal spring and subsurface communities is
within this domain, it is a possibility that we cannot exclude.
Furthermore, the volume filtered from the thermal spring (2L)
is 3 orders of magnitude less than that filtered from the subsur-
face sites, 2,850–223,118 L (Table 1) and the pore sizes of the
filters were different. Although the spatial beta diversity of the
subsurface has not been well characterized, such a large volume
filtration can be assumed to minimize the local effects that may be
reflected in the thermal spring dataset. This community “homog-
enization” may explain why there are higher levels of similarity
between subsurface sites when compared to the thermal spring
datasets.
In addition to the increased volume of sample, subsurface
datasets contained over 14,000 reads per site, whereas thermal
spring datasets had, at most, 794 reads per site. The increase in
number of reads collected corresponds to higher percentage of
observed genera relative to the expected number of genera to be
discovered (based on Chao1 estimates). It is important to note
that when using the Sørensen similarity index as a measure of
similarity between sites, sequencing depth is very important. In
this study, we generated over 1,000 times more reads than pre-
viously collected in the subsurface. As a result of this increased
sequencing, we observed higher Sørensen indices than previously
reported (Gihring et al., 2006; Chehoud, 2011) (Figure 6). These
results suggest that there is a much greater similarity among
South African subsurface communities than previously consid-
ered (Section Dispersion of Subsurface Populations). Under sam-
pling is likely to have contributed to variability among sites as,
prior to this study, the subsurface 16S rRNA gene studies obtained
sequences through the generation of a clonal library followed by a
selection of clones for downstream Sanger sequencing. MacLean
et al. (2007) performed a diversity study on an anaerobic biofilm
collected from a South African mine, Evander using, in parallel,
cloning and a high throughput PhyloChip. The latter identified
over 25 times more species (1,596) than what was observed in the
clone library and over 15 times more than the derived Chao1 esti-
mate. With this large number of observed species (far exceeding
www.frontiersin.org December 2014 | Volume 5 | Article 679 | 13
Magnabosco et al. Subsurface and thermal water diversity
the Chao1 estimate), it is unlikely that any of the clone library’s
singleton OTUs would be observed if a replicate was performed.
Therefore, it is unsurprising that with an increased sequencing
depth we observe a higher percentage of shared taxa between the
subsurface communities.
Similar sampling effects may have contributed to the low lev-
els of similarity between the thermal springs sampled (Figure 5).
All thermal spring samples were dominated by one genus and
contained a high percentage of singleton genera (Supplement
Figure 9). Using the Chao1 as an estimate of the actual num-
ber genera at each spring, we find that the datasets of all springs
are between 47 and 68% complete (Table 3). As shared taxa are
likely to persist in the low abundance taxa, an increase in sequenc-
ing depth may be needed to reveal the true degree of relatedness
between sites.
Although these caveats in experimental design may amplify the
differences between observed thermal spring and subsurface com-
munities, it is important to note that in a study of Death Valley
springs and their groundwater source, 21,794 partial 16S rRNA
sequences were generated through pyrotagging and showed abso-
lutely no overlap of the archaeal and bacterial communities in
deep groundwater and surficial springs (Thomas et al., 2013). The
lack of consensus between springs and the water that feeds them,
as reported by Thomas et al. (2013) and this study highlight the
fact that we do not fully understand how microbial communities
develop in the transition between surface spring and subsurface
waters.
CONCLUSIONS
The lack of overlap in the microbial communities observed
between the Limpopo thermal springs and South African subsur-
face sites, despite their physical-chemical similarities, suggest that
thermal springs arising from gravity-driven meteoric water flow
may not provide the clearest windows to the terrestrial subsurface.
The geographic distance between the thermal springs and the
subsurface sites and the fact that four of the springs occur within
the Karoo Supergroup, where no subsurface samples have been
studied, may account for this lack of sequence overlap. However,
despite a geographic separation of up to 500 km and a vertical
distribution of 1.0 to 3.1 km, the subsurface sites sampled in
this study all shared 220 genera and 1,410 V6 sequences. Based
on the ubiquity of this core subsurface set of microorganisms,
we would expect that the subsurface communities surrounding
the Limpopo thermal springs would also contain several of these
pervasive subsurface genera.
The differences in the geographical location of the sam-
pling sites, the region of the 16S rRNA gene, and sequencing
depth generated from these two environments may have played
a role in minimal overlap observed between thermal spring
and subsurface communities. Future work should be performed
to confirm or reject the low similarity through parallel (same
region, same number of reads, replicates) amplicon studies in
the subsurface and thermal springs. By sequencing deeper, more
shared organisms are likely to be illuminated. To determine
the extent of microbial mixing between rising thermal spring
water and local descending meteoric water, these investigations
should be combined with intensive geochemical and isotopic
measurements of the thermal springs. Wherever possible, deep
wells and mines located in thermal spring regions should be
studied in parallel. Only by doing this will we be able to decid-
edly confirm whether or not thermal springs and the microbial
communities they contain provide portals into the subsurface
biosphere.
ACKNOWLEDGMENTS
For this study we would like to thank Gold Fields Ltd., Sibanye
Gold Ltd., Harmony Gold Co. Mining Ltd., Petra Diamonds
and AngloGold Ashanti Ltd., South Africa and the management
and staff of Beatrix, Driefontein, Masimong, Finsch, Zondereinde
platinum mine and Tau Tona mines for providing access and
assistance during sampling of their subsurface fractures. We give
credits to S. Maphanga of Beatrix gold mine, H. van Niekerk
of Driefontein gold mine, S. Sparks of Fincsh diamond mine,
O. Muthelo, L. Joubert and J. Ackermann of Masimong gold
mine, and F. Vermeulen, M. Pienaar and A. Munro of Tau Tona
gold mine. We thank B. Pfeiffer, C. Simon, M. Lindsay, L. Li,
K. Wilkie, D. Simkus, L. Snyder, J.-G. Vermeulen, A. M. Meyer,
M. Maleke, T. Tlalajoe, V. Mescheryakov, and S. Hendrickson for
their assistance in the collection, preservation and field analyses
the fracture water samples. Subsurface research was funded by the
National Geographic Society and National Science Foundation
(NSF). NSF funding was provided to Thomas L. Kieft (EAR-
0948335), Tullis C. Onstott (EAR-0948659), and C. Magnabosco
(DGE-1148900). Any opinion, findings, and conclusions or rec-
ommendations expressed in this material are those of the authors
and do not necessarily reflect the views of the National Science
Foundation. V6 sequencing was funded by the Deep Carbon
Observatory’s Census of Deep Life supported by the Alfred P.
Sloan Foundation. Sequencing was performed at the Marine
Biological Laboratory (MBL, Woods Hole, MA, USA) and we
thank the assistance of M. Sogin, S. Huse, J. Vineis, A. Voorhis,
A. M. Eren, S. Grim, and H. Morrison of MBL. Thermal spring
research was supported through a grant from Water Research
Commission (WRC, SA, Project K5/1959/1). The authors thank
Inqaba Biotechnology and Agriculture Research Centre (ARC) for
their assistance with the analysis of the samples. Dr I. Rampedi,
Mr E. Tshibalo and the rest of the Hot Water Spring (HWS) team
members are acknowledged for their involvement and support
during field trips.
SUPPLEMENTARY MATERIAL
The Supplementary Material for this article can be found
online at: http://www.frontiersin.org/journal/10.3389/fmicb.
2014.00679/abstract. Sequences for the subsurface study
have been made available on http://www.ncbi.nlm.nih.gov/,
Bio Project ID PRJNA263371. The Limpopo thermal spring
sequences are included in the attached .zip file.
REFERENCES
Barnes, I., Lamarche, V. C., and Himmelberg, G. (1967). Geochemical evi-
dence of present-day serpentinization. Science 156, 830–832. doi: 10.1126/sci-
ence.156.3776.830
Barnes, I., O’Neil, J., and Trescases, J. (1978). Present day serpentinization in New
Caledonia, Oman and Yugoslavia. Geochim. Cosmochim. Acta 42, 144–145.
Frontiers in Microbiology | Extreme Microbiology December 2014 | Volume 5 | Article 679 | 14
Magnabosco et al. Subsurface and thermal water diversity
Borgonie, G., García-Moyano, A., Litthauer, D., Bert, W., Bester, A., van Heerden,
E., et al. (2011). Nematoda from the terrestrial deep subsurface of South Africa.
Nature 474, 79–82. doi: 10.1038/nature09974
Brazelton, W. J., Morrill, P. L., Szponar, N., and Schrenk, M. O. (2013).
Bacterial communities associated with subsurface geochemical processes in
continental serpentinite springs. Appl. Environ. Microbiol. 79, 3906–3916. doi:
10.1128/AEM.00330-13
Brazelton, W. J., Nelson, B., and Schrenk, M. O. (2012). Metagenomic evi-
dence for h(2) oxidation and h(2) production by serpentinite-hosted subsur-
face microbial communities. Front. Microbiol. 2:268. doi: 10.3389/fmicb.2011.
00268
Brettar, I., Christen, R., and Höfle, M. G. (2006). Rheinheimera perlucida sp.
nov., a marine bacterium of the Gammaproteobacteria isolated from surface
water of the central Baltic Sea. Int. J. Syst. Evol. Microbiol. 56, 2177–2183. doi:
10.1099/ijs.0.64172-0
Brock, T. D., and Brock, M. L. (1969). Recovery of a hot spring community from a
catastrophe. J. Phycol. 5, 75–77. doi: 10.1111/j.1529-8817.1969.tb02580.x
Chao, A. (1984). Nonparametric estimation of the number of classes in a popula-
tion. Scan. J. Statist. 11, 265–270.
Chehoud, C. (2011). Exploring Microbial Diversity in the Deep Subsurface of
the Witwatersrand Basin, South Africa (Undergraduate Thesis). Retrieved
from DataSpace at Princeton University, Princeton, NJ. Available online at:
http://arks.princeton.edu/ark:/88435/dsp01mp48sf69r
Chivian, D., Brodie, E. L., Alm, E. J., Culley, D. E., Dehal, P. S., DeSantis, T. Z., et al.
(2008). Environmental genomics reveals a single-species ecosystem deep within
Earth. Science 322, 275–278. doi: 10.1126/science.1155495
Cole, J. R., Wang, Q., Fish, J. A., Chai, B., McGarrell, D. M., Sun, Y., et al. (2014).
Ribosomal database project: data and tools for high throughput rRNA analysis.
Nucleic Acids Res. 42, 1–10. doi: 10.1093/nar/gkt1244
Coolen, M. J. L., and Overmann, J. (2007). 217 000-year-old DNA sequences of
green sulfur bacteria in Mediterranean sapropels and their implications for the
reconstruction of the paleoenvironment. Environ. Microbiol. 9, 238–249. doi:
10.1111/j.1462-2920.2006.01134.x
Corinaldesi, C., Barucca, M., Luna, G. M., and Dell’Anno, A. (2011). Preservation,
origin and genetic imprint of extracellular DNA in permanently anoxic deep-sea
sediments. Mol. Ecol. 20, 642–654. doi: 10.1111/j.1365-294X.2010.04958.x
Corinaldesi, C., Beolchini, F., and Dell’Anno, A. (2008). Damage and degrada-
tion rates of extracellular DNA in marine sediments: implications for the
preservation of gene sequences. Mol. Ecol. 17, 3939–3951. doi: 10.1111/j.1365-
294X.2008.03880.x
Dabney, A., Storey, J. D., and Warnes, G. R. (2010). qvalue: Q-value estimation for
false discovery rate control. R package version 1.24.20.
Danovaro, R., Corinaldesi, C., Dell’Anno, A., Fabiano, M., and Corselli, C. (2005).
Viruses, prokaryotes and DNA in the sediments of a deep-hypersaline anoxic
basin (DHAB) of the Mediterranean Sea. Environ. Microbiol. 7, 586–592. doi:
10.1111/j.1462-2920.2005.00727.x
Davidson, M. M., Silver, B. J., Onstott, T. C., Moser, D. P., Gihring, T. M., Pratt,
L. M., et al. (2011). Capture of planktonic microbial diversity in fractures
by long-term monitoring of flowing boreholes, Evander Basin, South Africa.
Geomicrobiol. J. 28, 275–300. doi: 10.1080/01490451.2010.499928
Demanèche, S., Jocteur-Monrozier, L., Quiquampoix, H., and Simonet, P. (2001).
Evaluation of biological and physical protection against nuclease degrada-
tion of clay-bound plasmid DNA. Appl. Environ. Microbiol. 67, 293–299. doi:
10.1128/AEM.67.1.293-299.2001
Deming, J. W., and Baross, J. A. (1993). Deep-sea smokers: windows to a subsur-
face biosphere? Geochim. Cosmochim. Acta 57, 3219–3230. doi: 10.1016/0016-
7037(93)90535-5
DeSantis, T. Z., Brodie, E. L., Moberg, J. P., Zubieta, I. X., Piceno, Y. M.,
and Andersen, G. L. (2007). High-density universal 16S rRNA microar-
ray analysis reveals broader diversity than typical clone library when sam-
pling the environment. Microb. Ecol. 53, 371–383. doi: 10.1007/s00248-006-
9134-9
DeSantis, T. Z., Hugenholtz, P., Larsen, N., Rojas, M., Brodie, E. L., Keller, K.,
et al. (2006). Greengenes, a chimera-checked 16S rRNA gene database and
workbench compatible with ARB. Appl. Environ. Microbiol. 72, 5069–5072. doi:
10.1128/AEM.03006-05
Dhansay, T., de Wit, M., and Patt, A. (2014). An evaluation for harnessing low-
enthalpy geothermal energy in the Limpopo Province, South Africa. S. Afr. J.
Sci. 110, 1–10. doi: 10.1590/sajs.2014/20130282
Dowd, S. E., Wolcott, R. D., Sun, Y., McKeehan, T., Smith, E., and
Rhoads, D. (2008). Polymicrobial nature of chronic diabetic foot ulcer
biofilm infections determined using bacterial tag encoded FLX amplicon
pyrosequencing (bTEFAP). PLoS ONE 3:e3326. doi: 10.1371/journal.pone.
0003326
Edgar, R. C. (2010). Search and clustering orders of magnitude faster than BLAST.
Bioinformatics 26, 2460–2461. doi: 10.1093/bioinformatics/btq461
Edgar, R. C., Haas, B. J., Clemente, J. C., Quince, C., and Knight, R. (2011).
UCHIME improves sensitivity and speed of chimera detection. Bioinformatics
27, 2194–2200. doi: 10.1093/bioinformatics/btr381
Eren, A. M., Maignien, L., Sul, W. J., Murphy, L. G., Grim, S. L., Morrison, H. G.,
et al. (2013a). Oligotyping: differentiating between closely related microbial taxa
using 16S rRNA gene data. Methods Ecol. Evol. 4, 1111–1119. doi: 10.1111/2041-
210X.12114
Eren, A. M., Vineis, J. H., Morrison, H. G., and Sogin, M. L. (2013b). A filter-
ing method to generate high quality short reads using illumina paired-end
technology. PLoS ONE 8:e66643. doi: 10.1371/journal.pone.0066643
Ferris, M. J., Nold, S. C., Revsbech, N. P., and Ward, D. M. (1997). Population struc-
ture and physiological changes within a hot spring microbial mat community
following disturbance. Appl. Environ. Microbiol. 63, 1367–1374.
Fouke, B. W., Bonheyo, G. T., Sanzenbacher, B., and Frias-Lopez, J. (2003).
Partitioning of bacterial communities between travertine depositional facies at
Mammoth Hot Springs, Yellowstone National Park, U.S.A. Can. J. Earth Sci. 40,
1531–1548. doi: 10.1139/e03-067
Fuhrman, J., and Steele, J. (2008). Community structure of marine bacterioplank-
ton: patterns, networks, and relationships to function. Aquat. Microb. Ecol. 53,
69–81. doi: 10.3354/ame01222
Gihring, T. M., Moser, D. P., Lin, L.-H., Davidson, M., Onstott, T. C., Morgan,
L., et al. (2006). The distribution of microbial taxa in the subsurface water
of the kalahari shield, South Africa. Geomicrobiol. J. 23, 415–430. doi:
10.1080/01490450600875696
Grasby, S. E., and Hutcheon, I. (2001). Controls on the distribution of thermal
springs in the southern Canadian Cordillera. Can. J. Earth Sci. 38, 427–440. doi:
10.1139/e00-091
Hosgörmez, H. (2007). Origin of the natural gas seep of Çirali (Chimera),
Turkey: site of the first Olympic fire. J. Asian Earth Sci. 30, 131–141. doi:
10.1016/j.jseaes.2006.08.002
Huse, S. M., Dethlefsen, L., Huber, J. A., Welch, D. M., Relman, D. A., and
Sogin, M. L. (2008). Exploring microbial diversity and taxonomy using SSU
rRNA hypervariable tag sequencing. PLoS Genet. 4:e1000255. doi: 10.1371/jour-
nal.pgen.1000255
Huse, S. M., Welch, D. M., Morrison, H. G., and Sogin, M. L. (2010). Ironing out
the wrinkles in the rare biosphere through improved OTU clustering. Environ.
Microbiol. 12, 1889–1898. doi: 10.1111/j.1462-2920.2010.02193.x
Itävaara, M., Nyyssönen, M., Kapanen, A., Nousiainen, A., Ahonen, L., and
Kukkonen, I. (2011). Characterization of bacterial diversity to a depth of 1500 m
in the Outokumpu deep borehole, Fennoscandian Shield. FEMS Microbiol. Ecol.
77, 295–309. doi: 10.1111/j.1574-6941.2011.01111.x
Jonker, C. Z., van Ginkel, C., and Olivier, J. (2013). Association between physi-
cal and geochemical characteristics of thermal springs and algal diversity in
Limpopo Province, South Africa. Water SA. 39, 95–104. doi: 10.4313/wsa.
v39i1.10
Kieft, T. L., McCuddy, S. M., Onstott, T. C., Davidson, M., Lin, L.-H., Mislowack, B.,
et al. (2005). Geochemically Generated, Energy-Rich Substrates and Indigenous
Microorganisms in Deep, Ancient Groundwater. Geomicrobiol. J. 22, 325–335.
doi: 10.1080/01490450500184876
Kumar, P. S., Brooker, M. R., Dowd, S. E., and Camerlengo, T. (2011). Target region
selection is a critical determinant of community fingerprints generated by 16S
Pyrosequencing. PLoS ONE 6:e20956. doi: 10.1371/journal.pone.0020956
Langmead, B., Trapnell, C., Pop, M., and Salzberg, S. L. (2009). Ultrafast and
memory-efficient alignment of short DNA sequences to the human genome.
Genome Biol. 10:R25. doi: 10.1186/gb-2009-10-3-r25
Lau, M. C. Y., Cameron, C., Magnabosco, C., Brown, C. T., Schilkey, F., Grim, S. L.,
et al. (2014). Phylogeny and phylogeography of functional genes shared among
seven terrestrial subsurface metagenomes reveal N-cycling and microbial
evolutionary relationships. Front. Microbiol. 5:531. doi: 10.3389/fmicb.2014.
00531
Lin, L.-H., Hall, J., Onstott, T. C., Gihring, T., Lollar, B. S., Boice, E., et al.
(2006a). Planktonic microbial communities associated with fracture-derived
www.frontiersin.org December 2014 | Volume 5 | Article 679 | 15
Magnabosco et al. Subsurface and thermal water diversity
groundwater in a deep gold mine of South Africa. Geomicrobiol. J. 23, 475–497.
doi: 10.1080/01490450600875829
Lin, L.-H., Wang, P.-L., Rumble, D., Lippmann-Pipke, J., Boice, E., Pratt, L. M.,
et al. (2006b). Long-term sustainability of a high-energy, low-diversity crustal
biome. Science 314, 479–482. doi: 10.1126/science.1127376
Liu, Z., Desantis, T. Z., Andersen, G. L., and Knight, R. (2008). Accurate
taxonomy assignments from 16S rRNA sequences produced by highly
parallel pyrosequencers. Nucleic Acids Res. 36:e120. doi: 10.1093/nar/
gkn491
Lollar, B. S., Lacrampe-Couloume, G., Voglesonger, K., Onstott, T. C., Pratt, L.
M., and Slater, G. F. (2008). Isotopic signatures of CH4 and higher hydro-
carbon gases from Precambrian Shield sites: a model for abiogenic poly-
merization of hydrocarbons. Geochim. Cosmochim. Acta 72, 4778–4795. doi:
10.1016/j.gca.2008.07.004
Lozupone, C., and Knight, R. (2005). UniFrac: a new phylogenetic method for com-
paring microbial communities. Appl. Environ. Microbiol. 71, 8228–8235. doi:
10.1128/AEM.71.12.8228-8235.2005
MacLean, L. C. W., Pray, T. J., Onstott, T. C., Brodie, E. L., Hazen, T. C., and
Southam, G. (2007). Mineralogical, chemical and biological characterization of
an anaerobic biofilm collected from a borehole in a deep gold mine in South
Africa. Geomicrobiol. J. 24, 491–504. doi: 10.1080/01490450701572416
Mailloux, B. J. (2003). The role of physical, chemical, and microbial heterogene-
ity on the field-scale transport and attachment of bacteria. Water Resour. Res.
39:1142. doi: 10.1029/2002WR001591
Marques, J. M., Carreira, P. M., Carvalho, M. R., Matias, M. J., Goff, F.
E., Basto, M. J., et al. (2008). Origins of high pH mineral waters from
ultramafic rocks, Central Portugal. Appl. Geochem. 23, 3278–3289. doi:
10.1016/j.apgeochem.2008.06.029
Meyer-Dombard, D. R., Swingley, W., Raymond, J., Havig, J., Shock, E. L., and
Summons, R. E. (2011). Hydrothermal ecotones and streamer biofilm commu-
nities in the Lower Geyser Basin, Yellowstone National Park. Environ. Microbiol.
13, 2216–2231. doi: 10.1111/j.1462-2920.2011.02476.x
Morisita, M. (1959). Measuring of Interspecific association and similarity between
communities. Mem. Fac. Sci. Kyushu Univ. Ser. E 3, 65–80.
Morrill, P. L., Kuenen, J. G., Johnson, O. J., Suzuki, S., Rietze, A., Sessions, A. L.,
et al. (2013). Geochemistry and geobiology of a present-day serpentinization
site in California: the Cedars. Geochim. Cosmochim. Acta 109, 222–240. doi:
10.1016/j.gca.2013.01.043
Moser, D. P., Gihring, T. M., Brockman, F. J., Fredrickson, J. K., Balkwill, D.
L., Dollhopf, M. E., et al. (2005). Desulfotomaculum and Methanobacterium
spp. dominate a 4- to 5-kilometer-deep fault. Appl. Environ. Microbiol. 71,
8773–8783. doi: 10.1128/AEM.71.12.8773-8783.2005
Moser, D. P., Onstott, T. C., Fredrickson, J. K., Brockman, F. J., Balkwill, D. L.,
Drake, G. R., et al. (2003). Temporal shifts in the geochemistry and micro-
bial community structure of an ultradeep mine borehole following isolation.
Geomicrobiol. J. 20, 517–548. doi: 10.1080/713851170
Oksanen, J., Blanchet, F. G., Kindt, R., Legendre, P., Minchin, P. R., O’Hara, R. B.,
et al. (2013). Package “vegan.” R Packag. ver. 2.0–8, 254.
Olivier, J., van Niekerk, H. J., and van der Walt, I. J. (2008). Physical and chemical
characteristics of thermal springs in the Waterberg area in Limpopo Province,
South Africa. Water SA 34, 163–174.
Olivier, J., Venter, J. S., and Jonker, C. Z. (2011). Thermal and chemical character-
istics of hot water springs in the northern part of the Limpopo Province, South
Africa. Water SA 37, 427–436.
Onstott, T. C., Lin, L. H., Davidson, M., Mislowack, B., Borcsik, M., Hall, J., et al.
(2006). The origin and age of biogeochemical trends in deep fracture water
of the Witwatersrand Basin, South Africa. Geomicrobiol. J. 23, 369–414. doi:
10.1080/01490450600875688
Onstott, T. C., Moser, D. P., Pfiffner, S. M., Fredrickson, J. K., Brockman, F. J.,
Phelps, T. J., et al. (2003). Indigenous and contaminant microbes in ultra-
deep mines. Environ. Microbiol. 5, 1168–1191. doi: 10.1046/j.1462-2920.2003.
00512.x
Petrosino, J. F., Highlander, S., Luna, R. A., Gibbs, R. A., and Versalovic, J. (2009).
Metagenomic pyrosequencing and microbial identification. Clin. Chem. 55,
856–866. doi: 10.1373/clinchem.2008.107565
Pielou, E. C. (1967). The measurement of diversity in different types of biological
collections. J. Theor. Biol. 15, 177. doi: 10.1016/0022-5193(67)90048-3
Press, F., and Siever, R. (1986). Earth. 4th Edn. New York, NY: WH Freeman
and Co.
Price, M. N., Dehal, P. S., and Arkin, A. P. (2009). Fasttree: computing large mini-
mum evolution trees with profiles instead of a distance matrix. Mol. Biol. Evol.
26, 1641–1650. doi: 10.1093/molbev/msp077
Reeder, J., and Knight, R. (2009). The “rare biosphere”: a reality check. Nat. Methods
6, 636–637. doi: 10.1038/nmeth0909-636
Rizopoulos, D. (2006). ltm: an R package for latent variable modeling and item
response theory analyses. J. Stat. Softw. 17, 1–25.
Schloss, P. D., Westcott, S. L., Ryabin, T., Hall, J. R., Hartmann, M., Hollister,
E. B., et al. (2009). Introducing mothur: open-source, platform-independent,
community-supported software for describing and comparing microbial
communities. Appl. Environ. Microbiol. 75, 7537–7541. doi: 10.1128/AEM.
01541-09
Schrenk, M. O., Huber, J. A., and Edwards, K. J. (2010). Microbial provinces in
the subseafloor. Ann. Rev. Mar. Sci. 2, 279–304. doi: 10.1146/annurev-marine-
120308-081000
Sogin, M. L., Morrison, H. G., Huber, J. A., Mark Welch, D., Huse, S. M., Neal,
P. R., et al. (2006). Microbial diversity in the deep sea and the underex-
plored “rare biosphere.” Proc. Natl. Acad. Sci. U.S.A. 103, 12115–12120. doi:
10.1073/pnas.0605127103
Sorensen, T. (1948). A method of establishing groups of equal amplitude in plant
sociology based on similarity of species content. K. Danske Vidensk. Selsk. 5, 4–7.
Sundquist, A., Bigdeli, S., Jalili, R., Druzin, M. L., Waller, S., Pullen, K. M., et al.
(2007). Bacterial flora-typing with targeted, chip-based Pyrosequencing. BMC
Microbiol. 7:108. doi: 10.1186/1471-2180-7-108
Suzuki, S., Ishii, S., Wu, A., Cheung, A., Tenney, A., Wanger, G., et al. (2013).
Microbial diversity in The Cedars, an ultrabasic, ultrareducing, and low salinity
serpentinizing ecosystem. Proc. Natl. Acad. Sci. U.S.A. 110, 15336–15341. doi:
10.1073/pnas.1302426110
Szponar, N., Brazelton, W. J., Schrenk, M. O., Bower, D. M., Steele, A., and
Morrill, P. L. (2013). Geochemistry of a continental site of serpentinization, the
tablelands ophiolite, gros morne national park: a Mars analogue. Icarus 224,
286–296. doi: 10.1016/j.icarus.2012.07.004
Takai, K., Moser, D. P., DeFlaun, M., Onstott, T. C., and Fredrickson, J.
K. (2001). Archaeal diversity in waters from deep South African gold
mines. Appl. Environ. Microbiol. 67, 5750–5760. doi: 10.1128/AEM.67.21.5750-
5760.2001
Tekere, M., Lötter, A., Olivier, J., Jonker, N., and Venter, S. (2011).
Metagenomic analysis of bacterial diversity of Siloam hot water spring,
Limpopo, South Africa. Afr. J. Biotechnol. 10, 18005–18012. doi: 10.5897/
AJB11.899
Tekere, M., Prinsloo, A., Olivier, J., Jonker, N., and Venter, S. (2012). An eval-
uation of the bacterial diversity at Tshipise, Mphephu and Sagole hot water
springs, Limpopo Province, South Africa. Afr. J. Microbiol. Res. 6, 4993–5004.
doi: 10.5897/AJMR12.250
Thomas, J. M., Moser, D. P., Fisher, J. C., Reihle, J., Wheatley, A., Hershey,
R. L., et al. (2013). Using water chemistry, isotopes and microbiology to
evaluate groundwater sources, flow paths and geochemical reactions in the
death valley flow system, USA. Procedia Earth Planet. Sci. 7, 842–845. doi:
10.1016/j.proeps.2013.03.033
Tiago, I., and Veríssimo, A. (2013). Microbial and functional diversity of a subter-
restrial high pH groundwater associated to serpentinization. Environ. Microbiol.
15, 1687–1706. doi: 10.1111/1462-2920.12034
Todd, D. K. (1980). Groundwater Hydrology. 2nd Edn. New York, NY: Wiley.
Wang, Q., Garrity, G. M., Tiedje, J. M., and Cole, J. R. (2007). Naive Bayesian clas-
sifier for rapid assignment of rRNA sequences into the new bacterial taxonomy.
Appl. Environ. Microbiol. 73, 5261–5267. doi: 10.1128/AEM.00062-07
Ward, D. M., Ferris, M. J., Nold, S. C., and Bateson, M. M. (1998). A natural view
of microbial biodiversity within hot spring cyanobacterial mat communities.
Microbiol. Mol. Biol. Rev. 62, 1353–1370.
Whitman, W. B., Coleman, D. C., and Wiebe, W. J. (1998). Prokaryotes:
the unseen majority. Proc. Natl. Acad. Sci. U.S.A. 95, 6578–6583. doi:
10.1073/pnas.95.12.6578
Wolda, H. (1981). Similarity indices, sample size and diversity. Oecologia 50,
296–302. doi: 10.1007/BF00344966
Yoon, J.-H., Bae, S. E., Kang, S.-J., and Oh, T.-K. (2007). Rheinheimera aquimaris
sp. nov., isolated from seawater of the East Sea in Korea. Int. J. Syst. Evol.
Microbiol. 57, 1386–1390. doi: 10.1099/ijs.0.64898-0
Zhang, X., Sun, L., Qiu, F., McLean, R. J. C., Jiang, R., and Song, W.
(2008). Rheinheimera tangshanensis sp. nov., a rice root-associated
Frontiers in Microbiology | Extreme Microbiology December 2014 | Volume 5 | Article 679 | 16
Magnabosco et al. Subsurface and thermal water diversity
bacterium. Int. J. Syst. Evol. Microbiol. 58, 2420–2424. doi: 10.1099/ijs.0.
65605-0
Conflict of Interest Statement: The authors declare that the research was con-
ducted in the absence of any commercial or financial relationships that could be
construed as a potential conflict of interest.
Received: 10 August 2014; accepted: 20 November 2014; published online: 17 December
2014.
Citation: Magnabosco C, Tekere M, Lau MCY, Linage B, Kuloyo O, Erasmus M,
Cason E, van Heerden E, Borgonie G, Kieft TL, Olivier J and Onstott TC (2014)
Comparisons of the composition and biogeographic distribution of the bacterial
communities occupying South African thermal springs with those inhabiting deep
subsurface fracture water. Front. Microbiol. 5:679. doi: 10.3389/fmicb.2014.00679
This article was submitted to Extreme Microbiology, a section of the journal Frontiers
in Microbiology.
Copyright © 2014 Magnabosco, Tekere, Lau, Linage, Kuloyo, Erasmus, Cason,
van Heerden, Borgonie, Kieft, Olivier and Onstott. This is an open-access arti-
cle distributed under the terms of the Creative Commons Attribution License
(CC BY). The use, distribution or reproduction in other forums is permitted, pro-
vided the original author(s) or licensor are credited and that the original pub-
lication in this journal is cited, in accordance with accepted academic practice.
No use, distribution or reproduction is permitted which does not comply with
these terms.
www.frontiersin.org December 2014 | Volume 5 | Article 679 | 17

More Related Content

What's hot

Advancement2 2
Advancement2 2Advancement2 2
Advancement2 2
Robin Shin
 
Using Hydroacoustics to Spatially Quantify Productive Capacity in Freshwater ...
Using Hydroacoustics to Spatially Quantify Productive Capacity in Freshwater ...Using Hydroacoustics to Spatially Quantify Productive Capacity in Freshwater ...
Using Hydroacoustics to Spatially Quantify Productive Capacity in Freshwater ...
rapollom
 
Robinshin
RobinshinRobinshin
Robinshin
Robin Shin
 
Presentation1
Presentation1Presentation1
Presentation1
Robin Shin
 
A Quantitative Study of the Productivity of the Foraminifera in the Sea
A Quantitative Study of the Productivity of the Foraminifera in the SeaA Quantitative Study of the Productivity of the Foraminifera in the Sea
A Quantitative Study of the Productivity of the Foraminifera in the Sea
Nicha Tatsaneeyapan
 
Marine Ecology lab report sample
Marine Ecology lab report sampleMarine Ecology lab report sample
Marine Ecology lab report sampleBenjamin Gibson
 
Diel vertical migration
Diel vertical migrationDiel vertical migration
Diel vertical migration
ilo0lo0
 
Biological Oceanography
Biological OceanographyBiological Oceanography
Biological Oceanography
Hafez Ahmad
 
23 Benthic Methods Freshwater Sci 2013
23 Benthic Methods Freshwater Sci 201323 Benthic Methods Freshwater Sci 2013
23 Benthic Methods Freshwater Sci 2013Jacob Villalobos
 
Interface change of seawater and freshwater on Asam – Asam Watersheds, South ...
Interface change of seawater and freshwater on Asam – Asam Watersheds, South ...Interface change of seawater and freshwater on Asam – Asam Watersheds, South ...
Interface change of seawater and freshwater on Asam – Asam Watersheds, South ...
Innspub Net
 
Evidence for ancient_grand_canyon
Evidence for ancient_grand_canyonEvidence for ancient_grand_canyon
Evidence for ancient_grand_canyonSérgio Sacani
 
Foraminiferal Approach to Palaeoenvironmental Interpretations: Case Study of ...
Foraminiferal Approach to Palaeoenvironmental Interpretations: Case Study of ...Foraminiferal Approach to Palaeoenvironmental Interpretations: Case Study of ...
Foraminiferal Approach to Palaeoenvironmental Interpretations: Case Study of ...
Premier Publishers
 
Study of Zooplankton Diversity of Chhapakaiya Pond Birgunj, Nepal
Study of Zooplankton Diversity of Chhapakaiya Pond Birgunj, NepalStudy of Zooplankton Diversity of Chhapakaiya Pond Birgunj, Nepal
Study of Zooplankton Diversity of Chhapakaiya Pond Birgunj, Nepal
SSR Institute of International Journal of Life Sciences
 
A study on the biodiversity of snake island in South Andaman - JBES
A study on the biodiversity of snake island in South Andaman - JBESA study on the biodiversity of snake island in South Andaman - JBES
A study on the biodiversity of snake island in South Andaman - JBES
Innspub Net
 
Ecological systems
Ecological systemsEcological systems
Ecological systems
Pablo Martin
 
Aquatic ecosystems
Aquatic ecosystemsAquatic ecosystems
Aquatic ecosystems
HMENI
 

What's hot (20)

Advancement2 2
Advancement2 2Advancement2 2
Advancement2 2
 
Using Hydroacoustics to Spatially Quantify Productive Capacity in Freshwater ...
Using Hydroacoustics to Spatially Quantify Productive Capacity in Freshwater ...Using Hydroacoustics to Spatially Quantify Productive Capacity in Freshwater ...
Using Hydroacoustics to Spatially Quantify Productive Capacity in Freshwater ...
 
Robinshin
RobinshinRobinshin
Robinshin
 
temporary ponds
temporary pondstemporary ponds
temporary ponds
 
Presentation1
Presentation1Presentation1
Presentation1
 
A Quantitative Study of the Productivity of the Foraminifera in the Sea
A Quantitative Study of the Productivity of the Foraminifera in the SeaA Quantitative Study of the Productivity of the Foraminifera in the Sea
A Quantitative Study of the Productivity of the Foraminifera in the Sea
 
Marine Ecology lab report sample
Marine Ecology lab report sampleMarine Ecology lab report sample
Marine Ecology lab report sample
 
Diel vertical migration
Diel vertical migrationDiel vertical migration
Diel vertical migration
 
Biological Oceanography
Biological OceanographyBiological Oceanography
Biological Oceanography
 
Kristensen et al_2015.ABSTRACT
Kristensen et al_2015.ABSTRACTKristensen et al_2015.ABSTRACT
Kristensen et al_2015.ABSTRACT
 
23 Benthic Methods Freshwater Sci 2013
23 Benthic Methods Freshwater Sci 201323 Benthic Methods Freshwater Sci 2013
23 Benthic Methods Freshwater Sci 2013
 
Interface change of seawater and freshwater on Asam – Asam Watersheds, South ...
Interface change of seawater and freshwater on Asam – Asam Watersheds, South ...Interface change of seawater and freshwater on Asam – Asam Watersheds, South ...
Interface change of seawater and freshwater on Asam – Asam Watersheds, South ...
 
Evidence for ancient_grand_canyon
Evidence for ancient_grand_canyonEvidence for ancient_grand_canyon
Evidence for ancient_grand_canyon
 
Foraminiferal Approach to Palaeoenvironmental Interpretations: Case Study of ...
Foraminiferal Approach to Palaeoenvironmental Interpretations: Case Study of ...Foraminiferal Approach to Palaeoenvironmental Interpretations: Case Study of ...
Foraminiferal Approach to Palaeoenvironmental Interpretations: Case Study of ...
 
Kenchel
KenchelKenchel
Kenchel
 
Study of Zooplankton Diversity of Chhapakaiya Pond Birgunj, Nepal
Study of Zooplankton Diversity of Chhapakaiya Pond Birgunj, NepalStudy of Zooplankton Diversity of Chhapakaiya Pond Birgunj, Nepal
Study of Zooplankton Diversity of Chhapakaiya Pond Birgunj, Nepal
 
B.28.2357
B.28.2357B.28.2357
B.28.2357
 
A study on the biodiversity of snake island in South Andaman - JBES
A study on the biodiversity of snake island in South Andaman - JBESA study on the biodiversity of snake island in South Andaman - JBES
A study on the biodiversity of snake island in South Andaman - JBES
 
Ecological systems
Ecological systemsEcological systems
Ecological systems
 
Aquatic ecosystems
Aquatic ecosystemsAquatic ecosystems
Aquatic ecosystems
 

Similar to fmicb-05-00679

Diversity of halophilic mycoflora habitat in saltpans of Tuticorin and Marakk...
Diversity of halophilic mycoflora habitat in saltpans of Tuticorin and Marakk...Diversity of halophilic mycoflora habitat in saltpans of Tuticorin and Marakk...
Diversity of halophilic mycoflora habitat in saltpans of Tuticorin and Marakk...
Open Access Research Paper
 
The role of abiotic factors in diurnal vertical distribution of
The role of abiotic factors in diurnal vertical distribution ofThe role of abiotic factors in diurnal vertical distribution of
The role of abiotic factors in diurnal vertical distribution of
Alexander Decker
 
Hyperthermophiles2
Hyperthermophiles2Hyperthermophiles2
Hyperthermophiles2Caylin Close
 
Coastal marine ecosystem scientific paper
Coastal marine ecosystem scientific paper Coastal marine ecosystem scientific paper
Coastal marine ecosystem scientific paper
swissmitchick
 
Aspects of the Geomorphology and Limnology of some molluscinhabited freshwate...
Aspects of the Geomorphology and Limnology of some molluscinhabited freshwate...Aspects of the Geomorphology and Limnology of some molluscinhabited freshwate...
Aspects of the Geomorphology and Limnology of some molluscinhabited freshwate...
iosrjce
 
Required Resources httpswww.cdc.govphlpnewscurrent.htmlh.docx
Required Resources httpswww.cdc.govphlpnewscurrent.htmlh.docxRequired Resources httpswww.cdc.govphlpnewscurrent.htmlh.docx
Required Resources httpswww.cdc.govphlpnewscurrent.htmlh.docx
kellet1
 
2009 assessment effects of cage culture on nitrogen
2009 assessment effects of cage culture on nitrogen2009 assessment effects of cage culture on nitrogen
2009 assessment effects of cage culture on nitrogen
earambulm3
 
Paleoecology_Paleolimnology _ Encyclopedia.com.pdf
Paleoecology_Paleolimnology _ Encyclopedia.com.pdfPaleoecology_Paleolimnology _ Encyclopedia.com.pdf
Paleoecology_Paleolimnology _ Encyclopedia.com.pdf
ArvindKumar904250
 
Micropaleontology in petroleum exploration.pptx
Micropaleontology in petroleum exploration.pptxMicropaleontology in petroleum exploration.pptx
Micropaleontology in petroleum exploration.pptx
AssmaAli1
 
evaluation of water resources in wadi el natrun, western desert, egypt
evaluation of water resources in wadi el natrun, western desert, egyptevaluation of water resources in wadi el natrun, western desert, egypt
evaluation of water resources in wadi el natrun, western desert, egypt
IJEAB
 
The Characteristic Algal Mats and Flora of El-Timsah Lake
The Characteristic Algal Mats and Flora of El-Timsah LakeThe Characteristic Algal Mats and Flora of El-Timsah Lake
The Characteristic Algal Mats and Flora of El-Timsah Lake
the Egyptian Society for Environmental Sciences
 
Dan Bower's Phosphate Thesis
Dan Bower's Phosphate ThesisDan Bower's Phosphate Thesis
Dan Bower's Phosphate ThesisDaniel Bower
 
A330119
A330119A330119
Diversity and abundance of Macrobenthos in a subtropical estuary, Bangladesh
Diversity and abundance of Macrobenthos in a subtropical estuary, BangladeshDiversity and abundance of Macrobenthos in a subtropical estuary, Bangladesh
Diversity and abundance of Macrobenthos in a subtropical estuary, Bangladesh
AbdullaAlAsif1
 
Time of day influences foraging behavior of waterbirds in the Kruger National...
Time of day influences foraging behavior of waterbirds in the Kruger National...Time of day influences foraging behavior of waterbirds in the Kruger National...
Time of day influences foraging behavior of waterbirds in the Kruger National...
Joseph Galaske
 
Once A Super Continent Final Draft
Once A Super Continent Final DraftOnce A Super Continent Final Draft
Once A Super Continent Final DraftJesse Jones
 
Speleothems Ppt
Speleothems PptSpeleothems Ppt
Speleothems Ppt
jmole
 
Mauro Passarella - Doctoral Research Proposal_October 2015
Mauro Passarella - Doctoral Research Proposal_October 2015Mauro Passarella - Doctoral Research Proposal_October 2015
Mauro Passarella - Doctoral Research Proposal_October 2015Mauro Passarella
 

Similar to fmicb-05-00679 (20)

Diversity of halophilic mycoflora habitat in saltpans of Tuticorin and Marakk...
Diversity of halophilic mycoflora habitat in saltpans of Tuticorin and Marakk...Diversity of halophilic mycoflora habitat in saltpans of Tuticorin and Marakk...
Diversity of halophilic mycoflora habitat in saltpans of Tuticorin and Marakk...
 
The role of abiotic factors in diurnal vertical distribution of
The role of abiotic factors in diurnal vertical distribution ofThe role of abiotic factors in diurnal vertical distribution of
The role of abiotic factors in diurnal vertical distribution of
 
Hyperthermophiles2
Hyperthermophiles2Hyperthermophiles2
Hyperthermophiles2
 
Coastal marine ecosystem scientific paper
Coastal marine ecosystem scientific paper Coastal marine ecosystem scientific paper
Coastal marine ecosystem scientific paper
 
Aspects of the Geomorphology and Limnology of some molluscinhabited freshwate...
Aspects of the Geomorphology and Limnology of some molluscinhabited freshwate...Aspects of the Geomorphology and Limnology of some molluscinhabited freshwate...
Aspects of the Geomorphology and Limnology of some molluscinhabited freshwate...
 
Required Resources httpswww.cdc.govphlpnewscurrent.htmlh.docx
Required Resources httpswww.cdc.govphlpnewscurrent.htmlh.docxRequired Resources httpswww.cdc.govphlpnewscurrent.htmlh.docx
Required Resources httpswww.cdc.govphlpnewscurrent.htmlh.docx
 
2009 assessment effects of cage culture on nitrogen
2009 assessment effects of cage culture on nitrogen2009 assessment effects of cage culture on nitrogen
2009 assessment effects of cage culture on nitrogen
 
Paleoecology_Paleolimnology _ Encyclopedia.com.pdf
Paleoecology_Paleolimnology _ Encyclopedia.com.pdfPaleoecology_Paleolimnology _ Encyclopedia.com.pdf
Paleoecology_Paleolimnology _ Encyclopedia.com.pdf
 
Micropaleontology in petroleum exploration.pptx
Micropaleontology in petroleum exploration.pptxMicropaleontology in petroleum exploration.pptx
Micropaleontology in petroleum exploration.pptx
 
Ostermann-Oceanus-2
Ostermann-Oceanus-2Ostermann-Oceanus-2
Ostermann-Oceanus-2
 
evaluation of water resources in wadi el natrun, western desert, egypt
evaluation of water resources in wadi el natrun, western desert, egyptevaluation of water resources in wadi el natrun, western desert, egypt
evaluation of water resources in wadi el natrun, western desert, egypt
 
munoz and stimola et al
munoz and stimola et almunoz and stimola et al
munoz and stimola et al
 
The Characteristic Algal Mats and Flora of El-Timsah Lake
The Characteristic Algal Mats and Flora of El-Timsah LakeThe Characteristic Algal Mats and Flora of El-Timsah Lake
The Characteristic Algal Mats and Flora of El-Timsah Lake
 
Dan Bower's Phosphate Thesis
Dan Bower's Phosphate ThesisDan Bower's Phosphate Thesis
Dan Bower's Phosphate Thesis
 
A330119
A330119A330119
A330119
 
Diversity and abundance of Macrobenthos in a subtropical estuary, Bangladesh
Diversity and abundance of Macrobenthos in a subtropical estuary, BangladeshDiversity and abundance of Macrobenthos in a subtropical estuary, Bangladesh
Diversity and abundance of Macrobenthos in a subtropical estuary, Bangladesh
 
Time of day influences foraging behavior of waterbirds in the Kruger National...
Time of day influences foraging behavior of waterbirds in the Kruger National...Time of day influences foraging behavior of waterbirds in the Kruger National...
Time of day influences foraging behavior of waterbirds in the Kruger National...
 
Once A Super Continent Final Draft
Once A Super Continent Final DraftOnce A Super Continent Final Draft
Once A Super Continent Final Draft
 
Speleothems Ppt
Speleothems PptSpeleothems Ppt
Speleothems Ppt
 
Mauro Passarella - Doctoral Research Proposal_October 2015
Mauro Passarella - Doctoral Research Proposal_October 2015Mauro Passarella - Doctoral Research Proposal_October 2015
Mauro Passarella - Doctoral Research Proposal_October 2015
 

fmicb-05-00679

  • 1. ORIGINAL RESEARCH ARTICLE published: 17 December 2014 doi: 10.3389/fmicb.2014.00679 Comparisons of the composition and biogeographic distribution of the bacterial communities occupying South African thermal springs with those inhabiting deep subsurface fracture water Cara Magnabosco1 *, Memory Tekere2 , Maggie C. Y. Lau1 , Borja Linage3 , Olukayode Kuloyo3 , Mariana Erasmus3 , Errol Cason3 , Esta van Heerden3 , Gaetan Borgonie4 , Thomas L. Kieft5 , Jana Olivier2 and Tullis C. Onstott1 1 Department of Geosciences, Princeton University, Princeton, NJ, USA 2 Department of Environmental Sciences, School of Agriculture and Environmental Sciences, University of South Africa, Florida, South Africa 3 Department of Microbial, Biochemical and Food Biotechnology, University of the Free State, Bloemfontein, South Africa 4 Extreme Life Isyensya, Gentbrugge, Belgium 5 Biology Department, New Mexico Institute of Mining and Technology, Socorro, NM, USA Edited by: D’Arcy Renee Meyer-Dombard, University of Illinois at Chicago, USA Reviewed by: Trinity Hamilton, Pennsylvania State University, USA Stephanie Ann Carr, Colorado School of Mines, USA *Correspondence: Cara Magnabosco, Department of Geosciences, Guyot Hall, Princeton University, Princeton, NJ 08544, USA e-mail: cm13@princeton.edu South Africa has numerous thermal springs that represent topographically driven meteoric water migrating along major fracture zones. The temperature (40–70◦C) and pH (8–9) of the thermal springs in the Limpopo Province are very similar to those of the low salinity fracture water encountered in the South African mines at depths ranging from 1.0 to 3.1 km. The major cation and anion composition of these thermal springs are very similar to that of the deep fracture water with the exception of the dissolved inorganic carbon and dissolved O2, both of which are typically higher in the springs than in the deep fracture water. The in situ biological relatedness of such thermal springs and the subsurface fracture fluids that feed them has not previously been evaluated. In this study, we evaluated the microbial diversity of six thermal spring and six subsurface sites in South Africa using high-throughput sequencing of 16S rRNA gene hypervariable regions. Proteobacteria were identified as the dominant phylum within both subsurface and thermal spring environments, but only one genera, Rheinheimera, was identified among all samples. Using Morisita similarity indices as a metric for pairwise comparisons between sites, we found that the communities of thermal springs are highly distinct from subsurface datasets. Although the Limpopo thermal springs do not appear to provide a new window for viewing subsurface bacterial communities, we report that the taxonomic compositions of the subsurface sites studied are more similar than previous results would indicate and provide evidence that the microbial communities sampled at depth are more correlated to subsurface conditions than geographical distance. Keywords: subsurface, thermal springs, diversity, 16S rRNA gene, V6 hypervariable region INTRODUCTION Although Whitman et al. (1998) estimated that the terrestrial subsurface biosphere comprises 40–50% of the world’s biomass; comprehensive surveys of its phylogenetic diversity and distribu- tion are geographically sparse relative to the immense volume the subsurface encompasses. Traditionally, mines and drilling have been used to access the deep biosphere; however, these activi- ties are costly and alternative means of studying the subsurface are desired. Deming and Baross (1993) were among the first to propose that deep-sea hydrothermal vents could provide “win- dows” to the deep biosphere of the oceanic crust. This was based upon the reasoning that only subsurface hyperthermophiles could survive within the hydrothermal vent fluids and that these flu- ids are representative of the sub-seafloor ocean crust at ridges and, by extension, the deep ocean crust globally. More recently, serpentinite seeps and springs have become a popular site for viewing the marine subsurface (Schrenk et al., 2010) as well as the terrestrial subsurface biosphere in California (Barnes et al., 1967; Morrill et al., 2013; Suzuki et al., 2013), Canada (Brazelton et al., 2012, 2013; Szponar et al., 2013), Portugal (Marques et al., 2008), Turkey (Hosgörmez, 2007), Yugoslavia, and Oman (Barnes et al., 1978). The reasoning is that the extremely high pH of these fluids (pH 10–12) can only support subsurface alkaliphilic microor- ganisms and that these fluids are representative of the ultrabasic serpentinite at depth. These springs provide an attractive target for sampling the terrestrial subsurface at lower cost; however, only a handful of terrestrial serpentinite sites are known and studied. In order to obtain a global picture of the deep terrestrial subsur- face, more surficial, terrestrial portals need to be studied and the means for identifying which microorganisms are truly “denizens” www.frontiersin.org December 2014 | Volume 5 | Article 679 | 1
  • 2. Magnabosco et al. Subsurface and thermal water diversity of the deep as opposed to spring communities merits further investigation (Brazelton et al., 2012). Thermal springs are widespread across the continents. Thermal water emerging at the surface has been warmed as a result of volcanic activity or deep circulation of ground- water (Todd, 1980). Gravity driven circulation can transport meteoric water to considerable depths, along fracture zones or dykes, before resurfacing at thermal springs. As water pene- trates underground, it is believed to warm at a rate of approx- imately 2–3◦C per 100 m (geothermal gradient) (Press and Siever, 1986) and, thus, the temperature of a thermal spring is directly related to both the depth of water penetration and the rate at which it ascends to the surface (Grasby and Hutcheon, 2001). There are over 90 thermal springs identified within South Africa (Olivier et al., 2011) and, since volcanic activity has not occurred in over 90 million years, these thermal springs have been attributed to the deep circulation of groundwater (Olivier et al., 2008). The bacterial and algal diversity of the springs have been reported by Tekere et al. (2011, 2012) and Jonker et al. (2013) along with geochemical data (Olivier et al., 2008). Additionally, South Africa is home to 1600 mines and 8 of the 10 deepest mines in the world (Kidd Creek Mine and Creighton Mine of Canada are the other two). Extensive studies of the water biodi- versity and geochemistry have been reported (Takai et al., 2001; Moser et al., 2003, 2005; Kieft et al., 2005; Gihring et al., 2006; Lin et al., 2006a,b; Borgonie et al., 2011). The thermal springs of the Limpopo Province occur at low elevations, in the Lowveld, whereas the mines used to access the subsurface meteoric water occur at high elevations, in the Highveld mostly. In principle the meteoric water recharging the water in the Highveld and migrat- ing to depth could be the source of thermal spring discharge in the Lowveld on a regional scale. This unique hydrogeological setting and infrastructure in South Africa provides an unprecedented opportunity to compare the microbial communities of deep frac- ture water microbial communities to those of thermal springs and assess whether the latter provide portals to the deep biosphere. This study is the first multi-site comparison of thermal springs and deep subsurface fracture waters in South Africa to address this question. MATERIALS AND METHODS As a preliminary investigation of the biological connectivity of thermal springs to the subsurface, 6 thermal springs (Eiland, Mphephu, Sagole, Siloam, Souting, Tshipise) and the fracture water from 6 mines, Beatrix gold mine (Be326), Driefontein gold mine (Dr5IPC), Finsch diamond mine (FI88), Masimong gold mine (MM51940), Zondereinde platinum mine (NO14), and Tau Tona gold mine (TT109) were sampled. The thermal springs are distributed over a distance of 120 km in the Limpopo Province of northern South Africa. The mines occur of a dis- tance of 500 km from northern South Africa to central South Africa. Access to these sites is difficult and, therefore, samples for thermal spring and subsurface datasets were collected sepa- rately and later combined for the purpose of this study. A more detailed description of sample collection and analysis is provided below. SAMPLE COLLECTION AND DNA EXTRACTION Thermal spring and subsurface samples were collected using separate procedures. Notably, the geochemical descriptions of Mphephu, Sagole, Siloam, and Tshipsie thermal springs have been previously published in Olivier et al. (2011). For both thermal spring and subsurface locations, water quality measure- ments such as temperature, pH, electrical conductivity (EC), and total dissolved salinity (TDS) were made in situ using hand- held probes (thermal spring: Mettler Toledo meters; subsurface: Hanna Instruments). Biological samples from thermal springs represent a combination of both the planktonic and biofilm com- munities, whereas the subsurface samples encapsulate only the planktonic community. In total, six thermal springs were sampled in the Limpopo province of South Africa, five from locations within the pools where the spring water was emerging from the ground and one, Siloam, from both the pool and from a pipe inserted into the spring source (Tekere et al., 2011, 2012). Analysis for chemi- cal parameters of the thermal spring water was performed at the Institute for Soil, Climate, and Water (Agricultural Research Council; Pretoria, South Africa) and described in Olivier et al. (2011). Water from Eiland and Souting thermal spring were ana- lyzed in parallel with these samples but not included in the Olivier et al. (2011) publication. For each thermal spring, 2 L of water were filtered onto a 1.2-µm pore size nitrate cellulose fil- ter and biofilm samples were collected and centrifuged at 2,000× g for 10 min. Upon collection, samples were placed in cooler boxes without temperature control and transported back to the University of South Africa for subsequent analysis. DNA was extracted from both the filter and cell pellet using the Genomic DNA Tissue Mini-Prep Kit (Zymo Research) with an additional DNA wash step (Tekere et al., 2011). DNA extracts from the biofilm and filter were pooled for each site and sequenced. In order to estimate the minimum depth from which the thermal water had originated, we subtracted the mean annual surface tem- perature from the in situ temperature of the water as an estimate for how much the thermal water had warmed at depth and then divided this value by the geothermal gradient in the region. In this calculation, we assumed that the average annual temperature of the Limpopo province was 20◦C and that the geothermal gra- dient was between 20◦C km−1 and 30◦C km−1 (Dhansay et al., 2014). Access to deep fracture water for sampling was obtained through boreholes located within gold, platinum and diamond mines throughout South Africa that have been drilled by the mines to detect water-filled fractures and, thus, prevent flood- ing in the mine. At each underground site, the borehole was opened and water was allowed to flow freely for 5 min to flush the borehole of contaminants. Subsurface fracture water and gas was analyzed using previously published methods (Lin et al., 2006a; Onstott et al., 2006; Lollar et al., 2008). An autoclaved, stainless steel manifold was attached to the borehole and con- nected to a stainless steel casing containing a pleated, 25-cm long Memtrex NY filter (MNY filter; Cat. No. MNY-91-1-AAS or MNY-92-1-AAS, General Electric Co.). Water was allowed to flow at a rate of ∼4 L/min through the filter and left for a period of approximately 2 weeks to collect biomass. The volume of water Frontiers in Microbiology | Extreme Microbiology December 2014 | Volume 5 | Article 679 | 2
  • 3. Magnabosco et al. Subsurface and thermal water diversity that flowed through the filter was measured with a flow accu- mulator and the amount of captured biomass was estimated by multiplying this volume by the cell counts (Supplement Table 1). The filters were transported back to Princeton using a MVE ZC 20/3V vapor shipper and stored at −80◦C until further process- ing. The borehole located in the Beatrix gold mine was sampled on two occasions, January 25, 2011 and July 27, 2012, and are reported as Be326_11 and Be326_12, respectively. DNA extrac- tion from the MNY filters was performed as outlined in Lau et al. (2014). SEQUENCING Extracted DNA from the thermal springs underwent two steps of PCR amplification. DNA was first amplified using universal degenerate primers (27F and 1492R) (DeSantis et al., 2007) and 30 PCR cycles under the conditions outlined in Tekere et al. (2011). After amplification, the entire PCR was loaded onto a 1% agarose gel and an approximately 1500-base pair (bp) band was excised and DNA was recovered using the GeneJET gel extrac- tion kit (Fermentas). The V4-7 region was then amplified using the primers outlined in Table 1 and an annealing temperature of 56◦C for 30 cycles. PCR product was then size-selected for 500–600-bp amplicons. Amplicons from each site were pooled at equal concentration and sequenced using a GS-FLX-Titanium (Roche) platform (Inqaba Biotechnology, South Africa). The subsurface DNA samples were shipped to the Marine Biological Laboratory (Woods Hole, MA) for sequencing. The V6 region of bacteria was first amplified for 25 cycles using a domain specific amplification by unfused primers (Table 1) and followed by a nested PCR for 5 cycles and fusion primers under the condi- tions outlined in Eren et al. (2013b). Platinum Taq Hi-Fidelity Polymerase (Life Technologies, Carlsbad CA) was used during PCR amplification. A 101-bp paired-end run was performed on one lane of an Illumina Hiseq 1000. SEQUENCE ANALYSIS The V4-7 hypervariable region of the 16S rRNA gene for the thermal spring sites were classified using the Ribosomal Database Project Classifier (Wang et al., 2007). A minimum bootstrap value of 60% at the phylum level was applied to remove sequences with poor annotation quality. Upon the completion of subsurface V6 sequencing, paired ends were joined and filtered under the requirement that the forward and reverse paired-end reads needed to exhibit 100% consensus in the overlap of the assembled sequence (Eren et al., 2013b). Sequences that matched contaminating sequences previ- ously identified in HiSeq runs at the Marine Biological Laboratory were also removed (Hilary Morrison, personal communication) (Supplement Table 2). Unique sequences and their respective abundance were then identified in the filtered dataset using the USEARCH (Edgar, 2010) “derep_prefix” command. Twelve chimeras were identified and removed using USEARCH’s refer- ence based chimera checker (Edgar et al., 2011) and Visualization and Analysis of Microbial Population Structures (VAMPS) refV6 database (http://vamps.mbl.edu/data_downloads/refv6.tgz). This was followed by a de novo chimera check (-uchime_denovo) that removed one sequence from the total dataset. The remaining sequences were annotated using the global alignment for sequence taxonomy (GAST) algorithm (Huse et al., 2008). GAST alignment was performed on a modified version of the refV6 database provided by VAMPS designed to include the V6 regions of bacteria belonging to Ignavibacteria (phylum Chlorobi) and South African subsurface clones that have been identified in previous subsurface studies (Takai et al., 2001; Moser et al., 2003, 2005; Kieft et al., 2005; Gihring et al., 2006; Lin et al., 2006a,b; Borgonie et al., 2011; Chehoud, 2011). Rather than pro- viding an e-value like BLAST, GAST returns a GAST distance that corresponds to a percent divergence of a queried sequence away from its best match. Huse et al. (2008) reported that a maximum distance cutoff of 0.15 is appropriate to maintain accu- racy in taxonomic annotation and, thus, a 0.15 distance cutoff was applied. In order to assess whether or not the fracture had experienced significant contamination from mining processes, we built a database of 16S rRNA sequences that had been previously identified in mine water and mine air of the South African subsur- face (Takai et al., 2001; Onstott et al., 2003; Gihring et al., 2006; Lin et al., 2006a,b; Davidson et al., 2011). In total, these studies identified 206 unique sequences of potential mining contami- nants from the environment that represented a total of 70 genera. These “potentially contaminating” genera were searched for in the subsurface GAST annotations and their relative abundance was calculated. To generate operational taxonomic units (OTUs), thermal spring sequences were first aligned using the RDP Infernal Aligner (Version 1.1.rc4) and filtered to include only sequences that aligned within the V4-7 region of the bacterial 16S rRNA gene Table 1 | Primers used. Environment Target variable Annealing Forward (F)/ Primer Primer Reference region temperature Reverse (R) name sequence (5 to 3 ) for primer Thermal Spring V4-7 56◦C F 530F GTGCCAGCMGCNGCGG Dowd et al., 2008 R 1073R ACGAGCTGACGACARCCATG Sundquist et al., 2007 Subsurface V6 60◦C F 967F CTAACCGANGAACCTYACC Sogin et al., 2006 CNACGCGAAGAACCTTANC CAACGCGMARAACCTTACC ATACGCGARGAACCTTACC R 1064R CGACRRCCATGCANCACCT Sogin et al., 2006 www.frontiersin.org December 2014 | Volume 5 | Article 679 | 3
  • 4. Magnabosco et al. Subsurface and thermal water diversity sequence template (Cole et al., 2014). Subsurface sequences were aligned in mothur (Schloss et al., 2009) against the aligned greengenes “core set” (DeSantis et al., 2006) using a gap penalty of −5. After alignment, a preliminary, pseudo-single linkage clustering step (Huse et al., 2010) was applied to the aligned sub- surface sequences using the “pre.cluster” command in mothur (Schloss et al., 2009). The mothur platform was then used to gen- erate a distance matrix (“dist.seqs,” calc=eachgap, countend=F) from which average linkage clustering (“cluster.split”) was per- formed. OTU clustering at the traditional 0.03 distance (97% of identity or OTU0.03) threshold exhibited a high percentage of singletons (>50%) that dramatically inflated the number of observed OTUs in the subsurface sequences (Supplement Table 3). As the total subsurface dataset was very large, shared OTUs were identified between sites through the following procedure: (1) each OTU0.03 was represented by the most abundant member; (2) sequences were merged and dereplicated using USEARCH; (3) unique sequences were aligned using the RDP Infernal Aligner (Version 1.1.rc4); (4) a distance matrix was constructed and clus- tered in mothur as previously described; (5) shared OTUs were identified as those OTUs that clustered at a distance of 0.0049 in mothur. Singletons were included in this study as the taxonomic dis- tribution of the subsurface dataset was unaffected by singletons at the phylum level (Supplement Figure 1A). The distribution of annotation quality score, given by the GAST distance, for V6 sin- gletons was slightly skewed to the right when compared to the total V6 dataset due to an increased proportion of 0.01–0.02 range GAST distances (Supplement Figure 2). Diversity results after the removal of singletons are reported in Supplement Table 4. Rarefaction curves, Pielou’s Evenness (Equation 1) (Pielou, 1967), Chao1 estimates (Equation 2) (Chao, 1984), and Sørensen (Equation 3) (Sorensen, 1948) and Morisita (Equation 4) (Morisita, 1959) similarity indices for all samples were calculated on the genus level using the Vegan Package (Oksanen et al., 2013) in R and following equations: Pielou’s Evenness = H’/log2(Gobs) (1) where H’ = − G i = 1 pi log2 pi, pi is the proportion of genera i in a sample, and Gobs is the number of genera observed in a sample. Chao1 = Gobs + F2 1/2F2 (2) where Gobs is the number of genera observed, F1 is the number of observed singleton genera for a sample and F2 is the number of observed doubleton genera for a sample. Sørenson index = 2c a + b (3) where a is the number of genera in sample 1, b is the number of genera in sample 2, and c is the number of genera in common between 1 and 2. Morisita Index = Cλ = 2 G i = 1 n1in2i (λ1 + λ2)N1N2 (4) where λj = G i = 1 nji(nji−1) Nj(Nj−1) , nji is the number of individuals of genera i in sample j and Nj is the number of individuals in sample j. The Morisita similarity index was calculated to compare sites because, unlike the Sørensen index, it is robust to differences in sample size (Wolda, 1981). The Morisita similarity index was then transformed into what we designate as the “Morisita dissimilarity index” (1-Morisita Index) for subsequent hierarchical clustering. Although the majority of comparisons in this study were made at the genus level, we also sought to identify what sequences were shared between the thermal spring subsurface sites. To perform this analysis, Bowtie (Langmead et al., 2009) was used to map sub- surface V6 sequences to the thermal spring V4-7 dataset under two schemes: (1) a perfect match scenario (-v 0); and (2) a 2 mismatches (-v 2) scenario. In order to better assess the veracity of the taxonomic infer- ences drawn from our V6 dataset, we employed oligotyping techniques developed by Eren et al. (2013a) (http://oligotyping. org/) to identify nucleotide level variation within the OTU and genus levels. During oligotyping, the Shannon entropy of each nucleotide position within a group of highly simi- lar sequences, such as an OTU or genus, was calculated and followed by a supervised strategy to identify and decompose the variable sites into oligotypes. For this study, all subsurface sequences found to be closely related (maximum GAST dis- tance of 0.03) to Candidatus (Ca.) Desulforudis (n = 1381) and Dehalogenimonas (n = 1, 226) were analyzed using this oligotyp- ing pipeline. Shannon entropy profiles were generated using the “entropy-analysis” command on the following groups of sub- surface sequences: (1) all sequences related to Ca. Desulforudis; (2) all sequences related to Dehalogenimonas; and (3) the largest OTU0.03 of Dehalogenimonas (n = 260). These entropy profiles were then used to select the appropriate number of components (−c) for the “oligotype” command. A minimum substantive abundance (−M) of 20 was applied to remove erroneous reads. Notably, Ca. Desulforudis and Dehalogenimonas were selected for oligotyping because they were the most abundant genera identified within all subsurface sites. STATISTICAL ANALYSIS Individual sequences of both subsurface and thermal spring sites were used in the implementation of weighted and unweighted UniFrac significance tests (1,000 iterations, subsample = T) (Lozupone and Knight, 2005). These tests were performed in mothur to determine whether or not the communities within each environment type (thermal spring or subsurface) were sig- nificantly different from one another. FastTree (Price et al., 2009) was used to generate the tree for UniFrac significance tests under default settings with Methanobrevibacter woesei (NCBI accession number DQ445721) as the outgroup. A thermal spring geographic distance matrix and (separate) subsurface geographic distance matrix were calculated from the longitude and latitude coordinates of thermal spring and sub- surface sampling locations using the “rdist.earth” command in R. Each distance matrix was then correlated to its respec- tive Morisita dissimilarity matrix using the “Pearson” function Frontiers in Microbiology | Extreme Microbiology December 2014 | Volume 5 | Article 679 | 4
  • 5. Magnabosco et al. Subsurface and thermal water diversity in Excel. The resulting Pearson product-moment correlation coefficient (PCC) was converted to an R2 value for future comparisons. In order to determine the subset of environmental vari- ables with the highest correlation to the Morisita community dissimilarity matrix, the “bioenv” command in the vegan R pack- age was applied (Oksanen et al., 2013). This function builds a Euclidean distance matrix (site × site) based on a subset of scaled environmental variables. The PCC between the environmental distance matrix and phylum-based Morisita community dissimi- larity matrix was then calculated. This procedure was performed on environmental distance matrices generated from all possible subsets of environmental variables that the user inputs. For exam- ple, environmental distance matrices were generated from all possible combinations of surface elevation, temperature, depth, pH, TDS, Na+, K+, Ca2+, Mg2+ of the thermal spring dataset. The correlation between the 511 thermal spring environmental distance matrices and the thermal spring Morisita dissimilarity matrix were then, individually, calculated. The subset of envi- ronmental variables that provided the distance matrix with the highest correlation to the Morisita dissimilarity matrix was then returned with a PCC and R2 value. The same procedure was carried out on the subsurface dataset using the environmental parameters of surface elevation, temperature, depth, pH, TDS, biomass and the concentrations of Na+, K+, Ca2+, Mg2+, O2, NO− 3 , Cl−, SO2− 4 , dissolved inorganic carbon (DIC), CH4, H2, and dissolved organic carbon (DOC). Thermal spring and sub- surface datasets were analyzed separately due to the fact that the experimental design used to study these two environments was different. Additionally, pairwise (column × column) Pearson corre- lations and significance were computed for a matrix contain- ing environmental data and the relative abundance of each phylum (columns) for each sample (rows) using the rcor.test function (ltm R package; Rizopoulos, 2006). This analysis was performed on the thermal spring and subsurface datasets, sep- arately. Notably, the relative abundance of phyla for each group (either thermal spring or subsurface) was calculated from the average of subsampling each sample to 85% of the smallest sample in the group over 1,000 iterations. Significance values (p-values) returned by rcor.test were adjusted for multiple tests using the “qvalue” package in R (Dabney et al., 2010). Only pairwise cor- relations with a p-value of <0.05 and q of <0.05 were declared significant. RESULTS GEOGRAPHIC LOCATION AND GEOCHEMISTRY All six thermal springs are located within the Limpopo Province of South Africa, within 120 km of each other. Four of the springs, Mphephu, Sagole, Siloam, and Tshipise are located in sediments and volcanic units of the Karoo Supergroup, ranged in elevation from 446 to 841 masl. (Table 2A), and are likely fed by mete- oric recharge in the Soutpansberg Mountains formed by Karoo Supergroup sandstones. Eiland and Souting occur in Archean gneiss. They occur in the Lowveld, east of the escarpment that marks the boundary with the Highveld and range in elevation from 389 to 433 masl. (Olivier et al., 2011). The six mines are distributed over 500 km of the Kaapvaal Craton and, with the exception of NO14, occur in the Highveld with elevations ranging from 1375 to 1681 masl. (Table 2B). NO14 was collected at the Zondereinde platinum mine, which occurs in the Bushveld Igneous Complex. Geographically, it lies closer to the thermal springs than to Finsch diamond mine (FI88), Beatrix (BE326), or Masimong gold mines (MM51940) (Supplement Figure 3). Siloam was the warmest thermal spring with measured tem- peratures of 63–67◦C, comparable to the hottest subsurface site, NO14, with a measured temperature above 65◦C. The shallowest subsurface sites (Dr5IPC and FI88) contained the coolest water sampled (26.8◦C and 28.6◦C, respectively) and were more than 10◦C cooler than the coolest thermal spring sampled, Eiland (40–42◦C). The thermal spring temperatures were consistent with a minimum depth of ground water circulation ranging from 700–2250 m (Table 2A). These minimum depth estimates over- lapped the 1046–3136 m below surface (mbs.) sampling depths of the fracture water samples. The pH of the six thermal springs sampled ranged from 7.6 (Eiland) to 9.7 (Sagole), whereas the pH of the subsurface frac- ture water was more narrowly restrained from 7.4 (Dr5IPC) to 8.3 (Be326). The TDS of the thermal springs ranged from fresh to brackish (237 ppm for Sagole to 10,130 ppm for Souting), overlapping the TDS of the fracture water, which ranged from 188 (Dr5IPC) to 4473 ppm (Be326_11). The O2 concentra- tion of the thermal springs ranged from 20 µM (Sagole) to 130 µM (Mphephu) and were elevated above the subsurface O2 concentrations that ranged from below detection (<1 µM) to 9.4 µM (Be326_2012). The thermal springs located in the Karoo Supergroup had a sodium carbonate composition, whereas the thermal springs located in the Archean gneiss had a sodium chloride composition (Olivier et al., 2011). The fracture water composition ranged from a calcium, magnesium carbonate (Dr5IPC) to sodium chloride composition (Be326). When plot- ted on a Durov projection Dr5IPC was geochemically very similar to the Mphephu thermal spring water (Figure 1). SEQUENCING SUMMARY A total of 3,055 sequences from the V4-7 hypervariable region of the 16S rRNA gene were generated for the thermal spring sites. Sequences generated for each site varied in length (average length 360 ± 144 bp) (Supplement Figure 4) and number (Table 3). A total of 291 genera within 17 phyla were observed in the thermal springs after annotation quality filtering was applied. The number of V6 sequences passing the 100% overlap qual- ity filtering was 139,092 and ranged from 14,227 (Be326_2011) to 23,343 (Be326_2012) sequences per site. After annotation using GAST, 87% (Dr5IPC) to 94% (Be326_2011) of the sequences were assigned an annotation and used in downstream analy- ses (Table 3). The number of genera identified for each site ranged from 549 (Dr5IPC) to 655 (MM51940), and the num- ber of OTU0.03 ranged from 5,952 (Be326_2011) to 9,456 (MM51940). A total of 874 genera spanning 44 phyla were observed in the subsurface sequences. When singletons were removed, a total of 616 genera were identified and the number of OTU0.03 ranged from 2,478 (Be326_2011) to 3,987 (Be326_2012) www.frontiersin.org December 2014 | Volume 5 | Article 679 | 5
  • 6. Magnabosco et al. Subsurface and thermal water diversity Table 2A | Physical and chemical properties of hot spring water samplesa. Parameter Eiland Mphephu Sagole Siloam Souting Tshipise Latitude (S) 23◦39 31 22◦54 20 22◦31 45.4 22◦53 22.6 23◦25 9 22◦36 31.5 Longitude (E) 30◦40 23.6 30◦10 38 30◦40 50 30◦11 39 30◦54 44 30◦10 16.7 Elevation (masl.) 433 796 446 841 389 542 Temperature (◦C) 40–42 43 45 63–67 40.1–43.9 58 Estimated depth (m)b 700–1050 767–1150 830–1250 1500–2250 730–1100 1267–1900 pH 7.63 8.08–8.19 9.24–9.70 8.8–9.5 7.8 8.3–8.94 TDS (ppm) >1862 275 237 252 10130 523 O2 (M) n.a. 1.3 × 10⁻⁴ 1.9 × 10⁻⁵ 6.9 × 10⁻⁵ n.a. 6.1 × 10⁻⁵ Na+ (M) 2.7 × 10⁻² 1.9 × 10⁻³ 2.8 × 10⁻³ 2.9 × 10⁻³ 1.5 × 10⁻¹ 6.8 × 10⁻³ K+ (M) 5.6 × 10⁻⁴ 2.9 × 10⁻⁵ 2.8 × 10⁻⁵ 7.2 × 10⁻⁵ 7.9 × 10⁻⁴ 1.1 × 10⁻⁴ Ca2+ (M) 1.3 × 10⁻³ 3.4 × 10⁻⁴ 3.3 × 10⁻⁵ 3.4 × 10⁻⁵ 6.0 × 10⁻³ 1.4 × 10⁻⁴ Mg2+ (M) 3.9 × 10⁻⁴ 4.6 × 10⁻⁴ 2.9 × 10⁻⁶ 5.5 × 10⁻⁴ 3.3 × 10⁻³ 6.7 × 10⁻⁶ NO− 3 (M) 4.0 × 10⁻⁵ 3.4 × 10⁻⁵ <d.l. <d.l. 4.3 × 10⁻⁵ 9.8 × 10⁻⁶ Cl− (M) 2.8 × 10⁻² 1.1 × 10⁻³ 1.4 × 10⁻³ 1.3 × 10⁻³ 1.6 × 10⁻¹ 4.8 × 10⁻³ SO2− 4 (M) 1.5 × 10⁻³ 9.5 × 10⁻⁵ 1.9 × 10⁻⁴ 1.1 × 10⁻⁵ 7.9 × 10⁻³ 5.5 × 10⁻⁴ HPO2− 4 (M) 2.6 × 10⁻⁴ <d.l. <d.l. <d.l. <2.5 × 10⁻⁵ 2.8 × 10⁻⁵ DIC (M) <d.l. 2.5 × 10⁻³ 2.0 × 10⁻³ 2.0 × 10⁻³ n.a. 2.2 × 10⁻³ aThis table is adapted from Olivier et al. (2011). Adaptions include the conversion of the various geochemical quantities of Mphephu, Sagole, Siloam, and Tshipise into molar concentrations and the addition of Eiland and Souting into the dataset. bEstimated depth = (temperature − mean annual surface temperature)/geothermal gradient, where the mean annual surface temperature was assumed to equal 20 ◦C and the geothermal gradient was assumed to be 20 ◦C km−1 and 30 ◦C km−1. masl., meters above sea level; n.a., data not available; <d.l., below detection limit. Table 2B | Physical and chemical properties of fracture water samples. Parameter Be326_2011 Be326_2012 Dr5IPC FI88 MM51940 NO14 TT109_Bh2 Sampling Code FW250111Bh2 FW270712Bh2 FW280711 FW031012 FW200712 FW130912 FW060312 Latitude (S) 28◦14 24.3 28◦14 24.3 26◦25 12 28◦22 43 27◦58 24 24◦49 43 26◦24 55 Longitude (E) 26◦47 49.2 26◦47 49.2 27◦30 10 23◦26 45 26◦52 39 27◦20 26 27◦27 45 Surface Elevation (masl.) 1375 1375 1654 1545 1386 985 1681 Depth (mbs.) 1339 1339 1046 1056 1900 2100 3136 T (◦C) 36.9 38.1 26.8 28.6 40.7 >65** 48.7 pH 8.83 8.55 7.39 7.9 7.71–8.18 8.48 8.19 TDS (ppm) 4473 3586 188 1282 3120 2374 296 O2 (M) <3.1 × 10⁻⁷ 9.4 × 10⁻⁶ 1.9 × 10⁻⁶ 1.3 × 10⁻⁶ 1.9 × 10⁻⁶ 3.1 × 10⁻⁶ 6.3 × 10⁻⁶ CH4(M) 2.0 × 10⁻³ 9.0 × 10⁻⁴ 2.6 × 10⁻⁵ <10−4 8.9 × 10⁻³ 3.2 × 10⁻⁴ 2.3 × 10⁻³ H2 (M) 1.3 × 10⁻⁷ 8.9 × 10⁻⁹ 3.2 × 10⁻⁹ <10−8 1.9 × 10⁻⁷ 4.5 × 10⁻⁶ 3.6 × 10⁻⁷ Na+ (M) 7.8 × 10⁻² 4.8 × 10⁻² 2.2 × 10⁻³ 9.9 × 10⁻³ 4.5 × 10⁻² 9.4 × 10⁻² 3.4 × 10⁻³ K+ (M) 7.3 × 10⁻⁴ 8.5 × 10⁻⁴ 5.6 × 10⁻⁵ 1.8 × 10⁻⁴ 4.0 × 10⁻⁴ 4.1 × 10⁻³ 4.2 × 10⁻⁵ Ca2+ (M) 2.9 × 10⁻³ 3.9 × 10⁻³ 5.0 × 10⁻⁴ 5.6 × 10⁻³ 1.9 × 10⁻³ 2.5 × 10⁻³ 5.2 × 10⁻⁴ Mg2+ (M) 5.6 × 10⁻⁵ 2.6 × 10⁻⁵ 4.0 × 10⁻⁴ 1.5 × 10⁻⁴ 9.9 × 10⁻⁵ 6.4 × 10⁻⁴ 3.4 × 10⁻⁵ NO− 3 (M) 3.7 × 10⁻⁷ 6.0 × 10⁻⁶ 1.5 × 10⁻⁶ 1.5 × 10⁻⁵ 9.7 × 10⁻⁷ n.a. 1.1 × 10⁻⁷ Cl− (M) 7.0 × 10⁻² 6.2 × 10⁻² 1.4 × 10⁻³ 2.2 × 10⁻² 5.5 × 10⁻² 5 × 10⁻² 3.2 × 10⁻³ SO2− 4 (M) 1.4 × 10⁻⁴ 6.2 × 10⁻⁴ 1.4 × 10⁻⁴ 3.0 × 10⁻⁴ 7.0 × 10⁻⁶ n.a. 1.0 × 10⁻⁴ HPO2− 4 (M) <1.1 × 10⁻⁶ 3.0 × 10⁻⁷ 1.6 × 10⁻⁷ 3.5 × 10⁻⁷ <3.2 × 10⁻⁷ 1.1 × 10⁻⁷ 1.2 × 10⁻⁶ DOC (M) 1.5 × 10⁻⁵ 2.9 × 10⁻⁵ 8.5 × 10⁻⁵ 1.3 × 10⁻⁴ 4.5 × 10⁻⁵ 2.6 × 10⁻⁵ 3.9 × 10⁻⁵ DIC (M) 5.1 × 10⁻⁴ 3.3 × 10⁻⁴ 2.4 × 10⁻³ 5.4 × 10⁻⁵ 4.3 × 10⁻⁴ 5.2 × 10⁻⁴ 6.9 × 10⁻⁴ DIC Age (kyr) >32 >20 16–23 >32 >32 4.28 16-21 **65◦C was the upper temperature limit of the thermometer used. masl., meters above sea level; mbs., meters below surface; n.a., data not available. Frontiers in Microbiology | Extreme Microbiology December 2014 | Volume 5 | Article 679 | 6
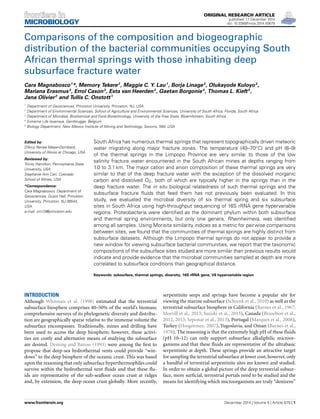
  • 7. Magnabosco et al. Subsurface and thermal water diversity (Supplement Table 3). Of the 258 genera that were represented solely by a single sequence at any subsurface site, 125 were “true” singletons—meaning that the genus was represented by only 1 sequence in the combined subsurface dataset. Upon removal of the 258 singleton genera, the taxonomic distribution and similarity indices remained largely the same (Supplement FIGURE 1 | Durov plot of thermal spring and subsurface chemistry. Geochemical parameters of thermal spring (filled circles) and subsurface (open circles) are plotted on a Durov Plot. Figure 1) and, thus, singletons were included in the subsequent analyses. TAXONOMIC DISTRIBUTION OF THERMAL SPRINGS Rarefaction curves (Supplement Figure 5) revealed that sequences from Eiland, Mphephu, Sagole and Siloam thermal springs captured more of the diversity within those sites than the limited number of sequences from Souting (n = 132) and Tshipise (n = 120) thermal springs did. A comparison of the observed number of genera vs. the number estimated by the Chao1 parameter (Chao, 1984) suggested that the sequences represent 47% (Tshipise) to 68% (Mphephu) of the predicted total number of genera present in the thermal springs (Table 3). All thermal spring samples yielded taxonomic distributions that were found to be significantly different (p < 0.001) from one another through both weighted and unweighted pairwise Unifrac significance tests (Lozupone and Knight, 2005). Four of the six thermal springs (Eiland, Siloam, Souting, and Tshipise) were found to be dominated (>50%) by Proteobacteria, whereas approximately 55% of Mphephu’s sequences belonged to Bacteroidetes. Sagole’s most abundant phylum was Cyanobacteria (32%) (Figure 2). Souting was found to be the thermal spring site with the highest even- ness (Pielou’s evenness = 0.83; Table 3) with 30 different genera of Gammaproteobacteria present. Eiland exhibited the lowest Pielou’s evenness (0.57) with 60% of sequences belonging to two genera of Proteobacteria: Hydrogenophaga (class Betaproteobacteria) and Stenotrophomonas (class Gammaproteobacteria). Sequences from Siloam contained the highest number of unique genera (119), whereas Tshipise Table 3 | Summary of diversity statistics for thermal spring and subsurface samples. Site Number of Number of reads Number of Pielou’s Chao1a reads classified by RDP* or GAST∧ genera observed evenness Eiland 720 698 (97%)b 49 (62%)c 0.57 79 ± 19 Mphephu 721 673 (93%)b 92 (68%)c 0.69 135 ± 20 Sagole 794 662 (83%)b 113 (59%)c 0.72 190 ± 30 Siloam 568 515 (91%)b 119 (57%)c 0.78 209 ± 34 Souting 132 120 (91%)b 39 (57%)c 0.83 68 ± 21 Tshipise 120 110 (92%)b 30 (47%)c 0.74 64 ± 31 Total thermal springs 3,055 2, 778 (91%)b 291 (70%)c 0.73 412 ± 31 Beatrix Au Mine—Be326_2011 14,227 13, 328 (94%)d 551 (77%)c 0.80 716 ± 37 Beatrix Au Mine—BE326_2012 23,343 21, 806 (93%)d 634 (86%)c 0.80 739 ± 25 Driefontein Au Mine—Dr5IPC 18,215 15, 876 (87%)d 549 (84%)c 0.80 653 ± 24 Finsch Diamond Mine—FI88 18,719 17, 282 (92%)d 573 (79%)c 0.78 725 ± 34 Masimong Au Mine—MM51940 22,984 20, 768 (90%)d 655 (86%)c 0.80 760 ± 24 Zondereinde Pt Mine—NO14 22,237 20, 676 (93%)d 640 (86%)c 0.79 744 ± 24 Tau Tona Au Mine—TT109 19,367 17, 792 (92%)d 569 (83%)c 0.77 689 ± 27 Total subsurface 139,092 127, 528 (92%)d 874 (88%)c 0.77 991 ± 28 aChao1 is estimated at the genus level. bMinimum bootstrap value of 60% at phylum level. cObserved Genera/Chao1 in percent. d Maximum distance of 0.15. www.frontiersin.org December 2014 | Volume 5 | Article 679 | 7
  • 8. Magnabosco et al. Subsurface and thermal water diversity FIGURE 2 | Thermal spring taxonomic distribution. A bar plot of the relative abundance (x-axis) of various phyla (color) per thermal spring site (y-axis). Due to its high relative abundance, the phylum proteobacteria was split into its corresponding classes. Members of the “Other” bin include: Armatimonadetes, Spirochaetes, SR1, and Synergisetes. contained the fewest unique genera (30) (Table 3). No sequences derived from Tshipise were related to Alphaproteobacteria. TAXONOMIC DISTRIBUTION OF SOUTH AFRICAN SUBSURFACE SITES Although the subsurface rarefaction curves (Supplement Figure 5) did not attain a plateau, the reduced slope of each curve toward the terminus suggested that the sequences for each of these samples are representative of their bacterial community. Across all sites, Proteobacteria were the most abundant phylum, with relative abundances ranging from 49% (Dr5IPC) to 59% (Be326_2012) (Figure 3). Weighted, pairwise Unifrac signifi- cance tests indicated that all sites were significantly different (p < 0.001); however, unweighted, pairwise UniFrac significance tests revealed that only 7 of the 21 pairs of sites were found to be significantly different (p < 0.05) from one another (Supplement Figure 6). All subsurface sites displayed a Pielou’s evenness between 0.77 (TT109) and 0.80 (MM51940) (Table 3). Previous studies of South African fracture fluids (Takai et al., 2001; Moser et al., 2003, 2005; Kieft et al., 2005; Gihring et al., 2006; Lin et al., 2006a,b; Borgonie et al., 2011) identified a total of 243 unique genera in the South African subsurface (Chehoud, 2011). Of these 243 genera, 139 were observed in our V6 datasets. POTENTIAL CONTAMINANTS IN THE SUBSURFACE Within the subsurface V6 dataset, 49 of the 70 designated con- taminant genera (see Section Sequence Analysis) were identified in our subsurface samples. The relative abundance of these genera ranged from 4.3% (Dr5IPC) to 8.6% (Be326_2012) of each site’s V6 dataset. Unfortunately, we cannot unambiguously determine whether or not these genera are true contaminants because min- ing water is a mixture of water released during dewatering of fractures and water derived from regional water supplies; how- ever, we make the conservative assumption that they could be contaminants that penetrated the fractures during drilling with mining water. OLIGOTYPING Oligotyping was performed on all subsurface sequences related to the two most abundant subsurface genera, Ca. Desulforudis and Dehalogenimonas, to identify nucleotide level variation within the OTU and genus level. A total of 1,381 sequences were identified as related to Ca. Desulforudis while 1,226 sequences were identified as related to Dehalogenimonas representing 62 and 164 OTUs at the 97% identity level, respectively. Entropy profiles for all sequences from each genus can be found in Figures 4Ai,B. Eren et al. (2013a) reported that random sequenc- ing errors generate entropy values near or below 0.2. For Ca. Desulforudis, 59 of the 61 positions exhibited Shannon entropy values less than 0.2, while the remaining two positions had entropy values of 0.2487 and 0.2125. Oligotyping of these 2 positions (−c 2, −M 20) revealed that only one oligotype was present (Figure 4Aii), suggesting that the Ca. Desulforudis genus Frontiers in Microbiology | Extreme Microbiology December 2014 | Volume 5 | Article 679 | 8
  • 9. Magnabosco et al. Subsurface and thermal water diversity FIGURE 3 | Subsurface taxonomic distribution. A bar plot of the relative abundance (x-axis) of various phyla (color) per subsurface site (y-axis). Due to its high relative abundance, the phylum proteobacteria was split into its corresponding classes. Members of the “Other” bin include: BRC1, Caldiserica, Chlamydiae, Chloroplast, Crenarchaeota, Dictyoglomi, Elusimicrobia, Euryarchaeota, Fibrobacteres, Gemmatimonadetes, Lentisphaerae, Mitochondria, OP1, OP2, OP8, OP10, OP11, Spirochaetes, Synergistetes, TA06, Tenericutes, TG-1, Thermotogae, TM6, TM7, WS1, WS3, WS6, and Zetaproteobacteria. identified within the subsurface contain highly similar V6 regions. On the other hand, the Shannon entropy profile of all sequences related to Dehalogenimonas showed that 33 of the 61 positions of the V6 region contained entropy values greater than 0.2 (Figure 4B). Due to the large number of high entropy posi- tions in Dehalogenimonas-related V6 sequences, oligotyping was performed on the most abundant OTU0.03 (n = 260) instead of the complete set of sequences assigned to this genus. For this OTU, Shannon entropy profiles indicated two high entropy positions that decomposed into 2 oligotypes (−c 2, −M 20; Figure 4C). SHARED TAXA There was a very large difference between the communities of individual thermal springs. No individual sequence was found in multiple thermal spring sites, however, when sequences were clus- tered into OTUs at a distance of 0.03, two OTU0.03 were shared between Eiland and Mpephu, one OTU0.03 was shared between Eiland and Sagole, and one OTU0.03 was shared between Sagole and Siloam. At the genus level, Sagole and Siloam shared the greatest number of genera (n = 41; Sørensen index = 0.35) while Souting and Tshipise shared the lowest number of genera (n = 5; Sørensen Index = 0.14) (Figures 5A,B). All seven subsurface samples shared 220 genera and 1410 V6 sequences. Shared V6 sequences were present at similar rela- tive abundances within each subsurface site (Supplement Figure 7). NO14 and MM51940 shared the most genera (n = 551) and exhibited the highest Sørensen indices (0.85) (Figures 5A,B, respectively). At the OTU0.03 level, Sørensen similarity indices ranged from 0.59 to 0.69 between sites—a range higher than previously reported in the South African subsurface (Figure 6). When singleton genera were removed, Sørensen indices increased slightly (0.70–0.85 to 0.80–0.88), while Morisita dissimilarity indices remain unchanged (Figures 5B,D; Supplement Figure 1B,D). A direct alignment of subsurface V6 sequences onto the collection of thermal spring sequences allowed us to determine whether or not subsurface V6 sequences were present in the thermal springs. However, only 367 (12%) of thermal spring sequences were long enough to capture the V6 region of the 16S rRNA gene and, therefore, this direct comparison of V6 sequences is not a complete representation of the presence or absence of V6 sequences shared between both environments. Despite this shortcoming, through alignment, we found that 13 thermal spring V6 sequences were present in the subsurface samples (Supplement Figure 8A). These shared sequences were related to Proteobacteria, Bacteroidetes, Deinococcus-Thermus, and Fusobacteria. Five of the 13 shared sequences were present in all seven subsurface V6 datasets. When a 2-bp mismatch was allowed, only 2 additional thermal spring sequences [relating to Azonexus (Proteobacteria) and Propionigenium (Fusobacteria)] were identified in the subsurface (Supplement www.frontiersin.org December 2014 | Volume 5 | Article 679 | 9
  • 10. Magnabosco et al. Subsurface and thermal water diversity FIGURE 4 | Oligotypes of abundant genera. Entropy profiles for Desulforudis (Ai), Dehalogenimonas (B), and Dehalogenimonas OTU1 (Ci) are a discrete xy plot where the x-axis is the nucleotide position in the alignment and the y-axis is the calculated Shannon entropy for that position. Figures (Aii) and (Cii) display the relative abundance of the oligotypes observed. For Desulforudis, only one oligotype (AA) was observed while Dehalogenimonas revealed two oligotypes (AA, GG). The position of these distinctive nucleotides can be found in the entropy plot of (Ci). The elevated entropy at positions 1 and 40 reveal that these positions are where the single nucleotide changes occur. Figure 8B). As the occurrence of sequences within multiple sub- surface samples may be a result of contamination from surface water sources during mining, we also compared the genera of sequences shared between the thermal spring and subsurface environments with the genera in our mining contaminant dataset (see Section Sequence Analysis). We found that 4 of the 12 genera (Blastomonas, Novosphigmodium, Meithermus, and Rheinheimera) identified in both thermal springs and subsurface sites were also identified as possible mining contaminants. RELATIONSHIP OF TAXONOMY TO ENVIRONMENT After performing a pairwise-Pearson correlation for all combina- tions of phyla and environmental variables in the thermal spring and subsurface datasets (separately), no significant correlations were found. However, we were able to identify which sets of environmental variables had the highest correlation to each envi- ronment’s respective Morisita dissimilarity matrix. The Morisita dissimilarity matrix of the thermal springs was most correlated to a Euclidian distance matrix constructed from the scaled values of surface elevation and pH (R2 = 0.20). The subsurface Morisita dissimilarity matrix was most correlated to a Euclidian distance matrix constructed from the scaled values of surface elevation, pH, TDS and the concentrations of O2, Ca+, DIC, CH4, and Cl− (R2 = 0.83). The geographical distance matrices were not highly correlated to the thermal spring (R2 = 0.03) or subsurface (R2 = 0.12) Morisita dissimilarity matrices. DISCUSSION The similarity in geochemistry of the Limpopo thermal springs and South African subsurface suggested that the springs might provide a portal to the deep biosphere. However, although Proteobacteria dominated the majority of thermal spring and subsurface sites, there are more differences than similarities when the microbial communities of the thermal springs and subsurface sites are compared. DIFFERENCES IN THE DIVERSITY OF THERMAL SPRINGS AND SUBSURFACE SITES In order to compare the community composition of various envi- ronments, Morisita dissimilarity indices (MDI) were calculated for all pairs of samples (Figure 5D). Hierarchical clustering of this dissimilarity matrix indicates that the communities of ther- mal springs and subsurface environments are distinct from one another (Figure 5C). Although Mphephu and Dr5IPC were, geo- chemically, the most similar thermal spring and subsurface frac- ture, they are, taxonomically, further apart from each other (MDI: 0.99) than Mphephu is from the geochemically quite dissimilar thermal spring of Souting (MDI: 0.92). The number of genera observed in the thermal springs (30–119) was much lower than in the subsurface sites (549–655), although this may reflect the smaller sample volumes and lower number of reads of the thermal spring samples (see Section Comments on Experimental Design). Within environment types, the microbial communities of thermal springs exhibited higher MDIs (MDIs 0.45–0.99) when compared Frontiers in Microbiology | Extreme Microbiology December 2014 | Volume 5 | Article 679 | 10
  • 11. Magnabosco et al. Subsurface and thermal water diversity FIGURE 5 | Measurements of similarity between thermal spring and subsurface sites. Pair-wise comparisons have been made by counting the total number genera shared between sites (A) and calculation of the Sorensen similarity index (B) and Morisita dissimilarity indices (1-Morisita index) (D). Color-coding of (A,B,D) are purely for visual aid where red indicates more similar pairs and blue is indicative of more distant pairs. The diagonal of (A) indicates the number of genera identified in the sample. (C) is a visual representation of the hierarchical clustering of the Morisita dissimilarity matrix (D). Subsurface sites in (C) are labeled with pink squares and thermal spring sites are labeled with green circles. The columns of (D) are indicated by the branches of (C) whereas the columns of (A,B) are labeled. Black squares labeled 0.00 in (D) indicate the same sample in the row and (C)’s branch. to the subsurface samples (MDIs 0.04–0.49). It has been well reported that the microbial communities of hot springs are highly variable due to effects of water flow, hail, trampling, and sea- sonal variation (Brock and Brock, 1969; Ferris et al., 1997; Ward et al., 1998; Fouke et al., 2003). Tekere et al. (2012) attributed the distinctive taxonomic distributions of the Limpopo thermal springs to differences in geographical settings such as the large populations of fermentative Bacteroidetes found at the Mphephu springs—a site with a high input of organic carbon from the sur- rounding vegetation. Furthermore, as the thermal spring dataset is a combination of planktonic and biofilm communities, it is likely that the biofilm communities play a large role in the inter- site variation observed in the thermal springs. Fouke et al. (2003) and Meyer-Dombard et al. (2011) have reported that the com- munities formed on a biofilm can vary locally even when fed by the same source water. For the thermal springs sampled, only one section of each spring’s biofilm was collected and analyzed in con- junction with 2 L of filtered water. The small sample size in the thermal spring dataset undoubtedly amplifies local effects within a thermal spring community and further elevates the amount of variation observed between thermal spring samples. UBIQUITOUS MICROORGANISMS The only genus observed in all 13 datasets was a heterotrophic, non-spore forming Gammaproteobacteria, Rheinheimera. The relative abundance of this genus was highly variable between ther- mal spring sites (maximum: 35% for Tshipise; minimum: 0.1% for Eiland) and only a trace component of subsurface samples (<0.1%). Isolated species of Rheinheimera have been found in marine and soil environments with a maximum growth tempera- ture of ∼40◦C (Brettar et al., 2006; Yoon et al., 2007; Zhang et al., 2008), making it surprising that Rheinheimera would dominate a warmer thermal spring site and not the other, cooler loca- tions. This suggests that the strain of Rheinheimera observed in Tshipise is adapted to higher temperatures than previously iso- lated species. Despite the low relative abundance of Rheinheimera in the subsurface samples, Rheinheimera has been identified in two other South African sites. One was an isolate from a water sample from the Transvaal dolomite chamber of Driefontein 4 shaft, Dr4IPC, (NCBI accession number DQ133435) and the other was from an earlier 16S rRNA gene clone library of Be326 (n = 3) (Borgonie et al., 2011), the same borehole that was sam- pled twice in this study. Due to the low relative abundance of www.frontiersin.org December 2014 | Volume 5 | Article 679 | 11
  • 12. Magnabosco et al. Subsurface and thermal water diversity FIGURE 6 | Sørensen similarity index in relation to geographical distance. The OTU0.03 Sørensen similarity index (y-axis) of subsurface sites is shown in relationship to the geographical distance between the two sites used to calculate the Sørensen index (x-axis). The V6 data used in this study is displayed as both the Sørensen indices of the total subsurface OTU0.03 dataset (V6 Data, red circle) and a rarefied OTU0.03 Sørensen Index (V6 Data*, blue square). The rarefied OTU0.03 Sørensen index was calculated by averaging the result of 100 iterations of subsampling the OTU0.03 community data table to 85% of the smallest sample. A third set of OTU0.03 Sørensen similarity indices and distances (Previous Data, green triangle) was calculated from previous South African subsurface studies (Takai et al., 2001; Moser et al., 2003, 2005; Kieft et al., 2005; Gihring et al., 2006; Lin et al., 2006a,b; Borgonie et al., 2011; Chehoud, 2011). Rheinheimera-related sequences in the subsurface V6 datasets and the fact that it is a mesophilic aerobic heterotroph, it is unlikely that Rheinheimera plays an important role in subsurface ecol- ogy. Instead, Rheinheimera is likely a product of either mining contamination or preserved extracellular DNA in the subsurface. Rheinheimera has been identified as a potential mining con- taminant as it was found in the service water of Evander mine (Davidson et al., 2011). Although no efforts have been made to identify extracellular DNA in the South African subsurface, the preservation of extracellular DNA in marine sediments has been well reported (Danovaro et al., 2005; Coolen and Overmann, 2007; Corinaldesi et al., 2008, 2011) and suggested to occur due to the adsorption of DNase onto sediment particles (Demanèche et al., 2001) as well as the adsorption of extracellular DNA onto mineral and organic particles under anoxic conditions (Coolen and Overmann, 2007). If similar processes are occurring in the terrestrial subsurface fracture water, then it will be difficult to elu- cidate the authenticity of low abundance genera like Rheinheimera based on V6 amplicon studies. Although not identified in the thermal springs, a member of the shared subsurface community that is worth mentioning is the sulfate reducing bacterium Ca. Desulforudis. This firmi- cute was found within all subsurface sites sampled and appears to be an important member of the subsurface community. In 2008, Ca. Desulforudis was identified as the sole member of a subsurface fracture community (Chivian et al., 2008) and, since then, Ca. Desulforudis has been identified in other South African subsurface studies (e.g., Davidson et al., 2011). Additionally, close relatives of Ca. Desulforudis have also been identified at other subsurface sites (Itävaara et al., 2011; Suzuki et al., 2013; Tiago and Veríssimo, 2013). Interestingly, despite the slight vari- ations in the partial 16S rRNA gene sequences reported for Ca. Desulforudis found in geographically dispersed fractures of the South African subsurface (Gihring et al., 2006; Chivian et al., 2008; Davidson et al., 2011), these sequences yield only one oligotype of Ca. Desulforudis V6. The variation in 16S rRNA gene of South African Ca. Desulforudis was found largely within the V3-5 hypervariable regions, not in the V6. Such conserva- tion of the V6 is uncommon; other bacterial species, such as those relating to Dehalogenimonas (Figure 4C), occur as a vari- ety of strains and oligotypes. It is unclear why the V6 region of Ca. Desulforudis is well conserved while the V3-5 is not. However, conservation of the Ca. Desulforudis genome has been reported previously, as only 32 single nucleotide polymorphisms were identified in the Ca. Desulforudis metagenome (Chivian et al., 2008). With such conservation of Ca. Desulforudis’s 16S rRNA gene in the South African subsurface, it will be inter- esting to determine how conserved the whole genomes of Ca. Desulforudis are across sites in the subsurface of South Africa. INCREASED OCCURRENCE OF RARE GENERA IN THE SUBSURFACE In the subsurface, the identification of low abundance genera like Rheinheimera has increased the alpha diversity beyond what had been reported previously. A similar increase in alpha diversity with V6 sequencing was reported by Sogin et al. (2006) and was attributed to the successful observation of low-abundance organ- isms that comprise the “rare biosphere.” However, the authentic- ity of this “rare biosphere” has been debated as the propagation of sequencing error may have greatly increased the apparent diversity (Reeder and Knight, 2009). In the case of the sub- surface samples reported here, sequencing error has already been accounted for through the use of the 100% overlap filter. However, as exhibited by the oligotyping of Ca. Desulforudis- related sequences, there is a large amount of noise surround- ing “authentic” V6 sequences that is most likely derived from PCR error (Eren et al., 2013b). This PCR noise is so large that the single-linkage preclustering and subsequent average link- age clustering of pairwise aligned sequences (SLP-PWAL) strat- egy proposed by Huse et al. (2010) did not effectively reduce the number of OTUs. Based on these results, it is conceivable that other artificial sequences may have been generated during PCR and, falsely, increased the alpha diversity of the subsurface sites. DISPERSION OF SUBSURFACE POPULATIONS Aside from identifying a large number of rare sequences, we also observe over 200 ubiquitous subsurface genera. This degree of overlap in South African subsurface communities has not been previously observed. To illustrate this, we compared the OTU0.03 Sørensen similarity index for all pairs of datasets gen- erated in the South African subsurface and compared them with the OTU0.03 Sørensen indices of this study (Figure 6). When these Sørensen similarity indices were plotted against the dis- tance between the pair of sites being compared, our V6 dataset maintains a steady Sørensen similarity index (0.59–0.69) across Frontiers in Microbiology | Extreme Microbiology December 2014 | Volume 5 | Article 679 | 12
  • 13. Magnabosco et al. Subsurface and thermal water diversity geographical distance while the historical data shows a decay in Sørensen similarity index values with distance (Chehoud, 2011). Accepting that the level of similarity as defined by our OTU0.03-based Sørensen similarity indices (0.59–0.69) is not an artifact of methodology, then the lack of an obvious distance- decay relationship across hundreds of kilometers (and kilometers vertically) is challenging to explain. Further complicating, is the fact that the ubiquitous subsur- face genera, individually, represent a very small proportion of the planktonic community and would not be expected to travel far. In a field transport experiment performed using bacterial strains selected for their adhesion deficiency, the concentration of the bacteria in the water diminished by an order of magnitude across a distance of 7 m (Mailloux, 2003). It is difficult to imagine how a minority population immersed in fracture water at low concen- trations (∼10 cells/mL) could maintain that concentration over a 500 km distance. Even more challenging is the fact that the iso- topic compositions of the fracture water from Dr5IPC, TT109 and NO14 are distinct from those of Be326, MM5 and FI88 (Lau et al., 2014) indicating that the fracture waters have not mixed with each other. In order for the same taxon to be present in isotopically dis- tinct fracture water, it would have to be motile and moving more rapidly than the groundwater flow velocities. The high proportion of shared genera, therefore, implies that shared microorganisms have to be capable of high dispersal through a wide range of subsurface environments. Alternatively, should these ubiquitous subsurface genera of low abundance represent the sessile commu- nity that were sloughed off the rock surface by the water current during sampling, the sessile communities are highly homogenous in the subsurface. Although many of the organisms are shared across subsur- face sites, weighted Unifrac significance tests, which take into account the relative abundance of individual phylotypes, showed that all sites are significantly different from one another. This is consistent with the subsurface microbial communities exploit- ing niches and forming spatially distinctive communities similar to those observed in thermal springs. These changes in the rela- tive abundance of various microorganisms are likely to be tied to the differences in geochemistry or geographic distance. Fuhrman and Steele (2008) and Brazelton et al. (2013) have both reported on the succession of microbes within changing environments through the community sequencing of a time series dataset. As in Brazelton et al. (2013), a pair-wise Pearson correlation analysis between observed subsurface phyla and environmen- tal factors was performed. Although we did not identify any significant correlations between pairwise-comparisons of individ- ual phyla and individual environmental parameters, a Euclidean distance matrix constructed from the scaled values of surface elevation, pH, TDS and the concentration of O2, Ca+, DIC, CH4, and Cl− was highly correlated (R2 = 0.83) to the subsur- face Morisita dissimilarity matrix reported in Figure 5D. The geographical distance matrix did not correlate as well with the subsurface Morisita dissimilarity matrix (R2 = 0.12). Notably, the Dr5IPC and TT109 microbial communities, separated by 4 km, are more similar to each other (MDI: 0.15) than others yet the microbial communities of NO14 and MM519540, sepa- rated by 330 km, are the most similar pair of sites in subsurface dataset (MDI: 0.04). A similar result is observed in the Limpopo thermal springs where the geographical distance matrix was even less correlated to the Morisita dissimilarity matrix (R2 = 0.03). These results suggest that geochemistry, rather distance, is the most important factor in shaping a subsurface microbial community. COMMENTS ON EXPERIMENTAL DESIGN As our results are entirely based on the analysis of high- throughput sequence data, there are several technical variables that should not be dismissed when evaluating whether or not thermal springs should be used as windows to the subsurface. Firstly, it has been well reported that different primer sets and sequencing technologies result in different taxonomic profiles (Liu et al., 2008; Petrosino et al., 2009; Kumar et al., 2011) and, unfortunately, due to the difficulty in coordinating research in these exotic locations, the same primers and sequencing plat- form for thermal spring and subsurface datasets were not applied. Additionally, archaea were not included in this current study and, although we have no reason to expect that the majority of the overlap between thermal spring and subsurface communities is within this domain, it is a possibility that we cannot exclude. Furthermore, the volume filtered from the thermal spring (2L) is 3 orders of magnitude less than that filtered from the subsur- face sites, 2,850–223,118 L (Table 1) and the pore sizes of the filters were different. Although the spatial beta diversity of the subsurface has not been well characterized, such a large volume filtration can be assumed to minimize the local effects that may be reflected in the thermal spring dataset. This community “homog- enization” may explain why there are higher levels of similarity between subsurface sites when compared to the thermal spring datasets. In addition to the increased volume of sample, subsurface datasets contained over 14,000 reads per site, whereas thermal spring datasets had, at most, 794 reads per site. The increase in number of reads collected corresponds to higher percentage of observed genera relative to the expected number of genera to be discovered (based on Chao1 estimates). It is important to note that when using the Sørensen similarity index as a measure of similarity between sites, sequencing depth is very important. In this study, we generated over 1,000 times more reads than pre- viously collected in the subsurface. As a result of this increased sequencing, we observed higher Sørensen indices than previously reported (Gihring et al., 2006; Chehoud, 2011) (Figure 6). These results suggest that there is a much greater similarity among South African subsurface communities than previously consid- ered (Section Dispersion of Subsurface Populations). Under sam- pling is likely to have contributed to variability among sites as, prior to this study, the subsurface 16S rRNA gene studies obtained sequences through the generation of a clonal library followed by a selection of clones for downstream Sanger sequencing. MacLean et al. (2007) performed a diversity study on an anaerobic biofilm collected from a South African mine, Evander using, in parallel, cloning and a high throughput PhyloChip. The latter identified over 25 times more species (1,596) than what was observed in the clone library and over 15 times more than the derived Chao1 esti- mate. With this large number of observed species (far exceeding www.frontiersin.org December 2014 | Volume 5 | Article 679 | 13
  • 14. Magnabosco et al. Subsurface and thermal water diversity the Chao1 estimate), it is unlikely that any of the clone library’s singleton OTUs would be observed if a replicate was performed. Therefore, it is unsurprising that with an increased sequencing depth we observe a higher percentage of shared taxa between the subsurface communities. Similar sampling effects may have contributed to the low lev- els of similarity between the thermal springs sampled (Figure 5). All thermal spring samples were dominated by one genus and contained a high percentage of singleton genera (Supplement Figure 9). Using the Chao1 as an estimate of the actual num- ber genera at each spring, we find that the datasets of all springs are between 47 and 68% complete (Table 3). As shared taxa are likely to persist in the low abundance taxa, an increase in sequenc- ing depth may be needed to reveal the true degree of relatedness between sites. Although these caveats in experimental design may amplify the differences between observed thermal spring and subsurface com- munities, it is important to note that in a study of Death Valley springs and their groundwater source, 21,794 partial 16S rRNA sequences were generated through pyrotagging and showed abso- lutely no overlap of the archaeal and bacterial communities in deep groundwater and surficial springs (Thomas et al., 2013). The lack of consensus between springs and the water that feeds them, as reported by Thomas et al. (2013) and this study highlight the fact that we do not fully understand how microbial communities develop in the transition between surface spring and subsurface waters. CONCLUSIONS The lack of overlap in the microbial communities observed between the Limpopo thermal springs and South African subsur- face sites, despite their physical-chemical similarities, suggest that thermal springs arising from gravity-driven meteoric water flow may not provide the clearest windows to the terrestrial subsurface. The geographic distance between the thermal springs and the subsurface sites and the fact that four of the springs occur within the Karoo Supergroup, where no subsurface samples have been studied, may account for this lack of sequence overlap. However, despite a geographic separation of up to 500 km and a vertical distribution of 1.0 to 3.1 km, the subsurface sites sampled in this study all shared 220 genera and 1,410 V6 sequences. Based on the ubiquity of this core subsurface set of microorganisms, we would expect that the subsurface communities surrounding the Limpopo thermal springs would also contain several of these pervasive subsurface genera. The differences in the geographical location of the sam- pling sites, the region of the 16S rRNA gene, and sequencing depth generated from these two environments may have played a role in minimal overlap observed between thermal spring and subsurface communities. Future work should be performed to confirm or reject the low similarity through parallel (same region, same number of reads, replicates) amplicon studies in the subsurface and thermal springs. By sequencing deeper, more shared organisms are likely to be illuminated. To determine the extent of microbial mixing between rising thermal spring water and local descending meteoric water, these investigations should be combined with intensive geochemical and isotopic measurements of the thermal springs. Wherever possible, deep wells and mines located in thermal spring regions should be studied in parallel. Only by doing this will we be able to decid- edly confirm whether or not thermal springs and the microbial communities they contain provide portals into the subsurface biosphere. ACKNOWLEDGMENTS For this study we would like to thank Gold Fields Ltd., Sibanye Gold Ltd., Harmony Gold Co. Mining Ltd., Petra Diamonds and AngloGold Ashanti Ltd., South Africa and the management and staff of Beatrix, Driefontein, Masimong, Finsch, Zondereinde platinum mine and Tau Tona mines for providing access and assistance during sampling of their subsurface fractures. We give credits to S. Maphanga of Beatrix gold mine, H. van Niekerk of Driefontein gold mine, S. Sparks of Fincsh diamond mine, O. Muthelo, L. Joubert and J. Ackermann of Masimong gold mine, and F. Vermeulen, M. Pienaar and A. Munro of Tau Tona gold mine. We thank B. Pfeiffer, C. Simon, M. Lindsay, L. Li, K. Wilkie, D. Simkus, L. Snyder, J.-G. Vermeulen, A. M. Meyer, M. Maleke, T. Tlalajoe, V. Mescheryakov, and S. Hendrickson for their assistance in the collection, preservation and field analyses the fracture water samples. Subsurface research was funded by the National Geographic Society and National Science Foundation (NSF). NSF funding was provided to Thomas L. Kieft (EAR- 0948335), Tullis C. Onstott (EAR-0948659), and C. Magnabosco (DGE-1148900). Any opinion, findings, and conclusions or rec- ommendations expressed in this material are those of the authors and do not necessarily reflect the views of the National Science Foundation. V6 sequencing was funded by the Deep Carbon Observatory’s Census of Deep Life supported by the Alfred P. Sloan Foundation. Sequencing was performed at the Marine Biological Laboratory (MBL, Woods Hole, MA, USA) and we thank the assistance of M. Sogin, S. Huse, J. Vineis, A. Voorhis, A. M. Eren, S. Grim, and H. Morrison of MBL. Thermal spring research was supported through a grant from Water Research Commission (WRC, SA, Project K5/1959/1). The authors thank Inqaba Biotechnology and Agriculture Research Centre (ARC) for their assistance with the analysis of the samples. Dr I. Rampedi, Mr E. Tshibalo and the rest of the Hot Water Spring (HWS) team members are acknowledged for their involvement and support during field trips. SUPPLEMENTARY MATERIAL The Supplementary Material for this article can be found online at: http://www.frontiersin.org/journal/10.3389/fmicb. 2014.00679/abstract. Sequences for the subsurface study have been made available on http://www.ncbi.nlm.nih.gov/, Bio Project ID PRJNA263371. The Limpopo thermal spring sequences are included in the attached .zip file. REFERENCES Barnes, I., Lamarche, V. C., and Himmelberg, G. (1967). Geochemical evi- dence of present-day serpentinization. Science 156, 830–832. doi: 10.1126/sci- ence.156.3776.830 Barnes, I., O’Neil, J., and Trescases, J. (1978). Present day serpentinization in New Caledonia, Oman and Yugoslavia. Geochim. Cosmochim. Acta 42, 144–145. Frontiers in Microbiology | Extreme Microbiology December 2014 | Volume 5 | Article 679 | 14
  • 15. Magnabosco et al. Subsurface and thermal water diversity Borgonie, G., García-Moyano, A., Litthauer, D., Bert, W., Bester, A., van Heerden, E., et al. (2011). Nematoda from the terrestrial deep subsurface of South Africa. Nature 474, 79–82. doi: 10.1038/nature09974 Brazelton, W. J., Morrill, P. L., Szponar, N., and Schrenk, M. O. (2013). Bacterial communities associated with subsurface geochemical processes in continental serpentinite springs. Appl. Environ. Microbiol. 79, 3906–3916. doi: 10.1128/AEM.00330-13 Brazelton, W. J., Nelson, B., and Schrenk, M. O. (2012). Metagenomic evi- dence for h(2) oxidation and h(2) production by serpentinite-hosted subsur- face microbial communities. Front. Microbiol. 2:268. doi: 10.3389/fmicb.2011. 00268 Brettar, I., Christen, R., and Höfle, M. G. (2006). Rheinheimera perlucida sp. nov., a marine bacterium of the Gammaproteobacteria isolated from surface water of the central Baltic Sea. Int. J. Syst. Evol. Microbiol. 56, 2177–2183. doi: 10.1099/ijs.0.64172-0 Brock, T. D., and Brock, M. L. (1969). Recovery of a hot spring community from a catastrophe. J. Phycol. 5, 75–77. doi: 10.1111/j.1529-8817.1969.tb02580.x Chao, A. (1984). Nonparametric estimation of the number of classes in a popula- tion. Scan. J. Statist. 11, 265–270. Chehoud, C. (2011). Exploring Microbial Diversity in the Deep Subsurface of the Witwatersrand Basin, South Africa (Undergraduate Thesis). Retrieved from DataSpace at Princeton University, Princeton, NJ. Available online at: http://arks.princeton.edu/ark:/88435/dsp01mp48sf69r Chivian, D., Brodie, E. L., Alm, E. J., Culley, D. E., Dehal, P. S., DeSantis, T. Z., et al. (2008). Environmental genomics reveals a single-species ecosystem deep within Earth. Science 322, 275–278. doi: 10.1126/science.1155495 Cole, J. R., Wang, Q., Fish, J. A., Chai, B., McGarrell, D. M., Sun, Y., et al. (2014). Ribosomal database project: data and tools for high throughput rRNA analysis. Nucleic Acids Res. 42, 1–10. doi: 10.1093/nar/gkt1244 Coolen, M. J. L., and Overmann, J. (2007). 217 000-year-old DNA sequences of green sulfur bacteria in Mediterranean sapropels and their implications for the reconstruction of the paleoenvironment. Environ. Microbiol. 9, 238–249. doi: 10.1111/j.1462-2920.2006.01134.x Corinaldesi, C., Barucca, M., Luna, G. M., and Dell’Anno, A. (2011). Preservation, origin and genetic imprint of extracellular DNA in permanently anoxic deep-sea sediments. Mol. Ecol. 20, 642–654. doi: 10.1111/j.1365-294X.2010.04958.x Corinaldesi, C., Beolchini, F., and Dell’Anno, A. (2008). Damage and degrada- tion rates of extracellular DNA in marine sediments: implications for the preservation of gene sequences. Mol. Ecol. 17, 3939–3951. doi: 10.1111/j.1365- 294X.2008.03880.x Dabney, A., Storey, J. D., and Warnes, G. R. (2010). qvalue: Q-value estimation for false discovery rate control. R package version 1.24.20. Danovaro, R., Corinaldesi, C., Dell’Anno, A., Fabiano, M., and Corselli, C. (2005). Viruses, prokaryotes and DNA in the sediments of a deep-hypersaline anoxic basin (DHAB) of the Mediterranean Sea. Environ. Microbiol. 7, 586–592. doi: 10.1111/j.1462-2920.2005.00727.x Davidson, M. M., Silver, B. J., Onstott, T. C., Moser, D. P., Gihring, T. M., Pratt, L. M., et al. (2011). Capture of planktonic microbial diversity in fractures by long-term monitoring of flowing boreholes, Evander Basin, South Africa. Geomicrobiol. J. 28, 275–300. doi: 10.1080/01490451.2010.499928 Demanèche, S., Jocteur-Monrozier, L., Quiquampoix, H., and Simonet, P. (2001). Evaluation of biological and physical protection against nuclease degrada- tion of clay-bound plasmid DNA. Appl. Environ. Microbiol. 67, 293–299. doi: 10.1128/AEM.67.1.293-299.2001 Deming, J. W., and Baross, J. A. (1993). Deep-sea smokers: windows to a subsur- face biosphere? Geochim. Cosmochim. Acta 57, 3219–3230. doi: 10.1016/0016- 7037(93)90535-5 DeSantis, T. Z., Brodie, E. L., Moberg, J. P., Zubieta, I. X., Piceno, Y. M., and Andersen, G. L. (2007). High-density universal 16S rRNA microar- ray analysis reveals broader diversity than typical clone library when sam- pling the environment. Microb. Ecol. 53, 371–383. doi: 10.1007/s00248-006- 9134-9 DeSantis, T. Z., Hugenholtz, P., Larsen, N., Rojas, M., Brodie, E. L., Keller, K., et al. (2006). Greengenes, a chimera-checked 16S rRNA gene database and workbench compatible with ARB. Appl. Environ. Microbiol. 72, 5069–5072. doi: 10.1128/AEM.03006-05 Dhansay, T., de Wit, M., and Patt, A. (2014). An evaluation for harnessing low- enthalpy geothermal energy in the Limpopo Province, South Africa. S. Afr. J. Sci. 110, 1–10. doi: 10.1590/sajs.2014/20130282 Dowd, S. E., Wolcott, R. D., Sun, Y., McKeehan, T., Smith, E., and Rhoads, D. (2008). Polymicrobial nature of chronic diabetic foot ulcer biofilm infections determined using bacterial tag encoded FLX amplicon pyrosequencing (bTEFAP). PLoS ONE 3:e3326. doi: 10.1371/journal.pone. 0003326 Edgar, R. C. (2010). Search and clustering orders of magnitude faster than BLAST. Bioinformatics 26, 2460–2461. doi: 10.1093/bioinformatics/btq461 Edgar, R. C., Haas, B. J., Clemente, J. C., Quince, C., and Knight, R. (2011). UCHIME improves sensitivity and speed of chimera detection. Bioinformatics 27, 2194–2200. doi: 10.1093/bioinformatics/btr381 Eren, A. M., Maignien, L., Sul, W. J., Murphy, L. G., Grim, S. L., Morrison, H. G., et al. (2013a). Oligotyping: differentiating between closely related microbial taxa using 16S rRNA gene data. Methods Ecol. Evol. 4, 1111–1119. doi: 10.1111/2041- 210X.12114 Eren, A. M., Vineis, J. H., Morrison, H. G., and Sogin, M. L. (2013b). A filter- ing method to generate high quality short reads using illumina paired-end technology. PLoS ONE 8:e66643. doi: 10.1371/journal.pone.0066643 Ferris, M. J., Nold, S. C., Revsbech, N. P., and Ward, D. M. (1997). Population struc- ture and physiological changes within a hot spring microbial mat community following disturbance. Appl. Environ. Microbiol. 63, 1367–1374. Fouke, B. W., Bonheyo, G. T., Sanzenbacher, B., and Frias-Lopez, J. (2003). Partitioning of bacterial communities between travertine depositional facies at Mammoth Hot Springs, Yellowstone National Park, U.S.A. Can. J. Earth Sci. 40, 1531–1548. doi: 10.1139/e03-067 Fuhrman, J., and Steele, J. (2008). Community structure of marine bacterioplank- ton: patterns, networks, and relationships to function. Aquat. Microb. Ecol. 53, 69–81. doi: 10.3354/ame01222 Gihring, T. M., Moser, D. P., Lin, L.-H., Davidson, M., Onstott, T. C., Morgan, L., et al. (2006). The distribution of microbial taxa in the subsurface water of the kalahari shield, South Africa. Geomicrobiol. J. 23, 415–430. doi: 10.1080/01490450600875696 Grasby, S. E., and Hutcheon, I. (2001). Controls on the distribution of thermal springs in the southern Canadian Cordillera. Can. J. Earth Sci. 38, 427–440. doi: 10.1139/e00-091 Hosgörmez, H. (2007). Origin of the natural gas seep of Çirali (Chimera), Turkey: site of the first Olympic fire. J. Asian Earth Sci. 30, 131–141. doi: 10.1016/j.jseaes.2006.08.002 Huse, S. M., Dethlefsen, L., Huber, J. A., Welch, D. M., Relman, D. A., and Sogin, M. L. (2008). Exploring microbial diversity and taxonomy using SSU rRNA hypervariable tag sequencing. PLoS Genet. 4:e1000255. doi: 10.1371/jour- nal.pgen.1000255 Huse, S. M., Welch, D. M., Morrison, H. G., and Sogin, M. L. (2010). Ironing out the wrinkles in the rare biosphere through improved OTU clustering. Environ. Microbiol. 12, 1889–1898. doi: 10.1111/j.1462-2920.2010.02193.x Itävaara, M., Nyyssönen, M., Kapanen, A., Nousiainen, A., Ahonen, L., and Kukkonen, I. (2011). Characterization of bacterial diversity to a depth of 1500 m in the Outokumpu deep borehole, Fennoscandian Shield. FEMS Microbiol. Ecol. 77, 295–309. doi: 10.1111/j.1574-6941.2011.01111.x Jonker, C. Z., van Ginkel, C., and Olivier, J. (2013). Association between physi- cal and geochemical characteristics of thermal springs and algal diversity in Limpopo Province, South Africa. Water SA. 39, 95–104. doi: 10.4313/wsa. v39i1.10 Kieft, T. L., McCuddy, S. M., Onstott, T. C., Davidson, M., Lin, L.-H., Mislowack, B., et al. (2005). Geochemically Generated, Energy-Rich Substrates and Indigenous Microorganisms in Deep, Ancient Groundwater. Geomicrobiol. J. 22, 325–335. doi: 10.1080/01490450500184876 Kumar, P. S., Brooker, M. R., Dowd, S. E., and Camerlengo, T. (2011). Target region selection is a critical determinant of community fingerprints generated by 16S Pyrosequencing. PLoS ONE 6:e20956. doi: 10.1371/journal.pone.0020956 Langmead, B., Trapnell, C., Pop, M., and Salzberg, S. L. (2009). Ultrafast and memory-efficient alignment of short DNA sequences to the human genome. Genome Biol. 10:R25. doi: 10.1186/gb-2009-10-3-r25 Lau, M. C. Y., Cameron, C., Magnabosco, C., Brown, C. T., Schilkey, F., Grim, S. L., et al. (2014). Phylogeny and phylogeography of functional genes shared among seven terrestrial subsurface metagenomes reveal N-cycling and microbial evolutionary relationships. Front. Microbiol. 5:531. doi: 10.3389/fmicb.2014. 00531 Lin, L.-H., Hall, J., Onstott, T. C., Gihring, T., Lollar, B. S., Boice, E., et al. (2006a). Planktonic microbial communities associated with fracture-derived www.frontiersin.org December 2014 | Volume 5 | Article 679 | 15
  • 16. Magnabosco et al. Subsurface and thermal water diversity groundwater in a deep gold mine of South Africa. Geomicrobiol. J. 23, 475–497. doi: 10.1080/01490450600875829 Lin, L.-H., Wang, P.-L., Rumble, D., Lippmann-Pipke, J., Boice, E., Pratt, L. M., et al. (2006b). Long-term sustainability of a high-energy, low-diversity crustal biome. Science 314, 479–482. doi: 10.1126/science.1127376 Liu, Z., Desantis, T. Z., Andersen, G. L., and Knight, R. (2008). Accurate taxonomy assignments from 16S rRNA sequences produced by highly parallel pyrosequencers. Nucleic Acids Res. 36:e120. doi: 10.1093/nar/ gkn491 Lollar, B. S., Lacrampe-Couloume, G., Voglesonger, K., Onstott, T. C., Pratt, L. M., and Slater, G. F. (2008). Isotopic signatures of CH4 and higher hydro- carbon gases from Precambrian Shield sites: a model for abiogenic poly- merization of hydrocarbons. Geochim. Cosmochim. Acta 72, 4778–4795. doi: 10.1016/j.gca.2008.07.004 Lozupone, C., and Knight, R. (2005). UniFrac: a new phylogenetic method for com- paring microbial communities. Appl. Environ. Microbiol. 71, 8228–8235. doi: 10.1128/AEM.71.12.8228-8235.2005 MacLean, L. C. W., Pray, T. J., Onstott, T. C., Brodie, E. L., Hazen, T. C., and Southam, G. (2007). Mineralogical, chemical and biological characterization of an anaerobic biofilm collected from a borehole in a deep gold mine in South Africa. Geomicrobiol. J. 24, 491–504. doi: 10.1080/01490450701572416 Mailloux, B. J. (2003). The role of physical, chemical, and microbial heterogene- ity on the field-scale transport and attachment of bacteria. Water Resour. Res. 39:1142. doi: 10.1029/2002WR001591 Marques, J. M., Carreira, P. M., Carvalho, M. R., Matias, M. J., Goff, F. E., Basto, M. J., et al. (2008). Origins of high pH mineral waters from ultramafic rocks, Central Portugal. Appl. Geochem. 23, 3278–3289. doi: 10.1016/j.apgeochem.2008.06.029 Meyer-Dombard, D. R., Swingley, W., Raymond, J., Havig, J., Shock, E. L., and Summons, R. E. (2011). Hydrothermal ecotones and streamer biofilm commu- nities in the Lower Geyser Basin, Yellowstone National Park. Environ. Microbiol. 13, 2216–2231. doi: 10.1111/j.1462-2920.2011.02476.x Morisita, M. (1959). Measuring of Interspecific association and similarity between communities. Mem. Fac. Sci. Kyushu Univ. Ser. E 3, 65–80. Morrill, P. L., Kuenen, J. G., Johnson, O. J., Suzuki, S., Rietze, A., Sessions, A. L., et al. (2013). Geochemistry and geobiology of a present-day serpentinization site in California: the Cedars. Geochim. Cosmochim. Acta 109, 222–240. doi: 10.1016/j.gca.2013.01.043 Moser, D. P., Gihring, T. M., Brockman, F. J., Fredrickson, J. K., Balkwill, D. L., Dollhopf, M. E., et al. (2005). Desulfotomaculum and Methanobacterium spp. dominate a 4- to 5-kilometer-deep fault. Appl. Environ. Microbiol. 71, 8773–8783. doi: 10.1128/AEM.71.12.8773-8783.2005 Moser, D. P., Onstott, T. C., Fredrickson, J. K., Brockman, F. J., Balkwill, D. L., Drake, G. R., et al. (2003). Temporal shifts in the geochemistry and micro- bial community structure of an ultradeep mine borehole following isolation. Geomicrobiol. J. 20, 517–548. doi: 10.1080/713851170 Oksanen, J., Blanchet, F. G., Kindt, R., Legendre, P., Minchin, P. R., O’Hara, R. B., et al. (2013). Package “vegan.” R Packag. ver. 2.0–8, 254. Olivier, J., van Niekerk, H. J., and van der Walt, I. J. (2008). Physical and chemical characteristics of thermal springs in the Waterberg area in Limpopo Province, South Africa. Water SA 34, 163–174. Olivier, J., Venter, J. S., and Jonker, C. Z. (2011). Thermal and chemical character- istics of hot water springs in the northern part of the Limpopo Province, South Africa. Water SA 37, 427–436. Onstott, T. C., Lin, L. H., Davidson, M., Mislowack, B., Borcsik, M., Hall, J., et al. (2006). The origin and age of biogeochemical trends in deep fracture water of the Witwatersrand Basin, South Africa. Geomicrobiol. J. 23, 369–414. doi: 10.1080/01490450600875688 Onstott, T. C., Moser, D. P., Pfiffner, S. M., Fredrickson, J. K., Brockman, F. J., Phelps, T. J., et al. (2003). Indigenous and contaminant microbes in ultra- deep mines. Environ. Microbiol. 5, 1168–1191. doi: 10.1046/j.1462-2920.2003. 00512.x Petrosino, J. F., Highlander, S., Luna, R. A., Gibbs, R. A., and Versalovic, J. (2009). Metagenomic pyrosequencing and microbial identification. Clin. Chem. 55, 856–866. doi: 10.1373/clinchem.2008.107565 Pielou, E. C. (1967). The measurement of diversity in different types of biological collections. J. Theor. Biol. 15, 177. doi: 10.1016/0022-5193(67)90048-3 Press, F., and Siever, R. (1986). Earth. 4th Edn. New York, NY: WH Freeman and Co. Price, M. N., Dehal, P. S., and Arkin, A. P. (2009). Fasttree: computing large mini- mum evolution trees with profiles instead of a distance matrix. Mol. Biol. Evol. 26, 1641–1650. doi: 10.1093/molbev/msp077 Reeder, J., and Knight, R. (2009). The “rare biosphere”: a reality check. Nat. Methods 6, 636–637. doi: 10.1038/nmeth0909-636 Rizopoulos, D. (2006). ltm: an R package for latent variable modeling and item response theory analyses. J. Stat. Softw. 17, 1–25. Schloss, P. D., Westcott, S. L., Ryabin, T., Hall, J. R., Hartmann, M., Hollister, E. B., et al. (2009). Introducing mothur: open-source, platform-independent, community-supported software for describing and comparing microbial communities. Appl. Environ. Microbiol. 75, 7537–7541. doi: 10.1128/AEM. 01541-09 Schrenk, M. O., Huber, J. A., and Edwards, K. J. (2010). Microbial provinces in the subseafloor. Ann. Rev. Mar. Sci. 2, 279–304. doi: 10.1146/annurev-marine- 120308-081000 Sogin, M. L., Morrison, H. G., Huber, J. A., Mark Welch, D., Huse, S. M., Neal, P. R., et al. (2006). Microbial diversity in the deep sea and the underex- plored “rare biosphere.” Proc. Natl. Acad. Sci. U.S.A. 103, 12115–12120. doi: 10.1073/pnas.0605127103 Sorensen, T. (1948). A method of establishing groups of equal amplitude in plant sociology based on similarity of species content. K. Danske Vidensk. Selsk. 5, 4–7. Sundquist, A., Bigdeli, S., Jalili, R., Druzin, M. L., Waller, S., Pullen, K. M., et al. (2007). Bacterial flora-typing with targeted, chip-based Pyrosequencing. BMC Microbiol. 7:108. doi: 10.1186/1471-2180-7-108 Suzuki, S., Ishii, S., Wu, A., Cheung, A., Tenney, A., Wanger, G., et al. (2013). Microbial diversity in The Cedars, an ultrabasic, ultrareducing, and low salinity serpentinizing ecosystem. Proc. Natl. Acad. Sci. U.S.A. 110, 15336–15341. doi: 10.1073/pnas.1302426110 Szponar, N., Brazelton, W. J., Schrenk, M. O., Bower, D. M., Steele, A., and Morrill, P. L. (2013). Geochemistry of a continental site of serpentinization, the tablelands ophiolite, gros morne national park: a Mars analogue. Icarus 224, 286–296. doi: 10.1016/j.icarus.2012.07.004 Takai, K., Moser, D. P., DeFlaun, M., Onstott, T. C., and Fredrickson, J. K. (2001). Archaeal diversity in waters from deep South African gold mines. Appl. Environ. Microbiol. 67, 5750–5760. doi: 10.1128/AEM.67.21.5750- 5760.2001 Tekere, M., Lötter, A., Olivier, J., Jonker, N., and Venter, S. (2011). Metagenomic analysis of bacterial diversity of Siloam hot water spring, Limpopo, South Africa. Afr. J. Biotechnol. 10, 18005–18012. doi: 10.5897/ AJB11.899 Tekere, M., Prinsloo, A., Olivier, J., Jonker, N., and Venter, S. (2012). An eval- uation of the bacterial diversity at Tshipise, Mphephu and Sagole hot water springs, Limpopo Province, South Africa. Afr. J. Microbiol. Res. 6, 4993–5004. doi: 10.5897/AJMR12.250 Thomas, J. M., Moser, D. P., Fisher, J. C., Reihle, J., Wheatley, A., Hershey, R. L., et al. (2013). Using water chemistry, isotopes and microbiology to evaluate groundwater sources, flow paths and geochemical reactions in the death valley flow system, USA. Procedia Earth Planet. Sci. 7, 842–845. doi: 10.1016/j.proeps.2013.03.033 Tiago, I., and Veríssimo, A. (2013). Microbial and functional diversity of a subter- restrial high pH groundwater associated to serpentinization. Environ. Microbiol. 15, 1687–1706. doi: 10.1111/1462-2920.12034 Todd, D. K. (1980). Groundwater Hydrology. 2nd Edn. New York, NY: Wiley. Wang, Q., Garrity, G. M., Tiedje, J. M., and Cole, J. R. (2007). Naive Bayesian clas- sifier for rapid assignment of rRNA sequences into the new bacterial taxonomy. Appl. Environ. Microbiol. 73, 5261–5267. doi: 10.1128/AEM.00062-07 Ward, D. M., Ferris, M. J., Nold, S. C., and Bateson, M. M. (1998). A natural view of microbial biodiversity within hot spring cyanobacterial mat communities. Microbiol. Mol. Biol. Rev. 62, 1353–1370. Whitman, W. B., Coleman, D. C., and Wiebe, W. J. (1998). Prokaryotes: the unseen majority. Proc. Natl. Acad. Sci. U.S.A. 95, 6578–6583. doi: 10.1073/pnas.95.12.6578 Wolda, H. (1981). Similarity indices, sample size and diversity. Oecologia 50, 296–302. doi: 10.1007/BF00344966 Yoon, J.-H., Bae, S. E., Kang, S.-J., and Oh, T.-K. (2007). Rheinheimera aquimaris sp. nov., isolated from seawater of the East Sea in Korea. Int. J. Syst. Evol. Microbiol. 57, 1386–1390. doi: 10.1099/ijs.0.64898-0 Zhang, X., Sun, L., Qiu, F., McLean, R. J. C., Jiang, R., and Song, W. (2008). Rheinheimera tangshanensis sp. nov., a rice root-associated Frontiers in Microbiology | Extreme Microbiology December 2014 | Volume 5 | Article 679 | 16
  • 17. Magnabosco et al. Subsurface and thermal water diversity bacterium. Int. J. Syst. Evol. Microbiol. 58, 2420–2424. doi: 10.1099/ijs.0. 65605-0 Conflict of Interest Statement: The authors declare that the research was con- ducted in the absence of any commercial or financial relationships that could be construed as a potential conflict of interest. Received: 10 August 2014; accepted: 20 November 2014; published online: 17 December 2014. Citation: Magnabosco C, Tekere M, Lau MCY, Linage B, Kuloyo O, Erasmus M, Cason E, van Heerden E, Borgonie G, Kieft TL, Olivier J and Onstott TC (2014) Comparisons of the composition and biogeographic distribution of the bacterial communities occupying South African thermal springs with those inhabiting deep subsurface fracture water. Front. Microbiol. 5:679. doi: 10.3389/fmicb.2014.00679 This article was submitted to Extreme Microbiology, a section of the journal Frontiers in Microbiology. Copyright © 2014 Magnabosco, Tekere, Lau, Linage, Kuloyo, Erasmus, Cason, van Heerden, Borgonie, Kieft, Olivier and Onstott. This is an open-access arti- cle distributed under the terms of the Creative Commons Attribution License (CC BY). The use, distribution or reproduction in other forums is permitted, pro- vided the original author(s) or licensor are credited and that the original pub- lication in this journal is cited, in accordance with accepted academic practice. No use, distribution or reproduction is permitted which does not comply with these terms. www.frontiersin.org December 2014 | Volume 5 | Article 679 | 17