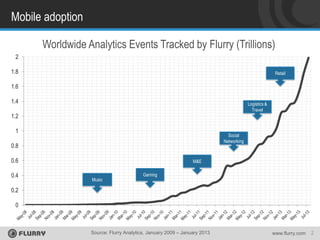
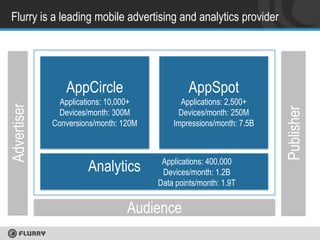
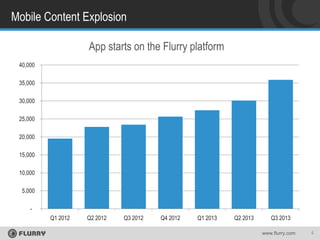
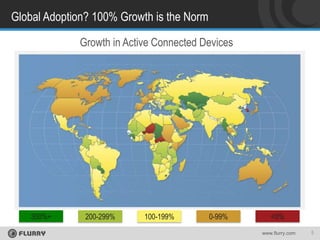
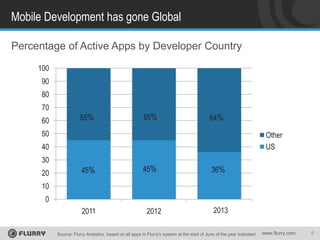
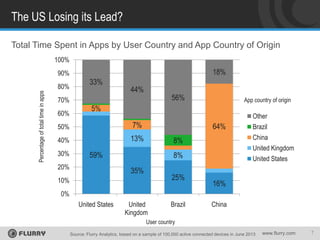
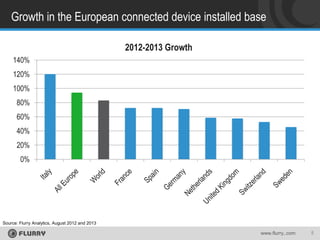
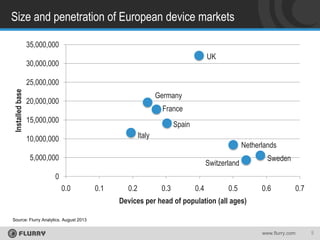
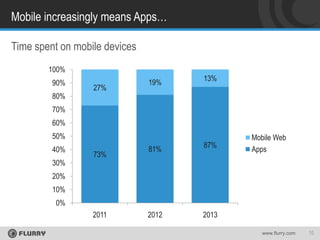
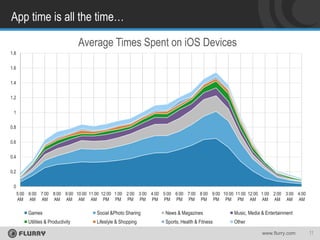
November 13, 2013

Do you know where your audience is?
Richard Firminger, GMEMEA

www.flurry.com
Mobile adoption
Worldwide Analytics Events Tracked by Flurry (Trillions)
2
1.8

Retail

1.6
1.4

Logistics &
Travel

1.2

1

Social
Networking

0.8
0.6
0.4

M&E

Music

Gaming

0.2
0

Source: Flurry Analytics, January 2009 – January 2013

www.flurry.com

2
Flurry is a leading mobile advertising and analytics provider

AppSpot

Applications: 10,000+
Devices/month: 300M
Conversions/month: 120M

Applications: 2,500+
Devices/month: 250M
Impressions/month: 7.5B

Analytics

Applications: 400,000
Devices/month: 1.2B
Data points/month: 1.9T

Audience

Publisher

Advertiser

AppCircle
Mobile Content Explosion
App starts on the Flurry platform
40,000

35,000
30,000
25,000
20,000

15,000
10,000
5,000
Q1 2012

Q2 2012

Q3 2012

Q4 2012

Q1 2013

Q2 2013

Q3 2013
www.flurry.com

4
Global Adoption? 100% Growth is the Norm
Growth in Active Connected Devices

300%+

200-299%

100-199%

0-99%

<0%
www.flurry.com

5
Mobile Development has gone Global
Percentage of Active Apps by Developer Country
100
90

80
70
60

55%

55%

64%

50

Other
US

40
30
20

45%

45%

36%

10
0
2011

2012

2013
1023

Source: Flurry Analytics, based on all apps in Flurry’s system at the start of June of the year indicated

www.flurry.com

6
The US Losing its Lead?
Total Time Spent in Apps by User Country and App Country of Origin
100%

18%

90%
Percentage of total time in apps

80%
70%
60%

33%

44%

56%

5%

Other

50%

7%

40%

13%

30%

App country of origin

64%
8%

59%

20%

8%
35%

25%

10%

Brazil
China
United Kingdom
United States

16%

0%
United States

United
Kingdom

Brazil

China

User country
Source: Flurry Analytics, based on a sample of 100,000 active connected devices in June 2013

www.flurry.com

7
Growth in the European connected device installed base
2012-2013 Growth
140%
120%

100%
80%
60%

40%
20%
0%

Source: Flurry Analytics, August 2012 and 2013

www.flurry,.com

8
Size and penetration of European device markets
35,000,000
UK

30,000,000

Installed base

25,000,000

Germany

20,000,000

France

15,000,000

Spain

Italy

10,000,000

Netherlands

5,000,000

Switzerland

Sweden

0
0.0

0.1

0.2

0.3

0.4

0.5

0.6

0.7

Devices per head of population (all ages)
Source: Flurry Analytics, August 2013

www.flurry.com

9
Mobile increasingly means Apps…
Time spent on mobile devices
100%
90%

80%

27%

19%

13%

70%
60%
50%
40%
30%

73%

81%

87%

2012

Mobile Web
Apps

2013

20%
10%

0%
2011

www.flurry.com

10
App time is all the time…
Average Times Spent on iOS Devices
1.8
1.6
1.4
1.2
1
0.8
0.6
0.4
0.2
0
5:00 6:00 7:00 8:00 9:00 10:00 11:00 12:00 1:00 2:00 3:00 4:00 5:00 6:00 7:00 8:00 9:00 10:00 11:00 12:00 1:00 2:00 3:00 4:00
AM AM AM AM AM AM AM PM PM PM PM PM PM PM PM PM PM PM PM AM AM AM AM AM

Games

Social &Photo Sharing

News & Magazines

Music, Media & Entertainment

Utilities & Productivity

Lifestyle & Shopping

Sports, Health & Fitness

Other
www.flurry.com

11
Where consumers go…dollars follow
Worldwide total ad spend as a % of digital spend
$173.12
$160.02

150

$146.38
$132.62

US $BN

$117.60

$104.04

100

All Digital
Mobile

$86.43

50

0

5%

9%

14%

20%

26%

31%

36%

2011

2012

2013

2014

2015

2016

2017

Source: eMarketer

www.flurry.com

12
November 2013

Thank you

www.flurry.com

Flurry - NOAH13 London

  • 1.
    November 13, 2013 Doyou know where your audience is? Richard Firminger, GMEMEA www.flurry.com
  • 2.
    Mobile adoption Worldwide AnalyticsEvents Tracked by Flurry (Trillions) 2 1.8 Retail 1.6 1.4 Logistics & Travel 1.2 1 Social Networking 0.8 0.6 0.4 M&E Music Gaming 0.2 0 Source: Flurry Analytics, January 2009 – January 2013 www.flurry.com 2
  • 3.
    Flurry is aleading mobile advertising and analytics provider AppSpot Applications: 10,000+ Devices/month: 300M Conversions/month: 120M Applications: 2,500+ Devices/month: 250M Impressions/month: 7.5B Analytics Applications: 400,000 Devices/month: 1.2B Data points/month: 1.9T Audience Publisher Advertiser AppCircle
  • 4.
    Mobile Content Explosion Appstarts on the Flurry platform 40,000 35,000 30,000 25,000 20,000 15,000 10,000 5,000 Q1 2012 Q2 2012 Q3 2012 Q4 2012 Q1 2013 Q2 2013 Q3 2013 www.flurry.com 4
  • 5.
    Global Adoption? 100%Growth is the Norm Growth in Active Connected Devices 300%+ 200-299% 100-199% 0-99% <0% www.flurry.com 5
  • 6.
    Mobile Development hasgone Global Percentage of Active Apps by Developer Country 100 90 80 70 60 55% 55% 64% 50 Other US 40 30 20 45% 45% 36% 10 0 2011 2012 2013 1023 Source: Flurry Analytics, based on all apps in Flurry’s system at the start of June of the year indicated www.flurry.com 6
  • 7.
    The US Losingits Lead? Total Time Spent in Apps by User Country and App Country of Origin 100% 18% 90% Percentage of total time in apps 80% 70% 60% 33% 44% 56% 5% Other 50% 7% 40% 13% 30% App country of origin 64% 8% 59% 20% 8% 35% 25% 10% Brazil China United Kingdom United States 16% 0% United States United Kingdom Brazil China User country Source: Flurry Analytics, based on a sample of 100,000 active connected devices in June 2013 www.flurry.com 7
  • 8.
    Growth in theEuropean connected device installed base 2012-2013 Growth 140% 120% 100% 80% 60% 40% 20% 0% Source: Flurry Analytics, August 2012 and 2013 www.flurry,.com 8
  • 9.
    Size and penetrationof European device markets 35,000,000 UK 30,000,000 Installed base 25,000,000 Germany 20,000,000 France 15,000,000 Spain Italy 10,000,000 Netherlands 5,000,000 Switzerland Sweden 0 0.0 0.1 0.2 0.3 0.4 0.5 0.6 0.7 Devices per head of population (all ages) Source: Flurry Analytics, August 2013 www.flurry.com 9
  • 10.
    Mobile increasingly meansApps… Time spent on mobile devices 100% 90% 80% 27% 19% 13% 70% 60% 50% 40% 30% 73% 81% 87% 2012 Mobile Web Apps 2013 20% 10% 0% 2011 www.flurry.com 10
  • 11.
    App time isall the time… Average Times Spent on iOS Devices 1.8 1.6 1.4 1.2 1 0.8 0.6 0.4 0.2 0 5:00 6:00 7:00 8:00 9:00 10:00 11:00 12:00 1:00 2:00 3:00 4:00 5:00 6:00 7:00 8:00 9:00 10:00 11:00 12:00 1:00 2:00 3:00 4:00 AM AM AM AM AM AM AM PM PM PM PM PM PM PM PM PM PM PM PM AM AM AM AM AM Games Social &Photo Sharing News & Magazines Music, Media & Entertainment Utilities & Productivity Lifestyle & Shopping Sports, Health & Fitness Other www.flurry.com 11
  • 12.
    Where consumers go…dollarsfollow Worldwide total ad spend as a % of digital spend $173.12 $160.02 150 $146.38 $132.62 US $BN $117.60 $104.04 100 All Digital Mobile $86.43 50 0 5% 9% 14% 20% 26% 31% 36% 2011 2012 2013 2014 2015 2016 2017 Source: eMarketer www.flurry.com 12
  • 13.

Editor's Notes

  • #2 We are known among the app industry as the leading analytics data provider, and the go to advertising partner if you want to build a better app audience or intelligently target consumers with brand advertising in apps. I’m going to share some insights with you today about how we see the targeting landscape improving in the mobile app industry. Before I share those insights, I just want to give you a little context on our data and Flurry’s role in the advertising industry.
  • #4 We have 3 main services: 1. Analytics, 2. A demand side platform – AppCircle and 3. A supply side platform – AppSpot. The analytics data is provided by our developers and their audience that uses their apps. That data drives our targeting capabilities for advertisers using AppCircle, which they use to build an app audience or run performance marketing campaigns for brands. That data also powers the AppSpot publishing platform that leading app developers and publishers use to optimize monetization through advertising.This just gives you a sense of the power of the data and how it is used across the two platforms. We have over a 120k companies using Analytics across 390k apps. Each month, we see over 1.2B devices and record 1.9T data points – a figure that has doubled since the beginning of the year. All that data, powers AppSpot which has exploded to reaching 250M devices since the beginning of the year when we took the service GAAnd, AppCircle which is reaching a number of monthly uniques that is on par with top comScore sites.
  • #11 So how does all this app consumption compare to mobile web? There’s no denying it; mobile means apps.Apps are the go to content experience for smart device owners. You can see here that the mobile web is not where the growth is coming from. In fact, over the last 2yrs, we have found that you’re average smart device users spends significantly more time in apps than the web period.
  • #14 Whether you’re a publisher, a DSP, a trading desk or an advertiser looking to more effectively target campaigns, let’s make sure we have a conversation about precision. Feel free to reach out to me…If you want to drill into some of these insights further, definitely check out our blog. Thanks for your time.