Downloaded 141 times

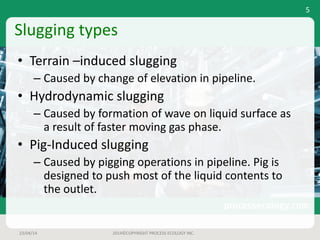

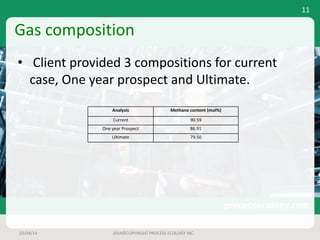

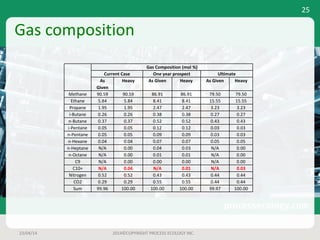

This document outlines a case study on estimating slug volume and duration in a natural gas pipeline, focusing on the impact of heavy fractions and different slugging types. Using various methodologies, including Aspen HYSYS hydraulic analysis, the project aimed to predict slug behavior based on gas composition and operating conditions. Sensitivity analysis indicated that the design size for a slug catcher should be conservative, potentially limiting vessel size to around 1,000 bbl.


