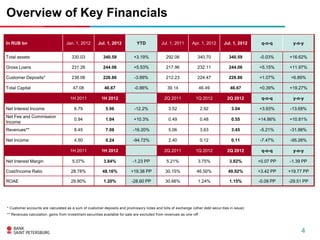
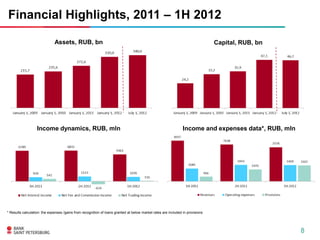
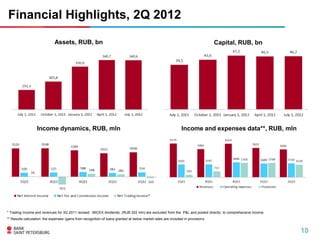
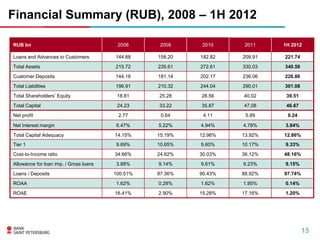
Bank Saint Petersburg reported its financial results for the first half of 2012. Some key highlights include:
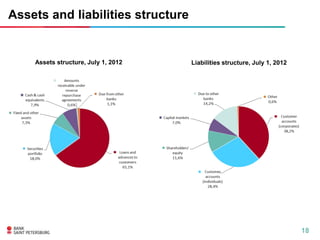
- Total assets increased 3.19% to RUB 340.59 billion as of July 1, 2012 compared to the beginning of the year.
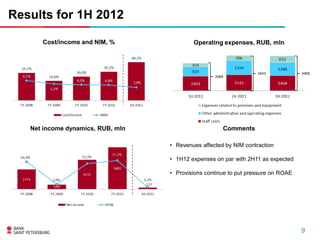
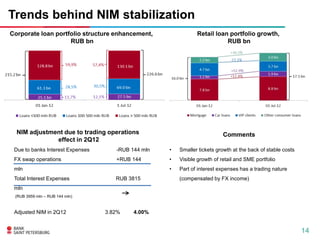
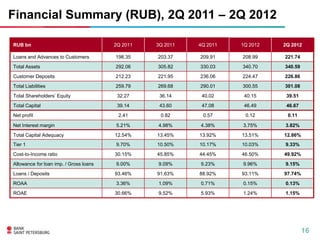
- Net income declined significantly to RUB 237 million for the first half of 2012 compared to RUB 4.5 billion for the same period last year, impacted by a contraction in net interest margin.
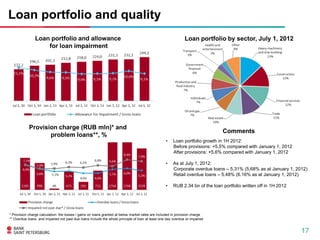
- The cost/income ratio increased to 48.16% for the first half of 2012 from 28.78% the previous year, reflecting higher provisions putting pressure on return on equity.
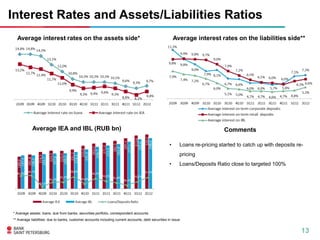
- Net interest income declined 12.2% year-over