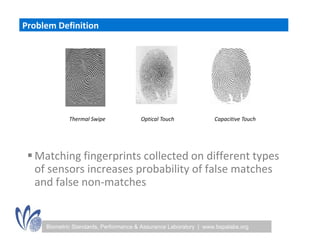
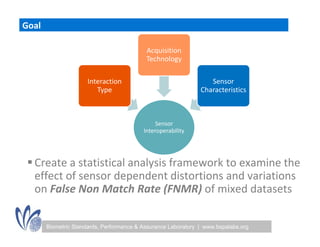
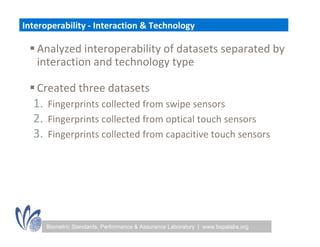
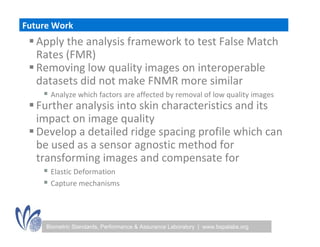
Online Research Seminar:
Fingerprint Sensor Interoperability Performance
                                                      Shimon K. Modi, Ph.D.
                                                      Shimon K Modi Ph D
                                            Director of Research, BSPA Labs


       Biometric Standards, Performance, and Assurance Laboratory | www.bspalabs.org
                                  Purdue University, Department of Industrial Technology
Agenda
  Problem statement & Goal
  Data collection protocol
  Results
 C l i
   Conclusions and Future work
                  d          k


    Biometric Standards, Performance & Assurance Laboratory | www.bspalabs.org
Problem Definition


             Thermal Swipe             Optical Touch              Capacitive Touch


  Matching fingerprints collected on different types 
   of sensors increases probability of false matches 
   of sensors increases probability of false matches
   and false non‐matches


     Biometric Standards, Performance & Assurance Laboratory | www.bspalabs.org
Goal

                                           Acquisition 
                                           Technology

                      Interaction                                 Sensor 
                         Type                                  Characteristics


                                               Sensor 
                                          Interoperability


  Create a statistical analysis framework to examine the 
   effect of sensor dependent distortions and variations 
   on False Non Match Rate (FNMR) of mixed datasets

       Biometric Standards, Performance & Assurance Laboratory | www.bspalabs.org
Sensor Description
 8 commercially available fingerprint sensors
  8 commercially available fingerprint sensors
     1 thermal swipe sensor
     1 capacitive  swipe sensor
    4O i l
      4 Optical touch sensors
                     h
     2 Capacitive touch sensors

 All sensors were 500 dpi resolution


     Biometric Standards, Performance & Assurance Laboratory | www.bspalabs.org
Data Collection Protocol


     Biometric Standards, Performance & Assurance Laboratory | www.bspalabs.org
Description of Participants

        Total                                            190
      Gender                          Male                               Female
                                      131                                   59
    Occupation                  Manual Laborer                        Office Worker
                                       17                                  173
    Age Groups               < 30 years          30‐50 years                > 50 years
                               156                   23                          11
    Handedness                Right                  Left                  Ambidextrous
                               164                   23                           3
      Ethnicity          Caucasian      Black   Hispanic       American 
                                                               American      Asian       Other
                                                                Indian
                             133            8       11            1              34       3


      Biometric Standards, Performance & Assurance Laboratory | www.bspalabs.org
Data Analysis Methodology
                • VeriFinger extractor
                • Descriptive Stats
  Minutiae 
   Count        • Test of similarity


                • NFIQ
                • Descriptive Stats
                  Descriptive Stats
   Image 
   Quality      • Test of Similarity


                • VeriFinger matcher
                • Native and mixed datasets
   FNMR 
   FNMR
   Matrix       • Test of proportions


      Biometric Standards, Performance & Assurance Laboratory | www.bspalabs.org
VeriFinger 5.0 Extractor Minutiae Count Analysis


                Dataset             n              M               SD

                   S1             1140            41.72           10.57

                   S2             1122            28.32           10.73

                   S3             1140            40.25           10.12

                   S4             1128            30.74            8.06

                   S5             1110            24.38            6.87

                   S6             1134            38.62            9.18

                   S7             1134            27.53            7.69

                   S8             1122            26.15            6.73


     Biometric Standards, Performance & Assurance Laboratory | www.bspalabs.org
Minutiae Count Analysis
  Minutiae count extracted using VeriFinger
                                g        g
  Overall Hypothesis:
   H10: µi minutiae_count = µ2 minutiae_count……..= µ8 minutiae_count
   H1A: µi minutiae_count ≠ µ2 minutiae_count……..≠ µ8 minutiae_count
      : µ                 ≠ µ                    ≠ µ

  Pairwise Comparisons:
   H1’0: µi minutiae_count = µj minutiae_count for all i ≠ j
   H1’A: µi minutiae_count ≠ µj minutiae_count for all i ≠ j

  Rejected null hypothesis H10
  All pairs statistically significant at α = 0.05
       p                 y g


      Biometric Standards, Performance & Assurance Laboratory | www.bspalabs.org
NFIQ Image Quality Analysis 


                 Dataset            N               M             Median

                   S1              1140            1.29              1

                   S2              1122            1.91              2

                   S3              1140            1.75              1

                   S4              1128            2.00              2

                   S5              1110            2.18              2

                   S6              1134            1.77              2

                   S7              1134            2.03              2

                   S8              1122            1.58              2


     Biometric Standards, Performance & Assurance Laboratory | www.bspalabs.org
Image Quality Analysis
  Image quality computed using NFIQ
      g q      y    p         g    Q
 Overall Hypothesis:
  H20: µi qscore = µ2 qscore……= µ9 qscore
      : µ        = µ             =µ
  H2 A: µi qscore ≠ µ2 qscore…..≠ µ9 qscore

 Pairwise Comparisons:
 Pairwise Comparisons:
   H2’0: µi qscore = µj qscore for all i ≠ j
   H2’A: µi qscore ≠ µj qscore for all i ≠ j

  NFIQ uses a 3‐layer feed forward nonlinear perceptron model 
   to predict the image quality values based on the input feature 
   vector of the fingerprint image 
   vector of the fingerprint image
  Performed a Kruskal Wallis Test of similarity of ranks


      Biometric Standards, Performance & Assurance Laboratory | www.bspalabs.org
Tukey’s HSD Pairwise Test


                D2           D3         D4        D5          D6         D7       D8
     D1          S            S          S          S          S          S       S
     D2                       S          S          S          S          S       S
     D3                                  S          S          S          S       S
     D4                                             S          S         NS       S
     D5                                                        S          S       S
     D6                                                                   S       S
     D7                                                                           S
                                S‐ Significant difference
                                 S Significant difference
                                NS – Not Significant
     Biometric Standards, Performance & Assurance Laboratory | www.bspalabs.org
False Non Match Rate (FNMR) Matrix Analysis


     Biometric Standards, Performance & Assurance Laboratory | www.bspalabs.org
FNMR Matrix – Fixed FMR 0.1%
                                                    TEST
                      D1        D2       D3      D4     D5          D6       D7      D8
             D1      0.47      6.79     5.60    4.44 5.61          31.03    11.30   3.76

             D2      7.33      5.05     6.49    7.44     10.92     16.18    10.83   6.11
        E
        N    D3      8.57      4.78     0.24    1.07     1.28      2.73      1.79   0.54
        R
        O    D4      5.10      4.44     0.95      0      1.39      1.60      1.83   1.08
        L
             D5
              5      5.56      7.64
                                .6      0.85    0.85     0. 8
                                                         0.78      4.42
                                                                    .        2.23
                                                                              . 3   0.
                                                                                    0.42

             D6     33.86     13.42     2.99    1.30     4.47      0.17      1.41   2.15

             D7     14.92      9.89     1.73    2.12     2.35      2.71      0.94   1.85

             D8      2.87      2.96     0.12    0.90     0.49      1.73      0.77   0.11


     Biometric Standards, Performance & Assurance Laboratory | www.bspalabs.org
Test of Homogeneity of Proportions
  FNMR Matrix is useful for numerical comparison
                                          p

  Test of Homogeneity of FNMR was performed 
   between native FNMR and mixed FNMR
   b          i            d i d

  Compare multiple proportions using Marascuillo
   Compare multiple proportions using Marascuillo
   Procedure


     Biometric Standards, Performance & Assurance Laboratory | www.bspalabs.org
Results

                   D1      D2        D3          D4        D5       D6      D7    D8

      D1                    S         S           S         S        S       S    S

      D2           NS                NS          NS         S        S       S    NS

      D3            S       S                    NS        NS        S       S    NS

      D4            S       S        NS                    NS        S       S    NS

      D5            S       S        NS          NS                  S      NS    NS

      D6            S       S         S          NS         S               NS    NS

      D7            S       S        NS          NS        NS       NS            NS

      D8            S       S        NS          NS        NS        S      NS

                                 S‐ Significant difference
                                  S Significant difference
                                 NS – Not Significant
     Biometric Standards, Performance & Assurance Laboratory | www.bspalabs.org
Impact of Quality on Interoperable FNMR
  Removal of low quality images will reduce FNMR 
                    q    y    g
   of native and interoperable datasets 
  But will it make the FNMR of mixed datasets 
   similar to FNMR of native datasets?
    i il              f   i d        ?

  FNMR matrix regenerated using VeriFinger 5 0 for
   FNMR matrix regenerated using VeriFinger 5.0 for 
   datasets comprised of images with NFIQ score of 
   1, 2, or 3 
  The test of homogeneity of proportions was rerun 
   on native and mixed dataset FNMR


     Biometric Standards, Performance & Assurance Laboratory | www.bspalabs.org
Results
                 D1      D2        D3          D4        D5       D6       D7     D8

     D1                   S         S           S         S        S        S     S

     D2          NS                NS          NS         S        S       NS     NS

     D3           S       S                    NS        NS        S        S     NS

     D4           S       S        NS                    NS        S        S     NS

     D5           S       S        NS          NS                  S       NS     NS

     D6           S       S         S           S         S                 S     S

     D7           S       S        NS          NS        NS       NS              NS

     D8           S       S        NS          NS        NS        S       NS


                               S Significant difference
                                S‐ Significant difference
                               NS – Not Significant
     Biometric Standards, Performance & Assurance Laboratory | www.bspalabs.org
Consistency of Placement
  Interaction with different sensors can lead to inconsistent placement 
   due to sensor design, interaction type, capture area
  Metric of consistency – detection of core
        Core detected in both images                                    Core detected in one image
       Samples from different sensors –                               Samples from different sensors –
              Correctly Verified                                            Incorrectly rejected


                                   Core detected in none of the images
                               Samples from same sensor – Correctly verified


     Biometric Standards, Performance & Assurance Laboratory | www.bspalabs.org
Consistency of Placement
  Interaction with different sensors can lead to 
   inconsistent placement due to sensor design, 
   interaction type, capture area
  Metric of consistency detection of core
   Metric of consistency – detection of core


                                                          D1,D6
                                                      D6,D1


     Biometric Standards, Performance & Assurance Laboratory | www.bspalabs.org
Interoperability ‐ Interaction & Technology 

 A l d i t
  Analyzed interoperability of datasets separated by 
                      bilit f d t t           t db
  interaction and technology type

  Created three datasets
  1.   Fingerprints collected from swipe sensors
          g p                         p
  2.   Fingerprints collected from optical touch sensors
  3.   Fingerprints collected from capacitive touch sensors
          g p                        p


       Biometric Standards, Performance & Assurance Laboratory | www.bspalabs.org
Interoperability ‐ Interaction & Technology 


                                                         TEST
                                        Swipe
                                           p            Optical  Capacitive 
                                                         p         p
                                                        Touch      Touch
         E             Swipe             4.81            11.75             6.58
         N
         R
         O            Optical           11.93             1.53             1.89
         L            Touch
                    Capacitive           4.76             1.47             0.45
                      Touch


      Biometric Standards, Performance & Assurance Laboratory | www.bspalabs.org
Conclusions
  No technology specific impact on similarity of 
               gy p          p               y
   minutiae count and quality score
  Image quality analysis reduced FNMR, but did not 
   increase similarity of FNMR
   i         i il i     f
  Consistency of placement improved performance 
   of mixed datasets
   of mixed datasets
  Data collected from same interaction type had 
   lower FNMR


     Biometric Standards, Performance & Assurance Laboratory | www.bspalabs.org
Future Work
  Apply the analysis framework to test False Match 
     pp y        y
   Rates (FMR)
  Removing low quality images on interoperable 
   datasets did not make FNMR more similar
   d        did         k              i il
     Analyze which factors are affected by removal of low quality images
  Further analysis into skin characteristics and its
   Further analysis into skin characteristics and its 
   impact on image quality
  Develop a detailed ridge spacing profile which can 
   be used as a sensor agnostic method for 
   transforming images and compensate for
     El ti D f
      Elastic Deformation
                     ti
     Capture mechanisms


     Biometric Standards, Performance & Assurance Laboratory | www.bspalabs.org
Upcoming Research Seminar
  Paper presented at BTAS 2009-
                           2009
   http://www.bspalabs.org/files/185/BTAS%20Fprint%20Se
   nsor%20Interop.pdf
  Slides available at
   http://www.bspalabs.org/presentations-on-
   demand

  Next seminar will be on Human Biometric
   Sensor Interaction – Dr Eric Kukula
                            Dr.
   Feb 10th at 3:30pm (EST)

  Sign up at
   http://www.bspalabs.org/archives/1236

     Biometric Standards, Performance & Assurance Laboratory | www.bspalabs.org
Thank You!
Questions…


Contact Information:
   Shimon K. Modi, Ph.D.
   modis@purdue.edu
                           BSPA L b
                                  Laboratory | www.bspalabs.org
                                                    b    l b
                           Purdue University, Knoy Hall of Technology
                           401 North Grant Street
                           West Lafayette, IN 47907 2021
                                              47907-2021
                           Phone: (765) 494-2311
                           Fax: (765) 496-2700

Fingerprint Interoperability Seminar

  • 1.
    Online Research Seminar: Fingerprint Sensor Interoperability Performance Shimon K. Modi, Ph.D. Shimon K Modi Ph D Director of Research, BSPA Labs Biometric Standards, Performance, and Assurance Laboratory | www.bspalabs.org Purdue University, Department of Industrial Technology
  • 2.
    Agenda  Problem statement & Goal  Data collection protocol  Results C l i Conclusions and Future work d k Biometric Standards, Performance & Assurance Laboratory | www.bspalabs.org
  • 3.
    Problem Definition Thermal Swipe Optical Touch Capacitive Touch  Matching fingerprints collected on different types  of sensors increases probability of false matches  of sensors increases probability of false matches and false non‐matches Biometric Standards, Performance & Assurance Laboratory | www.bspalabs.org
  • 4.
    Goal Acquisition  Technology Interaction  Sensor  Type Characteristics Sensor  Interoperability  Create a statistical analysis framework to examine the  effect of sensor dependent distortions and variations  on False Non Match Rate (FNMR) of mixed datasets Biometric Standards, Performance & Assurance Laboratory | www.bspalabs.org
  • 5.
    Sensor Description  8 commerciallyavailable fingerprint sensors 8 commercially available fingerprint sensors  1 thermal swipe sensor  1 capacitive  swipe sensor 4O i l 4 Optical touch sensors h  2 Capacitive touch sensors  All sensors were 500 dpi resolution Biometric Standards, Performance & Assurance Laboratory | www.bspalabs.org
  • 6.
    Data Collection Protocol Biometric Standards, Performance & Assurance Laboratory | www.bspalabs.org
  • 7.
    Description of Participants Total 190 Gender Male Female 131 59 Occupation Manual Laborer Office Worker 17 173 Age Groups < 30 years 30‐50 years > 50 years 156 23 11 Handedness Right Left  Ambidextrous 164 23 3 Ethnicity Caucasian Black Hispanic American  American Asian Other Indian 133 8 11 1 34 3 Biometric Standards, Performance & Assurance Laboratory | www.bspalabs.org
  • 8.
    Data Analysis Methodology • VeriFinger extractor • Descriptive Stats Minutiae  Count • Test of similarity • NFIQ • Descriptive Stats Descriptive Stats Image  Quality • Test of Similarity • VeriFinger matcher • Native and mixed datasets FNMR  FNMR Matrix • Test of proportions Biometric Standards, Performance & Assurance Laboratory | www.bspalabs.org
  • 9.
    VeriFinger 5.0 Extractor Minutiae Count Analysis Dataset n M SD S1 1140 41.72 10.57 S2 1122 28.32 10.73 S3 1140 40.25 10.12 S4 1128 30.74 8.06 S5 1110 24.38 6.87 S6 1134 38.62 9.18 S7 1134 27.53 7.69 S8 1122 26.15 6.73 Biometric Standards, Performance & Assurance Laboratory | www.bspalabs.org
  • 10.
    Minutiae Count Analysis  Minutiae count extracted using VeriFinger g g Overall Hypothesis: H10: µi minutiae_count = µ2 minutiae_count……..= µ8 minutiae_count H1A: µi minutiae_count ≠ µ2 minutiae_count……..≠ µ8 minutiae_count : µ ≠ µ ≠ µ Pairwise Comparisons: H1’0: µi minutiae_count = µj minutiae_count for all i ≠ j H1’A: µi minutiae_count ≠ µj minutiae_count for all i ≠ j  Rejected null hypothesis H10  All pairs statistically significant at α = 0.05 p y g Biometric Standards, Performance & Assurance Laboratory | www.bspalabs.org
  • 11.
    NFIQ Image Quality Analysis  Dataset N M Median S1 1140 1.29 1 S2 1122 1.91 2 S3 1140 1.75 1 S4 1128 2.00 2 S5 1110 2.18 2 S6 1134 1.77 2 S7 1134 2.03 2 S8 1122 1.58 2 Biometric Standards, Performance & Assurance Laboratory | www.bspalabs.org
  • 12.
    Image Quality Analysis  Image quality computed using NFIQ g q y p g Q Overall Hypothesis: H20: µi qscore = µ2 qscore……= µ9 qscore : µ = µ =µ H2 A: µi qscore ≠ µ2 qscore…..≠ µ9 qscore Pairwise Comparisons: Pairwise Comparisons: H2’0: µi qscore = µj qscore for all i ≠ j H2’A: µi qscore ≠ µj qscore for all i ≠ j  NFIQ uses a 3‐layer feed forward nonlinear perceptron model  to predict the image quality values based on the input feature  vector of the fingerprint image  vector of the fingerprint image  Performed a Kruskal Wallis Test of similarity of ranks Biometric Standards, Performance & Assurance Laboratory | www.bspalabs.org
  • 13.
    Tukey’s HSD Pairwise Test D2 D3 D4 D5 D6 D7 D8 D1 S S S S S S S D2 S S S S S S D3 S S S S S D4 S S NS S D5 S S S D6 S S D7 S  S‐ Significant difference S Significant difference  NS – Not Significant Biometric Standards, Performance & Assurance Laboratory | www.bspalabs.org
  • 14.
    False Non Match Rate (FNMR) Matrix Analysis Biometric Standards, Performance & Assurance Laboratory | www.bspalabs.org
  • 15.
    FNMR Matrix – Fixed FMR 0.1% TEST D1 D2 D3 D4 D5 D6 D7 D8 D1 0.47 6.79 5.60 4.44 5.61 31.03 11.30 3.76 D2 7.33 5.05 6.49 7.44 10.92 16.18 10.83 6.11 E N D3 8.57 4.78 0.24 1.07 1.28 2.73 1.79 0.54 R O D4 5.10 4.44 0.95 0 1.39 1.60 1.83 1.08 L D5 5 5.56 7.64 .6 0.85 0.85 0. 8 0.78 4.42 . 2.23 . 3 0. 0.42 D6 33.86 13.42 2.99 1.30 4.47 0.17 1.41 2.15 D7 14.92 9.89 1.73 2.12 2.35 2.71 0.94 1.85 D8 2.87 2.96 0.12 0.90 0.49 1.73 0.77 0.11 Biometric Standards, Performance & Assurance Laboratory | www.bspalabs.org
  • 16.
    Test of Homogeneity of Proportions  FNMR Matrix is useful for numerical comparison p  Test of Homogeneity of FNMR was performed  between native FNMR and mixed FNMR b i d i d  Compare multiple proportions using Marascuillo Compare multiple proportions using Marascuillo Procedure Biometric Standards, Performance & Assurance Laboratory | www.bspalabs.org
  • 17.
    Results D1 D2 D3 D4 D5 D6 D7 D8 D1 S S S S S S S D2 NS NS NS S S S NS D3 S S NS NS S S NS D4 S S NS NS S S NS D5 S S NS NS S NS NS D6 S S S NS S NS NS D7 S S NS NS NS NS NS D8 S S NS NS NS S NS  S‐ Significant difference S Significant difference  NS – Not Significant Biometric Standards, Performance & Assurance Laboratory | www.bspalabs.org
  • 18.
    Impact of Quality on Interoperable FNMR  Removal of low quality images will reduce FNMR  q y g of native and interoperable datasets   But will it make the FNMR of mixed datasets  similar to FNMR of native datasets? i il f i d ?  FNMR matrix regenerated using VeriFinger 5 0 for FNMR matrix regenerated using VeriFinger 5.0 for  datasets comprised of images with NFIQ score of  1, 2, or 3   The test of homogeneity of proportions was rerun  on native and mixed dataset FNMR Biometric Standards, Performance & Assurance Laboratory | www.bspalabs.org
  • 19.
    Results D1 D2 D3 D4 D5 D6 D7 D8 D1 S S S S S S S D2 NS NS NS S S NS NS D3 S S NS NS S S NS D4 S S NS NS S S NS D5 S S NS NS S NS NS D6 S S S S S S S D7 S S NS NS NS NS NS D8 S S NS NS NS S NS  S Significant difference S‐ Significant difference  NS – Not Significant Biometric Standards, Performance & Assurance Laboratory | www.bspalabs.org
  • 20.
    Consistency of Placement  Interaction with different sensors can lead to inconsistent placement  due to sensor design, interaction type, capture area  Metric of consistency – detection of core Core detected in both images Core detected in one image Samples from different sensors – Samples from different sensors – Correctly Verified Incorrectly rejected Core detected in none of the images Samples from same sensor – Correctly verified Biometric Standards, Performance & Assurance Laboratory | www.bspalabs.org
  • 21.
    Consistency of Placement  Interaction with different sensors can lead to  inconsistent placement due to sensor design,  interaction type, capture area  Metric of consistency detection of core Metric of consistency – detection of core D1,D6 D6,D1 Biometric Standards, Performance & Assurance Laboratory | www.bspalabs.org
  • 22.
    Interoperability ‐ Interaction & Technology  Al d i t Analyzed interoperability of datasets separated by  bilit f d t t t db interaction and technology type  Created three datasets 1. Fingerprints collected from swipe sensors g p p 2. Fingerprints collected from optical touch sensors 3. Fingerprints collected from capacitive touch sensors g p p Biometric Standards, Performance & Assurance Laboratory | www.bspalabs.org
  • 23.
    Interoperability ‐ Interaction & Technology  TEST Swipe p Optical  Capacitive  p p Touch Touch E Swipe 4.81 11.75 6.58 N R O Optical  11.93 1.53 1.89 L Touch Capacitive  4.76 1.47 0.45 Touch Biometric Standards, Performance & Assurance Laboratory | www.bspalabs.org
  • 24.
    Conclusions  No technology specific impact on similarity of  gy p p y minutiae count and quality score  Image quality analysis reduced FNMR, but did not  increase similarity of FNMR i i il i f  Consistency of placement improved performance  of mixed datasets of mixed datasets  Data collected from same interaction type had  lower FNMR Biometric Standards, Performance & Assurance Laboratory | www.bspalabs.org
  • 25.
    Future Work  Apply the analysis framework to test False Match  pp y y Rates (FMR)  Removing low quality images on interoperable  datasets did not make FNMR more similar d did k i il  Analyze which factors are affected by removal of low quality images  Further analysis into skin characteristics and its Further analysis into skin characteristics and its  impact on image quality  Develop a detailed ridge spacing profile which can  be used as a sensor agnostic method for  transforming images and compensate for  El ti D f Elastic Deformation ti  Capture mechanisms Biometric Standards, Performance & Assurance Laboratory | www.bspalabs.org
  • 26.
    Upcoming Research Seminar  Paperpresented at BTAS 2009- 2009 http://www.bspalabs.org/files/185/BTAS%20Fprint%20Se nsor%20Interop.pdf  Slides available at http://www.bspalabs.org/presentations-on- demand  Next seminar will be on Human Biometric Sensor Interaction – Dr Eric Kukula Dr.  Feb 10th at 3:30pm (EST)  Sign up at http://www.bspalabs.org/archives/1236 Biometric Standards, Performance & Assurance Laboratory | www.bspalabs.org
  • 27.
    Thank You! Questions… Contact Information: Shimon K. Modi, Ph.D. modis@purdue.edu BSPA L b Laboratory | www.bspalabs.org b l b Purdue University, Knoy Hall of Technology 401 North Grant Street West Lafayette, IN 47907 2021 47907-2021 Phone: (765) 494-2311 Fax: (765) 496-2700