Konstantin Greger - Spatial Methodologies for the Analysis of Vulnerability in Urban Areas
•
3 likes•1,647 views

This document summarizes a study that analyzed the spatial vulnerability of urban areas to terrorism in Tokyo, Japan. It presented a methodology for identifying susceptibility factors like building population and traffic flow. A case study analyzed these factors for an area of central Tokyo using spatial data on buildings, demographics and transportation. The factors were operationalized and weighted to create vulnerability maps showing hotspots over time. The study provided insights into defining attributes that affect terrorism risk and visualized micro-scale spatial patterns of vulnerability to inform authorities and raise public awareness.

Recommended
Recommended
More Related Content
Similar to Konstantin Greger - Spatial Methodologies for the Analysis of Vulnerability in Urban Areas
Similar to Konstantin Greger - Spatial Methodologies for the Analysis of Vulnerability in Urban Areas (20)
Recently uploaded
Recently uploaded (20)
Konstantin Greger - Spatial Methodologies for the Analysis of Vulnerability in Urban Areas
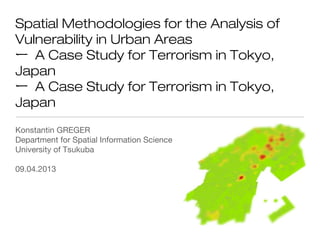
- 1. Spatial Methodologies for the Analysis of Vulnerability in Urban Areas ー A Case Study for Terrorism in Tokyo, Japan ー A Case Study for Terrorism in Tokyo, Japan Konstantin GREGER Department for Spatial Information Science University of Tsukuba 09.04.2013
- 2. Agenda Methodology Case Study Susceptibility Factors Building Population Traffic Flow Vulnerability Mapping Summary 2
- 3. Methodology
- 4. Research Objective disasters can happen everywhere but they are more severe in some locations than in others special case of terrorism ➞ deliberate decision: "If I were a terrorist, I would ..." vulnerability centric, scenario based research the unit of analysis is the geography, not the event no investigation what outcome disaster (or an attack) at a location can cause ⇒Finding out how prone a location is to a disaster (or an attack), as a result of the attributes that define it. 4
- 5. Hypotheses ① Vulnerability is not distributed equally in space. places with high vulnerability vs. places with low vulnerability ② Factors exist that enhance or mitigate vulnerability. attributes of objects at risk ③ Vulnerability of objects influences their spatial surroundings. spatial influence of objects 5
- 6. Objects of Interest ① buildings houses, offices, factories, warehouses, stations, ... ② infrastructures railroads, roads, utilities ③ people most important! human activities define urban space 6
- 7. Environmental Backcloth theory originated in the field of place-based crime analysis “ The urban settings that create crime and fear are human constructions, the by-product of the environments we build to support the requirements of everyday life: homes and residential neighborhoods; shops and offices; factories and warehouses; government buildings; parks and recreational ” sites; sports stadia and theatres; transport systems, bus stops, roadways and parking garages. The ways in which we assemble these large building blocks of routine activity into the urban backcloth can have enormous impact […] on the quantities, types and timing of the crimes we suffer. (Brantingham and Brantingham 1995) 7
- 8. Susceptibility “ ” [m]otivated offenders will commit crime against suitable targets at certain places according to the environmental characteristics of those places that make it easier to complete the crime successfully. (Caplan and Kennedy 2010a) expert knowledge about building susceptibility: "Reference Manual to Mitigate Potential Terrorist Attacks Against Buildings" by U.S. Federal Emergency Management Agency (FEMA 2003) "Handbook for Rapid Visual Screening of Buildings to Evaluate Terrorism Risks" by U.S. Federal Emergency Management Agency (FEMA 2009) 8
- 9. Spatial Urban Vulnerability Analysis (SUVA) Framework susceptibility factor 1 SI factor map 1 weight 1 spatial data factor 2 SI factor map 2 weight 2 non-spatial data factor 3 SI factor map 3 weight 3 expert knowledge ... ... ... factor n SI factor map n weight n RTM vulnerability map 9
- 10. Spatial Influence (SI) analysis focuses on the effect that the “crime generators” have on the object's immediate surroundings 3-dimensional real-world objects vs. 1-dimensional point objects “ The best way to map crime factors for the articulation of criminogenic backcloths is to operationalize the spatial influence of each factor, acting ” as crime generators, throughout a common landscape rather than atheoretically mapping the factors as points, lines or polygons in a manner that keeps them disconnected from their broader social and environmental contexts. (Caplan and Kennedy 2010a) 10
- 11. Risk Terrain Modeling (RTM) “ Risk terrain modeling (RTM) is an approach to risk assessment in which separate map layers representing the influence and intensity of a crime risk factor at every place throughout a geography is created in a geographic information system (GIS). Then all map layers are combined to produce a composite “risk terrain” map with values that account for all risk factors at every place throughout the geography. RTM builds upon principles of hotspot mapping […] to produce maps that show where ” conditions are ideal or conducive for crimes to occur in the future given the existing environmental contexts. It offers a [...] statistically valid way to articulate and communicate crime-prone areas at the micro-level according to the spatial influence of criminogenic features. (Caplan and Kennedy 2010a) identification of factors ➞ operationalization (SI) ➞ weighting ➞ mapping 11
- 12. Study Area Central Tokyo: Chiyoda-ku, Chuo-ku, Minato-ku ~ 43 km2 area ~ 92,000 buildings diverse land uses, building types and building density several iconic buildings many critical infrastructures
- 13. Three Susceptibility Factors ① building population estimated number of people within each building ② traffic flow estimated number of pedestrians, train passengers ③ symbolic value dichotomic variable; qualitative estimation 13
- 14. Susceptibility Factor ①: Building Population
- 15. Three Population Types ① permanent / long-term population residents; employees volumetric estimation ② temporary / short-term population customers; visitors; guests customer-floorspace ratio ③ dynamic / moving / mobile population ➞ susceptibility factor ② traffic flow 15
- 16. Spatio-Temporal Categorical Permanent / Long-Term Volumetric Building Population Estimation where PBPi,c,t is the permanent building population in category c of building i at time t, APAi,c,t is the total population of category c at time t in area A, which contains building i, A is the set of areas, BA is the building footprint area, BF is the number of floors, k is an index 16
- 17. Necessary Datasets ① Building data, containing the footprint area and the number of floors ➞ Zmap-TOWNII by Zenrin Co., Ltd. ( 株式会社ゼンリン ) ② Census data, both for residential and employment populations ➞ population census ( 国勢調査 ) from the Statistics Bureau at the Ministry of Internal Affairs and Communications ( 総務省統計局 ) ➞ employment census ( 経済センサス ) from the Statistical Information Inst. for Consulting & Analysis ( 公益財団法人統計情報研究開発センタ ー) ③ Address point data, containing categorical information ➞ テレポイント Pack! by Zenrin Co., Ltd. ( 株式会社ゼンリン ) ④ Population movement profiles ➞ person trip data ( 東京都市圏人の流れデータ ) by the University of Tokyo Center for Spatial Inf. Science ( 東京大学空間情報科学研究センター ) 17
- 18. Usage Categories ① home ② business & office ③ education ④ retail & service ⑤ hotel ⑥ leisure ⑦ public institution ⑨ other 18
- 19. Mixed Building Usage Categories shortcoming of previous simplified 2-dimensional approach (residents/employees) (cf. Lwin & Murayama 2009) many buildings comprise more than one usage category no detailed usage ratio information available approximation using number of address points per category per building Building ① ② ③ ④ ⑤ ⑥ ⑦ ∑ 大手町ビルヂング 113 3 25 1 36 3 181 新丸の内ビルディング 13 47 44 3 107 六本木ヒルズ森タワー 73 7 53 32 16 181 ファミール月島グランスイートタワー 18 1 19 19
- 23. 100 m 22 100 m2 2 1 0 0 m2 4 floors 3 floors 1 0 floor s → 400 m 22 → 300 m 22 → 1 , 0 0 0 m2 → 13.3% → 10.0% → 33.3% ⇒ 200 ppl. ⇒ 150 ppl. ⇒ 5 0 0 p p l. 2 0 0 m2 2 4 f loor s 100 m 2 → 8 0 0 m2 2 5 floors 6 → 26.7% → 500 m2 ⇒ 4 0 0 pp l. → 16.7% ⇒ 250 ppl. Cumulative floor space: 3,000 m 2 Total area population: 1,500 ppl.
- 25. Spatio-Temporal Categorical Permanent / Long-Term Volumetric Building Population Estimation where PBPi,c,t is the permanent building population in category c of building i at time t, APAi,c,t is the total population of category c at time t in area A, which contains building i, A is the set of areas, BA is the building footprint area, BF is the number of floors, k is an index 25
- 26. Persontrip Data Time Place Start End Start End Means Purpose 07:14 07:19 Home Sta. A walk for work 07:19 07:32 Sta. A Sta. B train for work 07:32 07:37 Sta. B Sta. C train for work 07:37 07:45 Sta. C Office walk for work 17:30 17:40 Office Restaurant walk for leisure 21:00 21:07 Restaurant Sta. C walk for home 21:07 21:12 Sta. C Sta. B train for home 21:12 21:25 Sta. B Sta. A train for home 21:25 21:30 Sta. A Home walk for home 26
- 27. Persontrip Data 1 2 3 4 1 1 2 3 4 1 2 3 home work leisure home time 27
- 28. Usage Categories vs. Activities ① home home ① → being at home → being at home ② business & office business & office ② → working → working permanent / long-term ③ education ③ education → studying → studying population ④ retail & service ④ retail & service → shopping → shopping ⑤ hotel & leisure ⑤ hotel & leisure → entertaining → entertaining ⑦ public institution ⑦ public institution → running errands → running errands temporary / short-term population 28
- 29. Spatio-Temporal Population Estimation Result maxhome = 506maxwork = 343 29
- 31. Three Population Types ① permanent / long-term population residents; employees ② temporary / short-term population customers; visitors; guests ③ dynamic / moving / mobile population ➞ susceptibility factor ② traffic flow 31
- 32. Spatio-Temporal Categorical Temporary / Short-Term Building Population Estimation where TBPi,c,t is the temporary building population in category c of building i at time t, FSc,i is the cumulative floorspace of category c in building i, γc is the customer floorspace ratio of category c, βc,t is a binary variable (0 / 1) showing whether category c is in operation at time t. values for γc are taken from empirical data (cf. Bosserhoff 2005) values for βc,t are taken from clustered movement profiles (cf. Gonzalez et al. 2008; Horanont 2012; Jiang et al. 2012) 32
- 33. Susceptibility Factor ②: Traffic Flow
- 34. Spatio-Temporal Categorical Temporary / Short-Term Building Population Estimation ① motorized traffic → traffic census data ② railway traffic → traffic census data ③ pedestrian traffic → betweenness centrality measure (network theory) based on passenger volume per station ( 国道交通省 ) based on OD data ( 東京都市圏交通計画協議会事務局 ) based on mobile phone tracking data ( 株式会社ゼンリンデータコム混雑統計) no absolute traffic volume, but volume index 34
- 36. Spatial Influence (SI) Total Permanent Population Betwenness Centrality 36
- 37. Operationalization of SI ① spatial concentration identification of hotspots ② spatial proximity each object affects the space (Caplan and Kennedy 2010a) surrounding itself by its criminogenic attributes dimension of proximity has to be defined for each factor 37
- 40. Vulnerability Mapping where Vtot,t is the total vulnerability at time t, SF is the set of susceptibility factors, wi is the factor weight of factor i, F^i,t is the factor value on a normalized scale (1: very low, 4 very high), i is an index. 40
- 42. Summary
- 43. Summary ① analytic insight definition of attributes and factors affecting terrorism vulnerability new approach (terrorism + vulnerability + GIS) ② visualization creation of a micro-scale vulnerability map of a study area in a Japanese urban area spatial distribution of vulnerability factors 43
- 44. Target Audiences ① public visual way to communicate the complex topic of vulnerability raising awareness for terrorism risk in Japan ② involved authorities / stakeholders effective channeling of limited funding for mitigation measures ③ academia 44
- 45. Bibliography Abbott, Andrew. 1997. “Of Time and Space: The Contemporary Relevance of the Chicago School.” Social Forces 75(4):1149–1182. Apostolakis, George E., and Douglas M. Lemon. 2005. “A Screening Methodology for the Identification and Ranking of Infrastructure Vulnerabilities Due to Terrorism.” Risk Analysis 25(2):361–376. Bosserhoff, Dietmar. 2005. Integration von Verkehrsplanung und räumlicher Planung Teil 1: Grundsätze und Umsetzung. 2nd ed. Wiesbaden: Hessisches Landesamt für Straßen- und Verkehrswesen (http://www.hessen.de/irj/hessen_Internet?rid=HStK_15/hessen_Internet/presse.jsp). Brantingham, Patricia, and Paul Brantingham. 1995. “Criminality of place.” European Journal on Criminal Policy and Research 3(3):5–26. Brown, Gerald G., and Louis Anthony Tony Cox Jr. 2011. “How Probabilistic Risk Assessment Can Mislead Terrorism Risk Analysts.” Risk Analysis 31(2):196–204. Caplan, Joel M., and Leslie W. Kennedy. 2010a. Risk Terrain Modeling Compendium. Newark, NJ: Rutgers Center on Public Security. Caplan, Joel M., and Leslie W. Kennedy. 2010b. Risk Terrain Modeling Manual: Theoretical Framework and Technical Steps of Spatial Risk Assessment. Newark, NJ: Rutgers Center on Public Security. FEMA Federal Emergency Management Agency. 2003. “Reference Manual to Mitigate Potential Terrorist Attacks Against Buildings.” ( http://www.fema.gov/library/viewRecord.do?id=1559). FEMA Federal Emergency Management Agency. 2009. “Handbook for Rapid Visual Screening of Buildings to Evaluate Terrorism Risks.” ( http://www.fema.gov/library/viewRecord.do?fromSearch=fromsearch&id=1567). González, Marta C., César A. Hidalgo, and Albert-László Barabási. 2008. “Understanding individual human mobility patterns.” Nature 453(7196):779–782. Horanont, Teerayut. 2012. “A Study on Urban Mobility and Dynamic Population Estimation by Using Aggregate Mobile Phone Sources.” ( http://www.csis.u-tokyo.ac.jp/dp/115.pdf). Jiang, Shan, Joseph Ferreira, and Marta C. González. 2012. “Clustering daily patterns of human activities in the city.” Data Mining and Knowledge Discovery 25(3):478–510. Kaplan, Stanley, and B. John Garrick. 1981. “On The Quantitative Definition of Risk.” Risk Analysis 1(1):11–27. Karydas, D.M., and J.F. Gifun. 2006. “A method for the efficient prioritization of infrastructure renewal projects.” Reliability Engineering & System Safety 91(1):84–99. Lemon, Douglas M. 2004. “A Methodology for the Identification of Critical Locations in Infrastructures.” Lwin, KoKo, and Yuji Murayama. 2009. “A GIS Approach to Estimation of Building Population for Micro-spatial Analysis.” Transactions in GIS 13(4):401–414. Michaud, David. 2005. “Risk Analysis of Infrastructure Systems Screening Vulnerabilities in Water Supply Networks.” National Consortium for the Study of Terrorism and Responses to Terrorism (START). 2011. “Global Terrorism Database: Variables & Inclusion Criteria.” ( http://www.start.umd.edu/gtd/downloads/Codebook.pdf). 45 Paté-Cornell, Elisabeth, and Seth Guikema. 2002. “Probabilistic Modeling of Terrorist Threats: A Systems Approach to Setting Priorities Among Countermeasures.” Military
- 46. Thank you for your attention greger@geoenv.tsukuba.ac.jp http://www.konstantingreger.net @kogreger
- 47. Vulnerability ≠ Risk risk (loss / probability) hazard vulnerability 47
- 48. Building Usage Categories Distribution ① ② ③ ④ Categories ① home ② business & office ③ education ④ retail & service ⑤ hotel ⑥ leisure ⑦ public institution ⑤ ⑥ ⑦ 48
- 49. Building Usage Categories Density Distribution ① ② ③ ④ Categories ① home② business & office③ education④ retail & service⑤ hotel⑥ leisure⑦ public institution ⑤ ⑥ ⑦ 49
- 50. Mixed Building Usage Categories 50
- 54. 01:00 02:00 03:00 04:00 05:00 06:00 07:00 08:00 09:00 10:00 11:00 12:00 13:00 14:00 15:00 16:00 17:00 18:00 19:00 20:00 21:00 22:00 23:00
- 55. Spatio-Temporal Population Estimation Result maxhome = 8maxwork = 2,568 55