Download to read offline

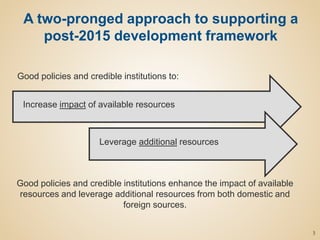
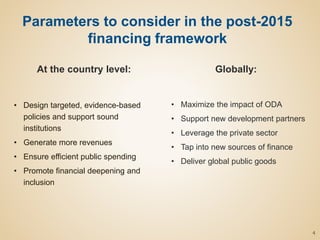
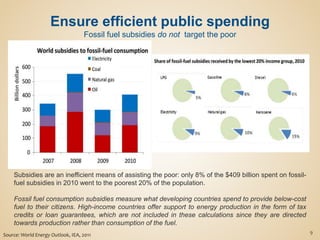
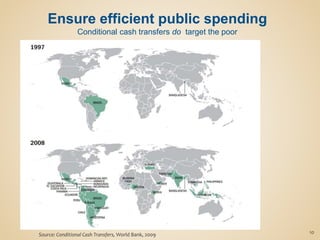
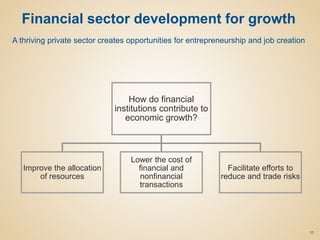
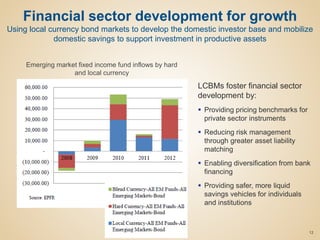
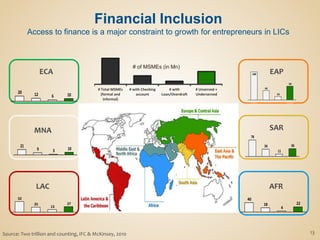
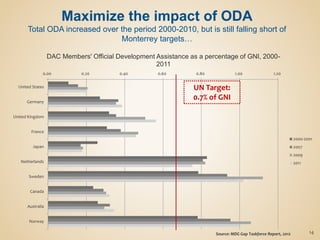
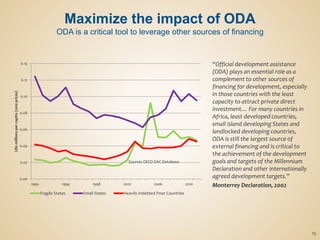
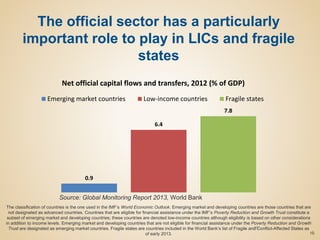
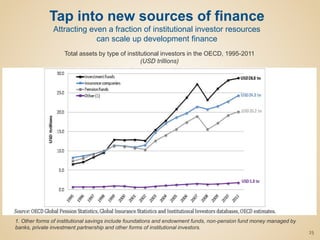
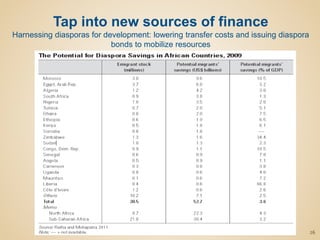
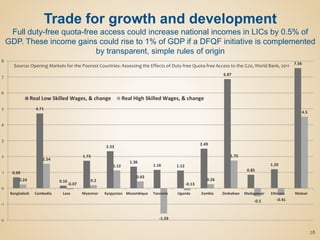
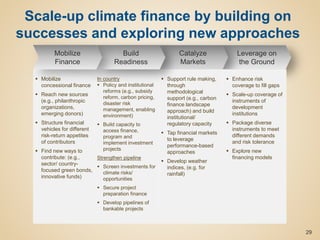
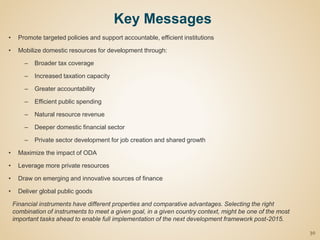


The document discusses financing options to support development goals after 2015. It emphasizes that financing frameworks must integrate effective policies and institutions. It proposes a two-pronged approach of good policies and credible institutions to enhance financing impact and leverage additional resources domestically and internationally. Specific financing parameters discussed include generating more domestic revenues through taxation, natural resources, and reducing inefficient spending. Mobilizing private resources through financial inclusion and markets is also examined. Maximizing ODA impact and collaborating with new development partners are proposed to complement domestic efforts.


