


![© OECD | Centre for Entrepreneurship, SMEs, Regions and Cities | @OECD_Local |
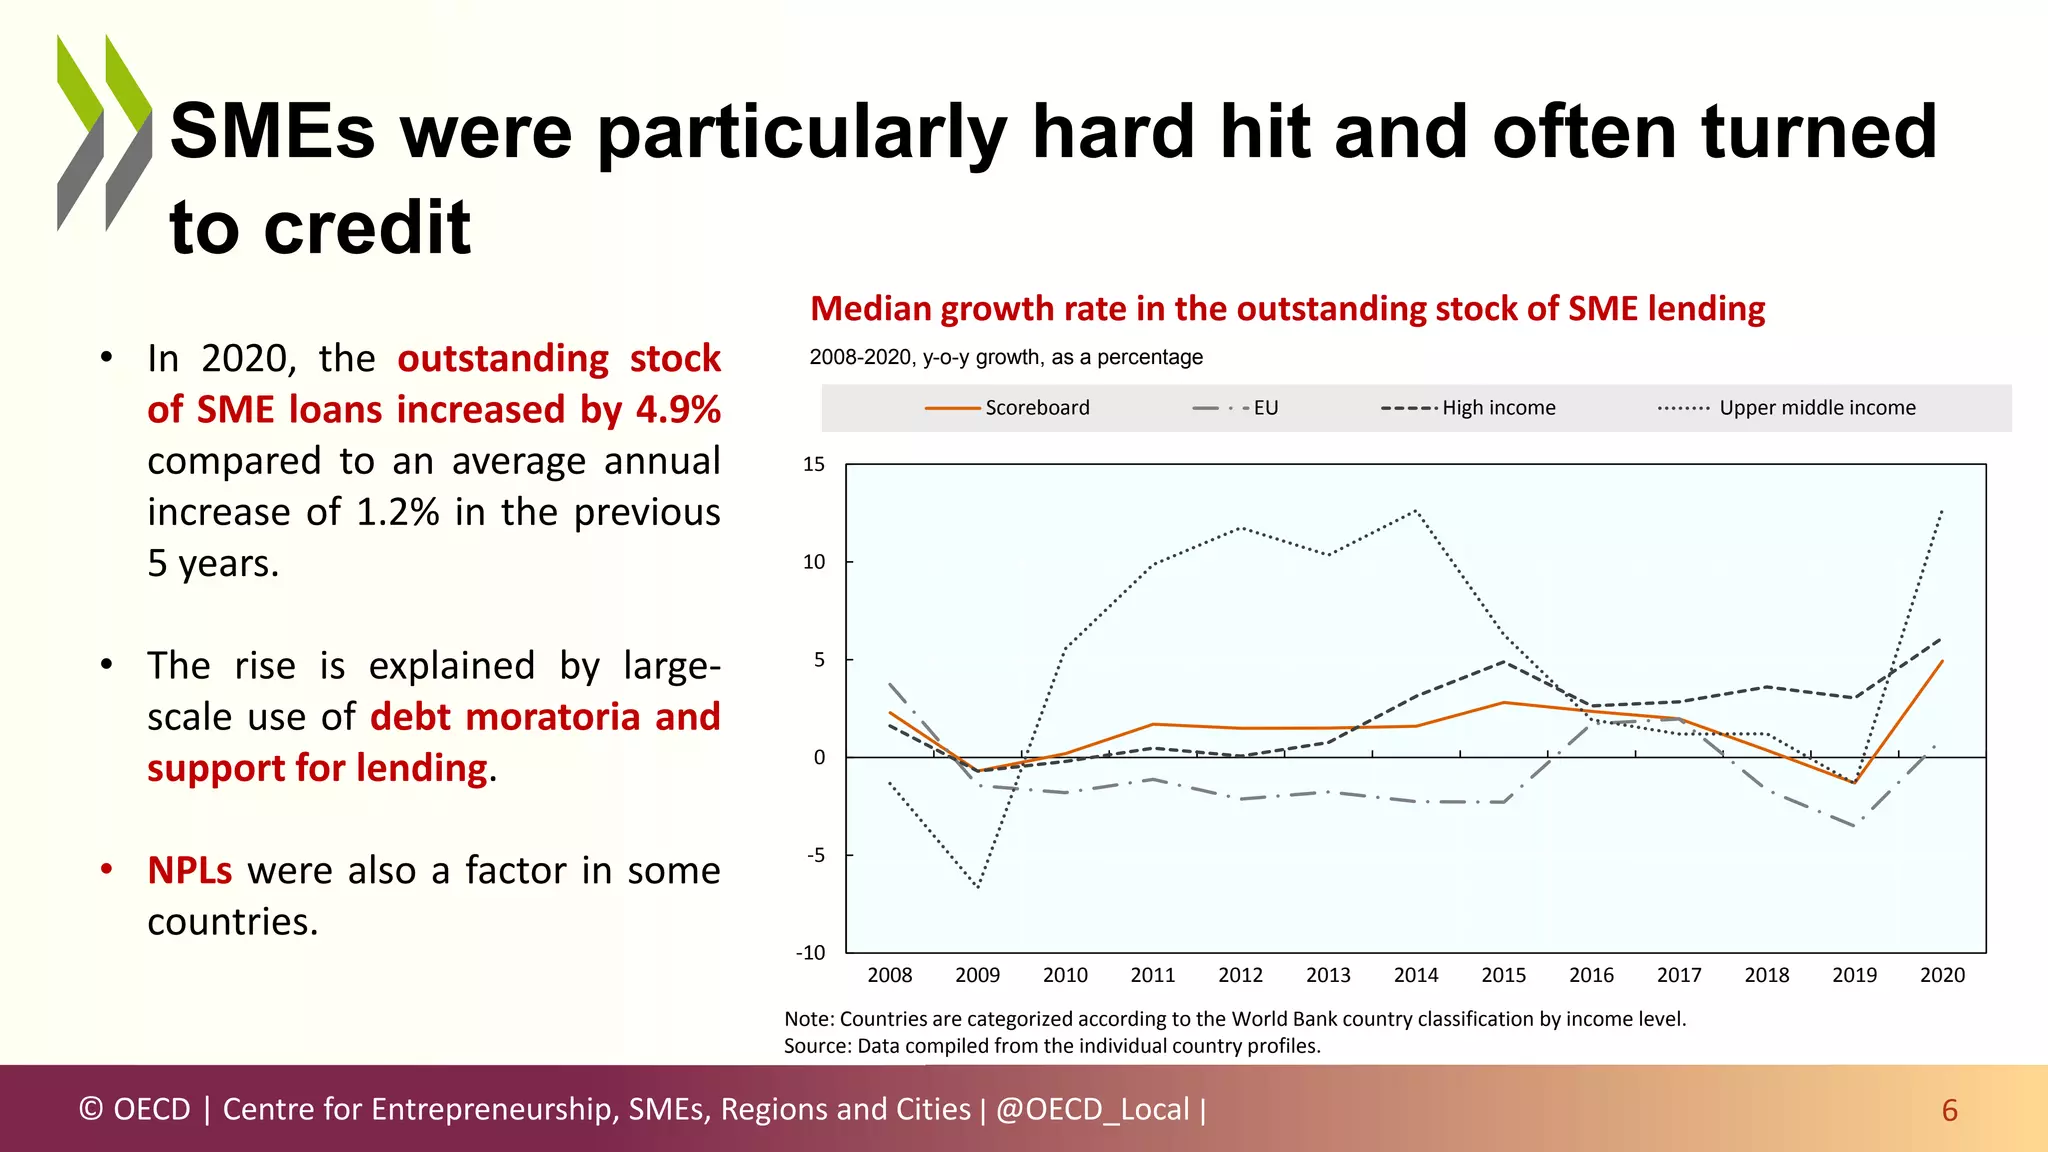
SMEs are a less explicit focus in recovery packages…
15
Source: Global Recovery Observatory (O’Callaghan, 2020[47])
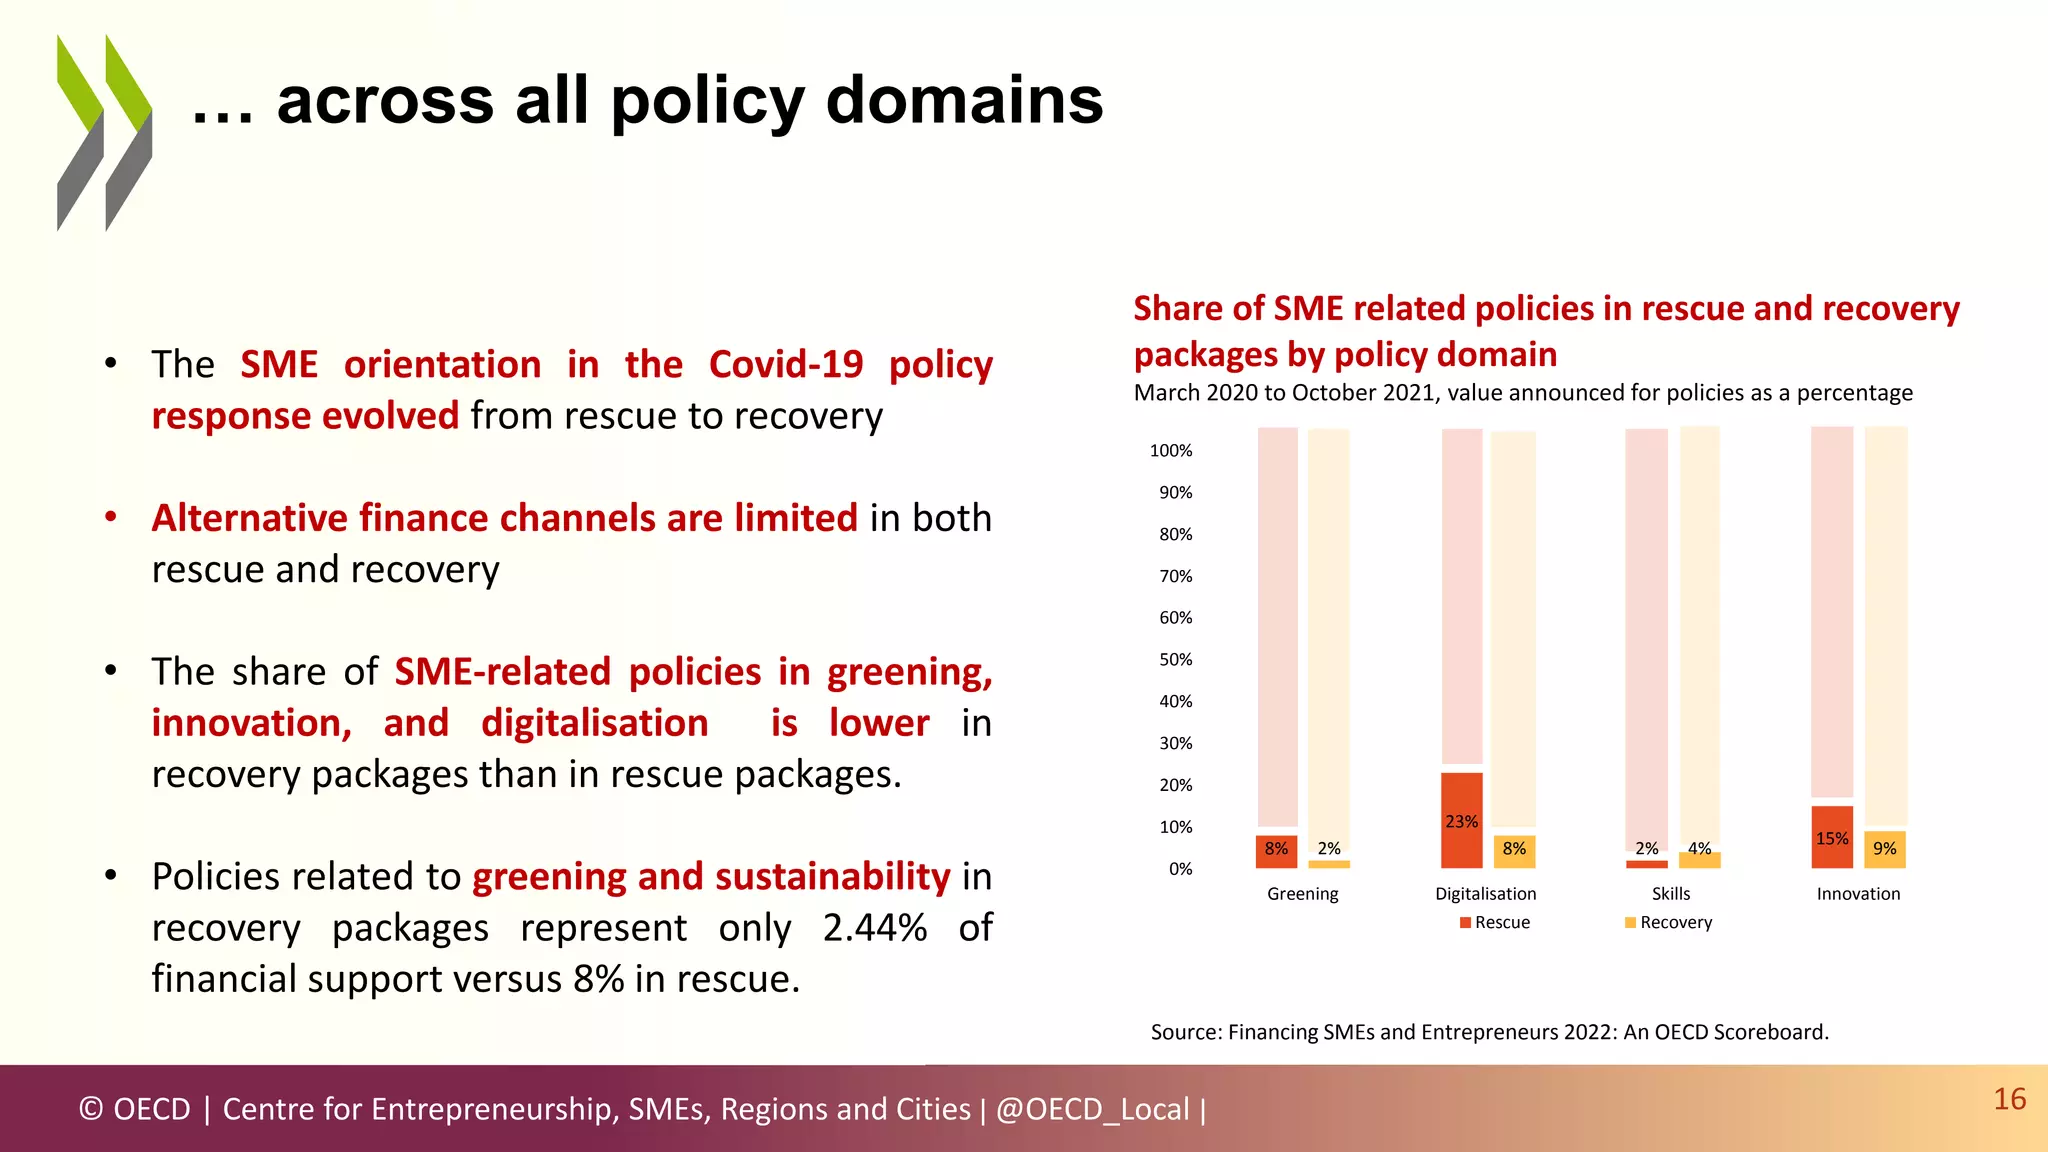
Share of SME related policies in the total value
announced in rescue and recovery packages
March 2020 to October 2021, value announced for policies in USD
billions and as a percentage
• The SME orientation in COVID-19 policy
responses declined from the rescue to recovery
phases.
• Only around 2% of total funding in recovery
packages targets SMEs, compared to more than
25% in crisis rescue packages.
• In absolute terms, spending on SME-related
policies dropped from USD 3 862.02 billion in
the rescue packages to USD 78.15 billion in
recovery packages.
[CELLRANGE]
[CELLRANGE]
[CELLRANGE]
[CELLRANGE]
[CELLRANGE]
[CELLRANGE]
0%
10%
20%
30%
40%
50%
60%
70%
80%
90%
100%
Rescue Recovery Total
Share of SME related policies Share of other policies
Value tags in USD billion](https://image.slidesharecdn.com/presentationscoreboardlaunch29march2022-220331120843/75/Presentation-Scoreboard-Launch_29-March-2022-pptx-15-2048.jpg)


The OECD's 2022 Scoreboard on financing SMEs and entrepreneurs provides an analysis of the impact of the COVID-19 pandemic on SME financing across 48 countries, highlighting trends in lending, bankruptcies, and government support measures. While new lending saw mixed growth rates, overall conditions remained favorable for SMEs due to government-backed credit guarantees and low interest rates. Moving forward, the report emphasizes the importance of monitoring SME access to finance and addressing high debt levels as support mechanisms are phased out.