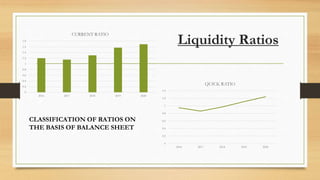
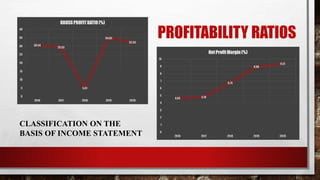
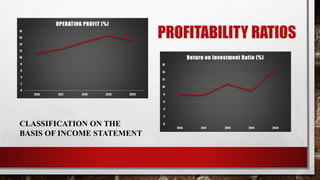
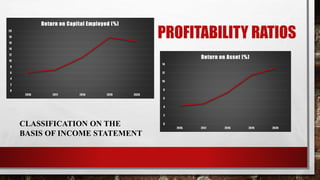
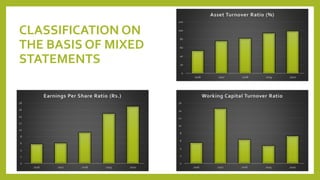
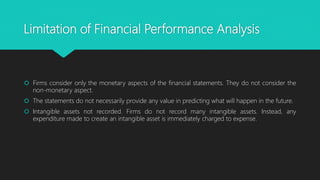
Financial Performance Analysis
of
RADICO KHAITAN
LTD.
Presentation On
Under the guidance of:
Dr. NUDRAT MOINI REHMAN
Presented By:
TALHA KHAN
MBA 3rd Sem
Enroll. No. – 2019-502-113
Agenda
 Introduction
 Significance and Techniques of Financial Performance Analysis.
 Company Profile.
 Research Methodology
 Liquidity Ratio
 Profitability Ratio
 Cash Flow Statement Ratio
 Recommendation
 Conclusion
 Limitation of Financial Performance Analysis.
Click to edit Master title style
3
Introduction
• Financial Performance Analysis is defined as, “The
process of identifying financial strengths and
weaknesses of a business by establishing relationship
between the elements of balance sheet and income
statement.”
• A Financial Statement is an organized collection of data
according to logical and consistent accounting
procedures.
• There are three main financial statements:
1. Balance Sheet
2. Income Statement
3. Cash Flow Statement
Significance of Financial
PerformanceAnalysis
Financial Manager
Top Management
Lenders
Investors
Techniques of Financial
PerformanceAnalysis
Common Size
Statement
Financial Ratio
Analysis
Comparative
Statement Analysis
Cash Flow
Statement
Company Profile
• Radico khaitan is one of the India's oldest and
largest liquor manufacturers. formally known as
Rampur Distillery which was established in
1943.
Dr. Lalit Khaitan
(Chairman &
Managing director)
Mr. Abishek Khaitan
(Managing Director)
Mr. K.P.Singh
(Whole Time Director)
Research Methodology
1. Objectives
 To develop practical understanding of ratios based on financial statements.
 To develop clarity about different types of ratios and their significance in financial set up.
 To study and analyse the financial position of the Company through ratio analysis.
 To suggest measures for improving the financial performance of organization.
 To study and compare the financial position of company with its competitors through ratio analysis.
2. Research Design
 Descriptive Research Design
3. Data Source
 Secondary Data
4. Measurement tool
 Common Size Statement
 Ratio Analysis
 Cash Flow Statement
ANALYSIS
■ CLASSIFICATIONOF RATIOS ONTHE BASIS OF BALANCE
SHEET
■ CLASSIFICATIONONTHE BASIS OF INCOME STATEMENT
■ CLASSIFICATIONONTHE BASIS OF MIXED STATEMENTS
Liquidity Ratios
0
0.2
0.4
0.6
0.8
1
1.2
1.4
1.6
1.8
2016 2017 2018 2019 2020
CURRENT RATIO
0
0.2
0.4
0.6
0.8
1
1.2
1.4
2016 2017 2018 2019 2020
QUICK RATIO
CLASSIFICATION OF RATIOS ON
THE BASIS OF BALANCE SHEET
PROFITABILITY RATIOS
30.54
29.35
5.01
34.83
32.33
0
5
10
15
20
25
30
35
40
2016 2017 2018 2019 2020
GROSSPROFITRATIO(%)
4.65 4.79
6.74
8.96
9.37
0
1
2
3
4
5
6
7
8
9
10
2016 2017 2018 2019 2020
Net ProfitMargin (%)
CLASSIFICATION ON THE
BASIS OF INCOME STATEMENT
PROFITABILITY RATIOS
CLASSIFICATION ON THE
BASIS OF INCOME STATEMENT
0
2
4
6
8
10
12
14
16
18
2016 2017 2018 2019 2020
OPERATING PROFIT (%)
0
2
4
6
8
10
12
14
16
2016 2017 2018 2019 2020
Return on Investment Ratio (%)
PROFITABILITY RATIOS
CLASSIFICATION ON THE
BASIS OF INCOME STATEMENT
0
2
4
6
8
10
12
14
2016 2017 2018 2019 2020
Return on Asset (%)
0
2
4
6
8
10
12
14
16
18
20
2016 2017 2018 2019 2020
Return on Capital Employed (%)
CLASSIFICATION ON
THE BASIS OF MIXED
STATEMENTS
0
2
4
6
8
10
12
14
16
2016 2017 2018 2019 2020
Working Capital Turnover Ratio
0
2
4
6
8
10
12
14
16
18
2016 2017 2018 2019 2020
Earnings Per Share Ratio (Rs.)
0
20
40
60
80
100
120
2016 2017 2018 2019 2020
Asset Turnover Ratio (%)
Recommendations
 From the income statement of the company, it is clear that the net profit is increasing
which is a good sign. It has to maintain it further to run the business for long term.
 The company should take precautionary measures for investing in partnership firms and
collecting funds from receivables.
 The company should strive to keep a check on its Quick Ratio as it shrinks compared to
the company's competitors.This can be done by controlling current debts/liabilities.
 EPS is low compared to other companies in the industry.The company should take care of
it in order to retain its shareholders over time.
 The company's profits are based on each level and the industry as a whole. It is proposed
to ensure the maintenance of this stability or profit. Also, the company should take steps
to further improve profits.
Conclusion
 The Company’s liquidity position is satisfactory but there is scope for
better results.
 The Company’s profitability position is quite satisfactory.
 The company’s turnover ratios are indicating that company is in a
healthy position.
Limitation of Financial Performance Analysis
 Firms consider only the monetary aspects of the financial statements. They do not consider the
non-monetary aspect.
 The statements do not necessarily provide any value in predicting what will happen in the future.
 Intangible assets not recorded. Firms do not record many intangible assets. Instead, any
expenditure made to create an intangible asset is immediately charged to expense.
Financial performance analysis

Financial performance analysis

  • 1.
    Financial Performance Analysis of RADICOKHAITAN LTD. Presentation On Under the guidance of: Dr. NUDRAT MOINI REHMAN Presented By: TALHA KHAN MBA 3rd Sem Enroll. No. – 2019-502-113
  • 2.
    Agenda  Introduction  Significanceand Techniques of Financial Performance Analysis.  Company Profile.  Research Methodology  Liquidity Ratio  Profitability Ratio  Cash Flow Statement Ratio  Recommendation  Conclusion  Limitation of Financial Performance Analysis.
  • 3.
    Click to editMaster title style 3 Introduction • Financial Performance Analysis is defined as, “The process of identifying financial strengths and weaknesses of a business by establishing relationship between the elements of balance sheet and income statement.” • A Financial Statement is an organized collection of data according to logical and consistent accounting procedures. • There are three main financial statements: 1. Balance Sheet 2. Income Statement 3. Cash Flow Statement
  • 4.
    Significance of Financial PerformanceAnalysis FinancialManager Top Management Lenders Investors Techniques of Financial PerformanceAnalysis Common Size Statement Financial Ratio Analysis Comparative Statement Analysis Cash Flow Statement
  • 5.
    Company Profile • Radicokhaitan is one of the India's oldest and largest liquor manufacturers. formally known as Rampur Distillery which was established in 1943.
  • 6.
    Dr. Lalit Khaitan (Chairman& Managing director) Mr. Abishek Khaitan (Managing Director) Mr. K.P.Singh (Whole Time Director)
  • 7.
    Research Methodology 1. Objectives To develop practical understanding of ratios based on financial statements.  To develop clarity about different types of ratios and their significance in financial set up.  To study and analyse the financial position of the Company through ratio analysis.  To suggest measures for improving the financial performance of organization.  To study and compare the financial position of company with its competitors through ratio analysis. 2. Research Design  Descriptive Research Design 3. Data Source  Secondary Data 4. Measurement tool  Common Size Statement  Ratio Analysis  Cash Flow Statement
  • 8.
    ANALYSIS ■ CLASSIFICATIONOF RATIOSONTHE BASIS OF BALANCE SHEET ■ CLASSIFICATIONONTHE BASIS OF INCOME STATEMENT ■ CLASSIFICATIONONTHE BASIS OF MIXED STATEMENTS
  • 9.
    Liquidity Ratios 0 0.2 0.4 0.6 0.8 1 1.2 1.4 1.6 1.8 2016 20172018 2019 2020 CURRENT RATIO 0 0.2 0.4 0.6 0.8 1 1.2 1.4 2016 2017 2018 2019 2020 QUICK RATIO CLASSIFICATION OF RATIOS ON THE BASIS OF BALANCE SHEET
  • 10.
    PROFITABILITY RATIOS 30.54 29.35 5.01 34.83 32.33 0 5 10 15 20 25 30 35 40 2016 20172018 2019 2020 GROSSPROFITRATIO(%) 4.65 4.79 6.74 8.96 9.37 0 1 2 3 4 5 6 7 8 9 10 2016 2017 2018 2019 2020 Net ProfitMargin (%) CLASSIFICATION ON THE BASIS OF INCOME STATEMENT
  • 11.
    PROFITABILITY RATIOS CLASSIFICATION ONTHE BASIS OF INCOME STATEMENT 0 2 4 6 8 10 12 14 16 18 2016 2017 2018 2019 2020 OPERATING PROFIT (%) 0 2 4 6 8 10 12 14 16 2016 2017 2018 2019 2020 Return on Investment Ratio (%)
  • 12.
    PROFITABILITY RATIOS CLASSIFICATION ONTHE BASIS OF INCOME STATEMENT 0 2 4 6 8 10 12 14 2016 2017 2018 2019 2020 Return on Asset (%) 0 2 4 6 8 10 12 14 16 18 20 2016 2017 2018 2019 2020 Return on Capital Employed (%)
  • 13.
    CLASSIFICATION ON THE BASISOF MIXED STATEMENTS 0 2 4 6 8 10 12 14 16 2016 2017 2018 2019 2020 Working Capital Turnover Ratio 0 2 4 6 8 10 12 14 16 18 2016 2017 2018 2019 2020 Earnings Per Share Ratio (Rs.) 0 20 40 60 80 100 120 2016 2017 2018 2019 2020 Asset Turnover Ratio (%)
  • 14.
    Recommendations  From theincome statement of the company, it is clear that the net profit is increasing which is a good sign. It has to maintain it further to run the business for long term.  The company should take precautionary measures for investing in partnership firms and collecting funds from receivables.  The company should strive to keep a check on its Quick Ratio as it shrinks compared to the company's competitors.This can be done by controlling current debts/liabilities.  EPS is low compared to other companies in the industry.The company should take care of it in order to retain its shareholders over time.  The company's profits are based on each level and the industry as a whole. It is proposed to ensure the maintenance of this stability or profit. Also, the company should take steps to further improve profits.
  • 15.
    Conclusion  The Company’sliquidity position is satisfactory but there is scope for better results.  The Company’s profitability position is quite satisfactory.  The company’s turnover ratios are indicating that company is in a healthy position.
  • 16.
    Limitation of FinancialPerformance Analysis  Firms consider only the monetary aspects of the financial statements. They do not consider the non-monetary aspect.  The statements do not necessarily provide any value in predicting what will happen in the future.  Intangible assets not recorded. Firms do not record many intangible assets. Instead, any expenditure made to create an intangible asset is immediately charged to expense.