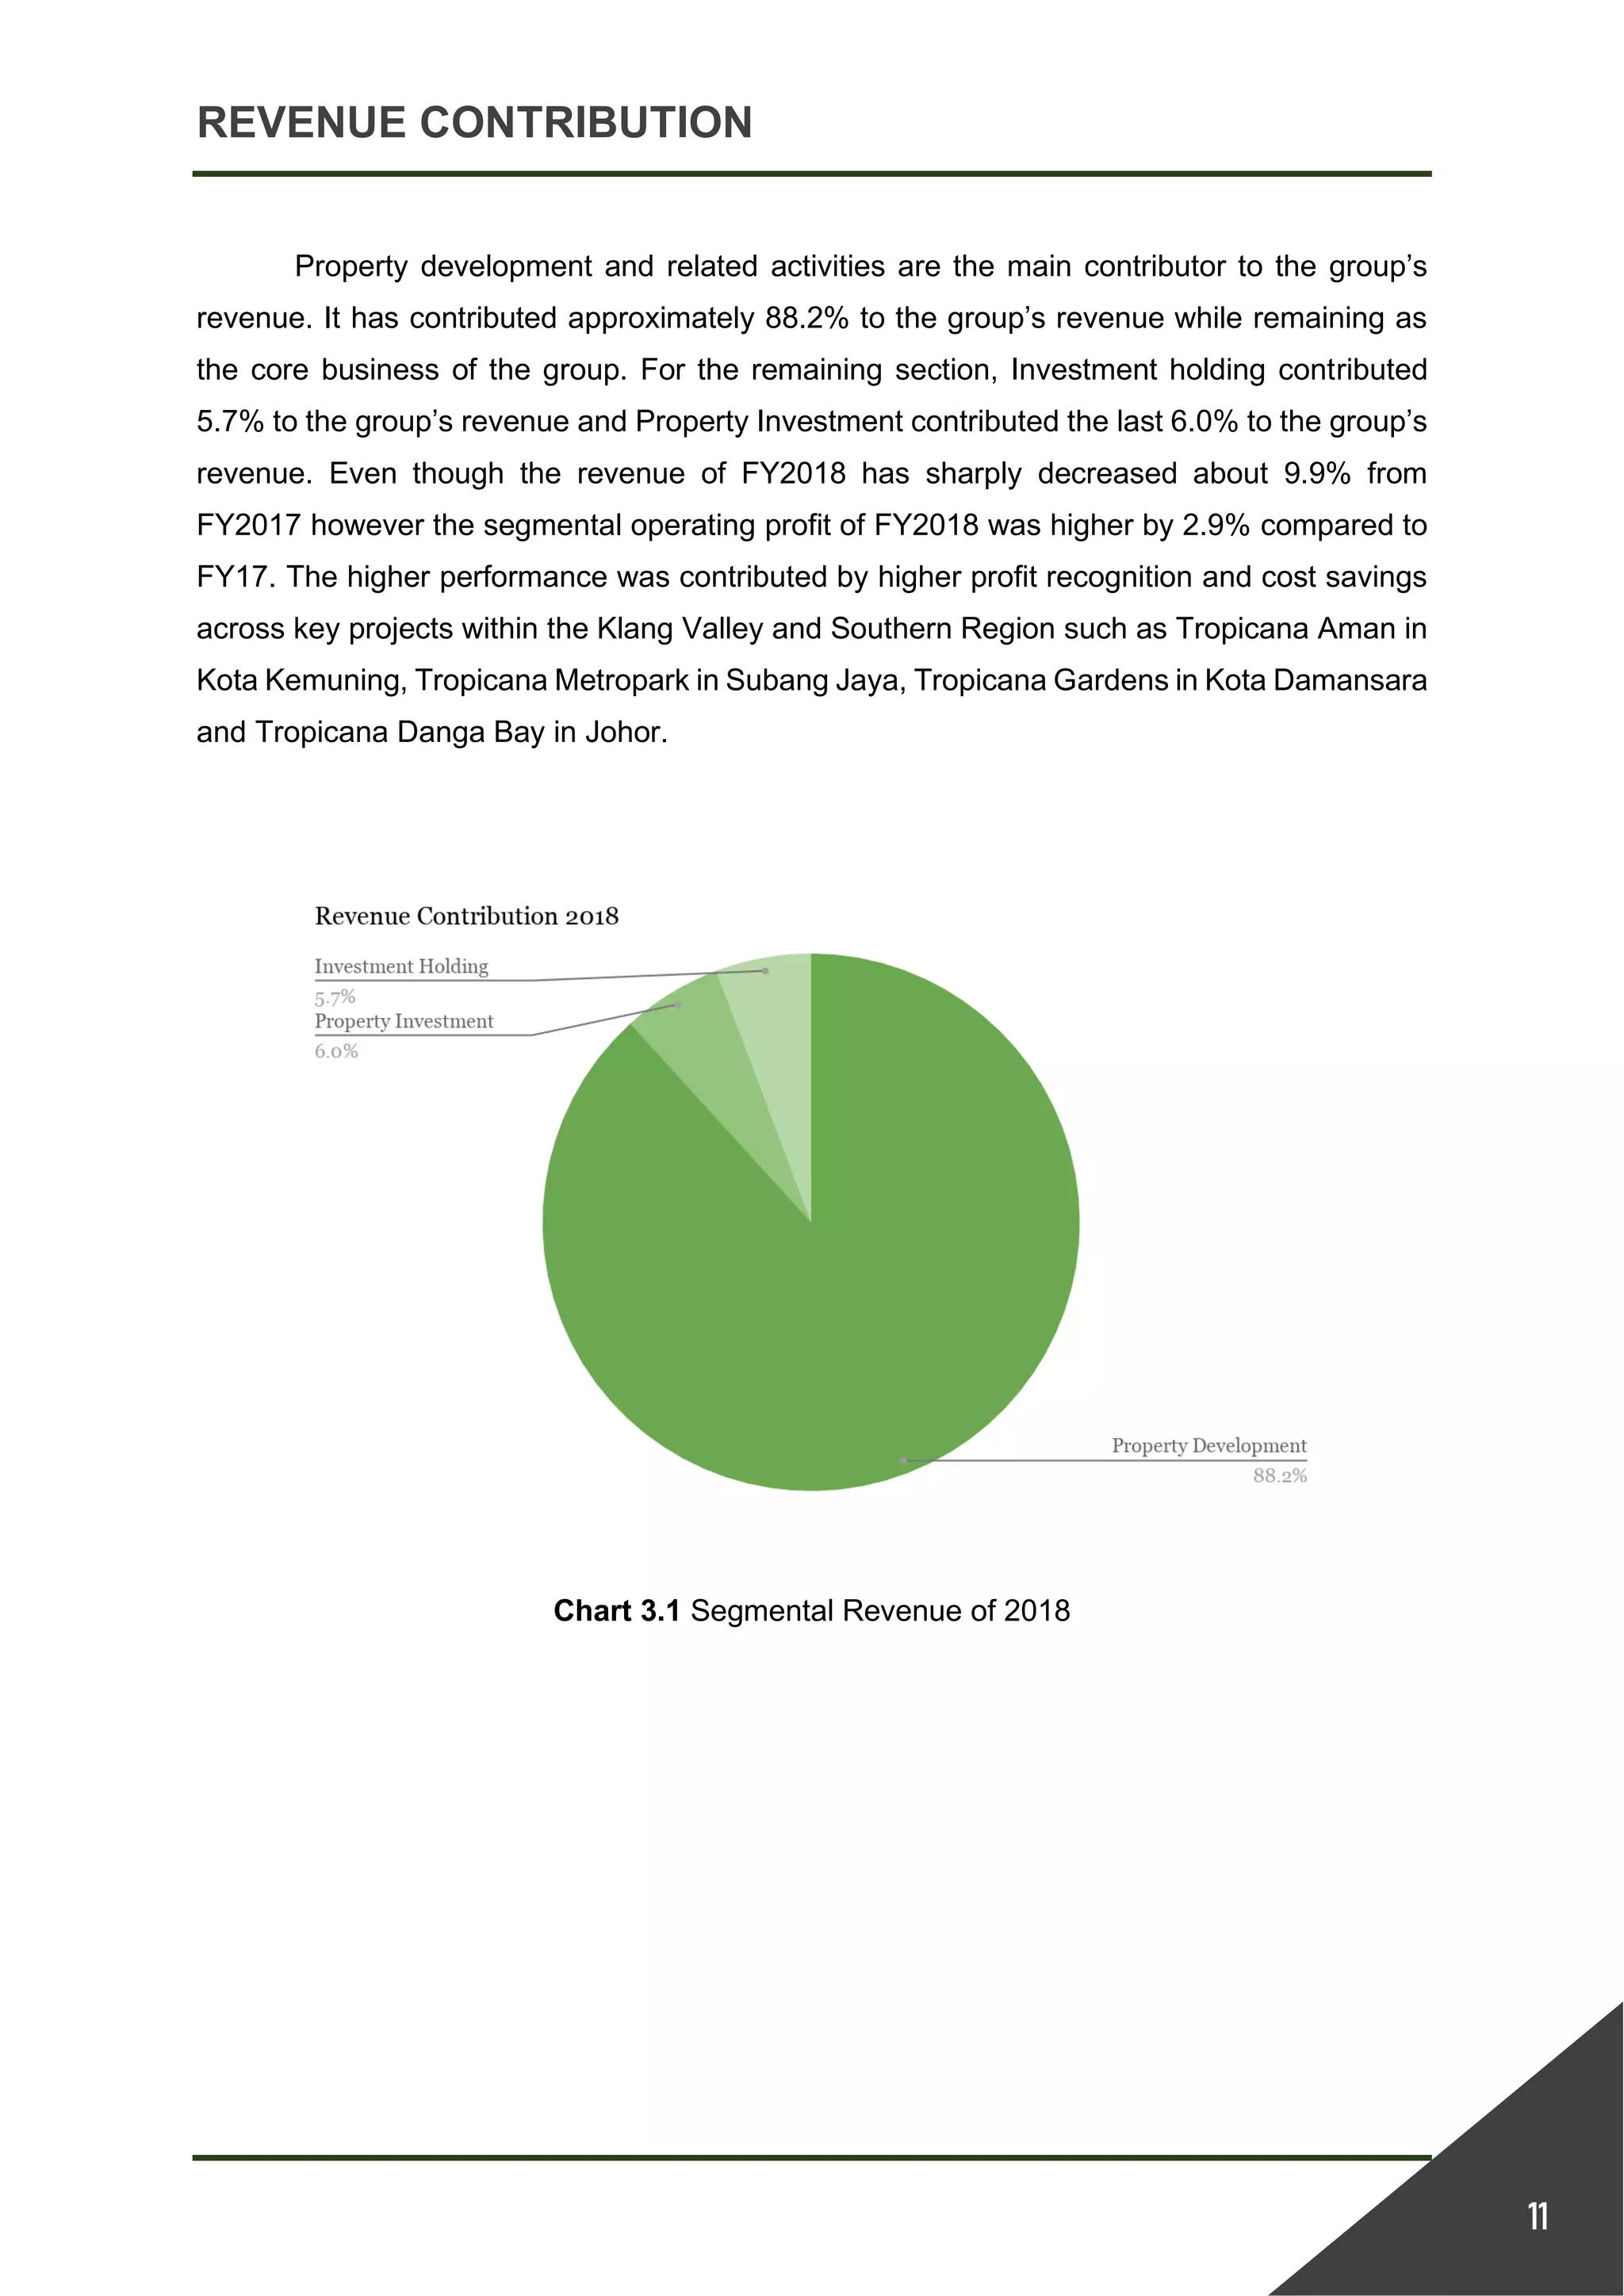
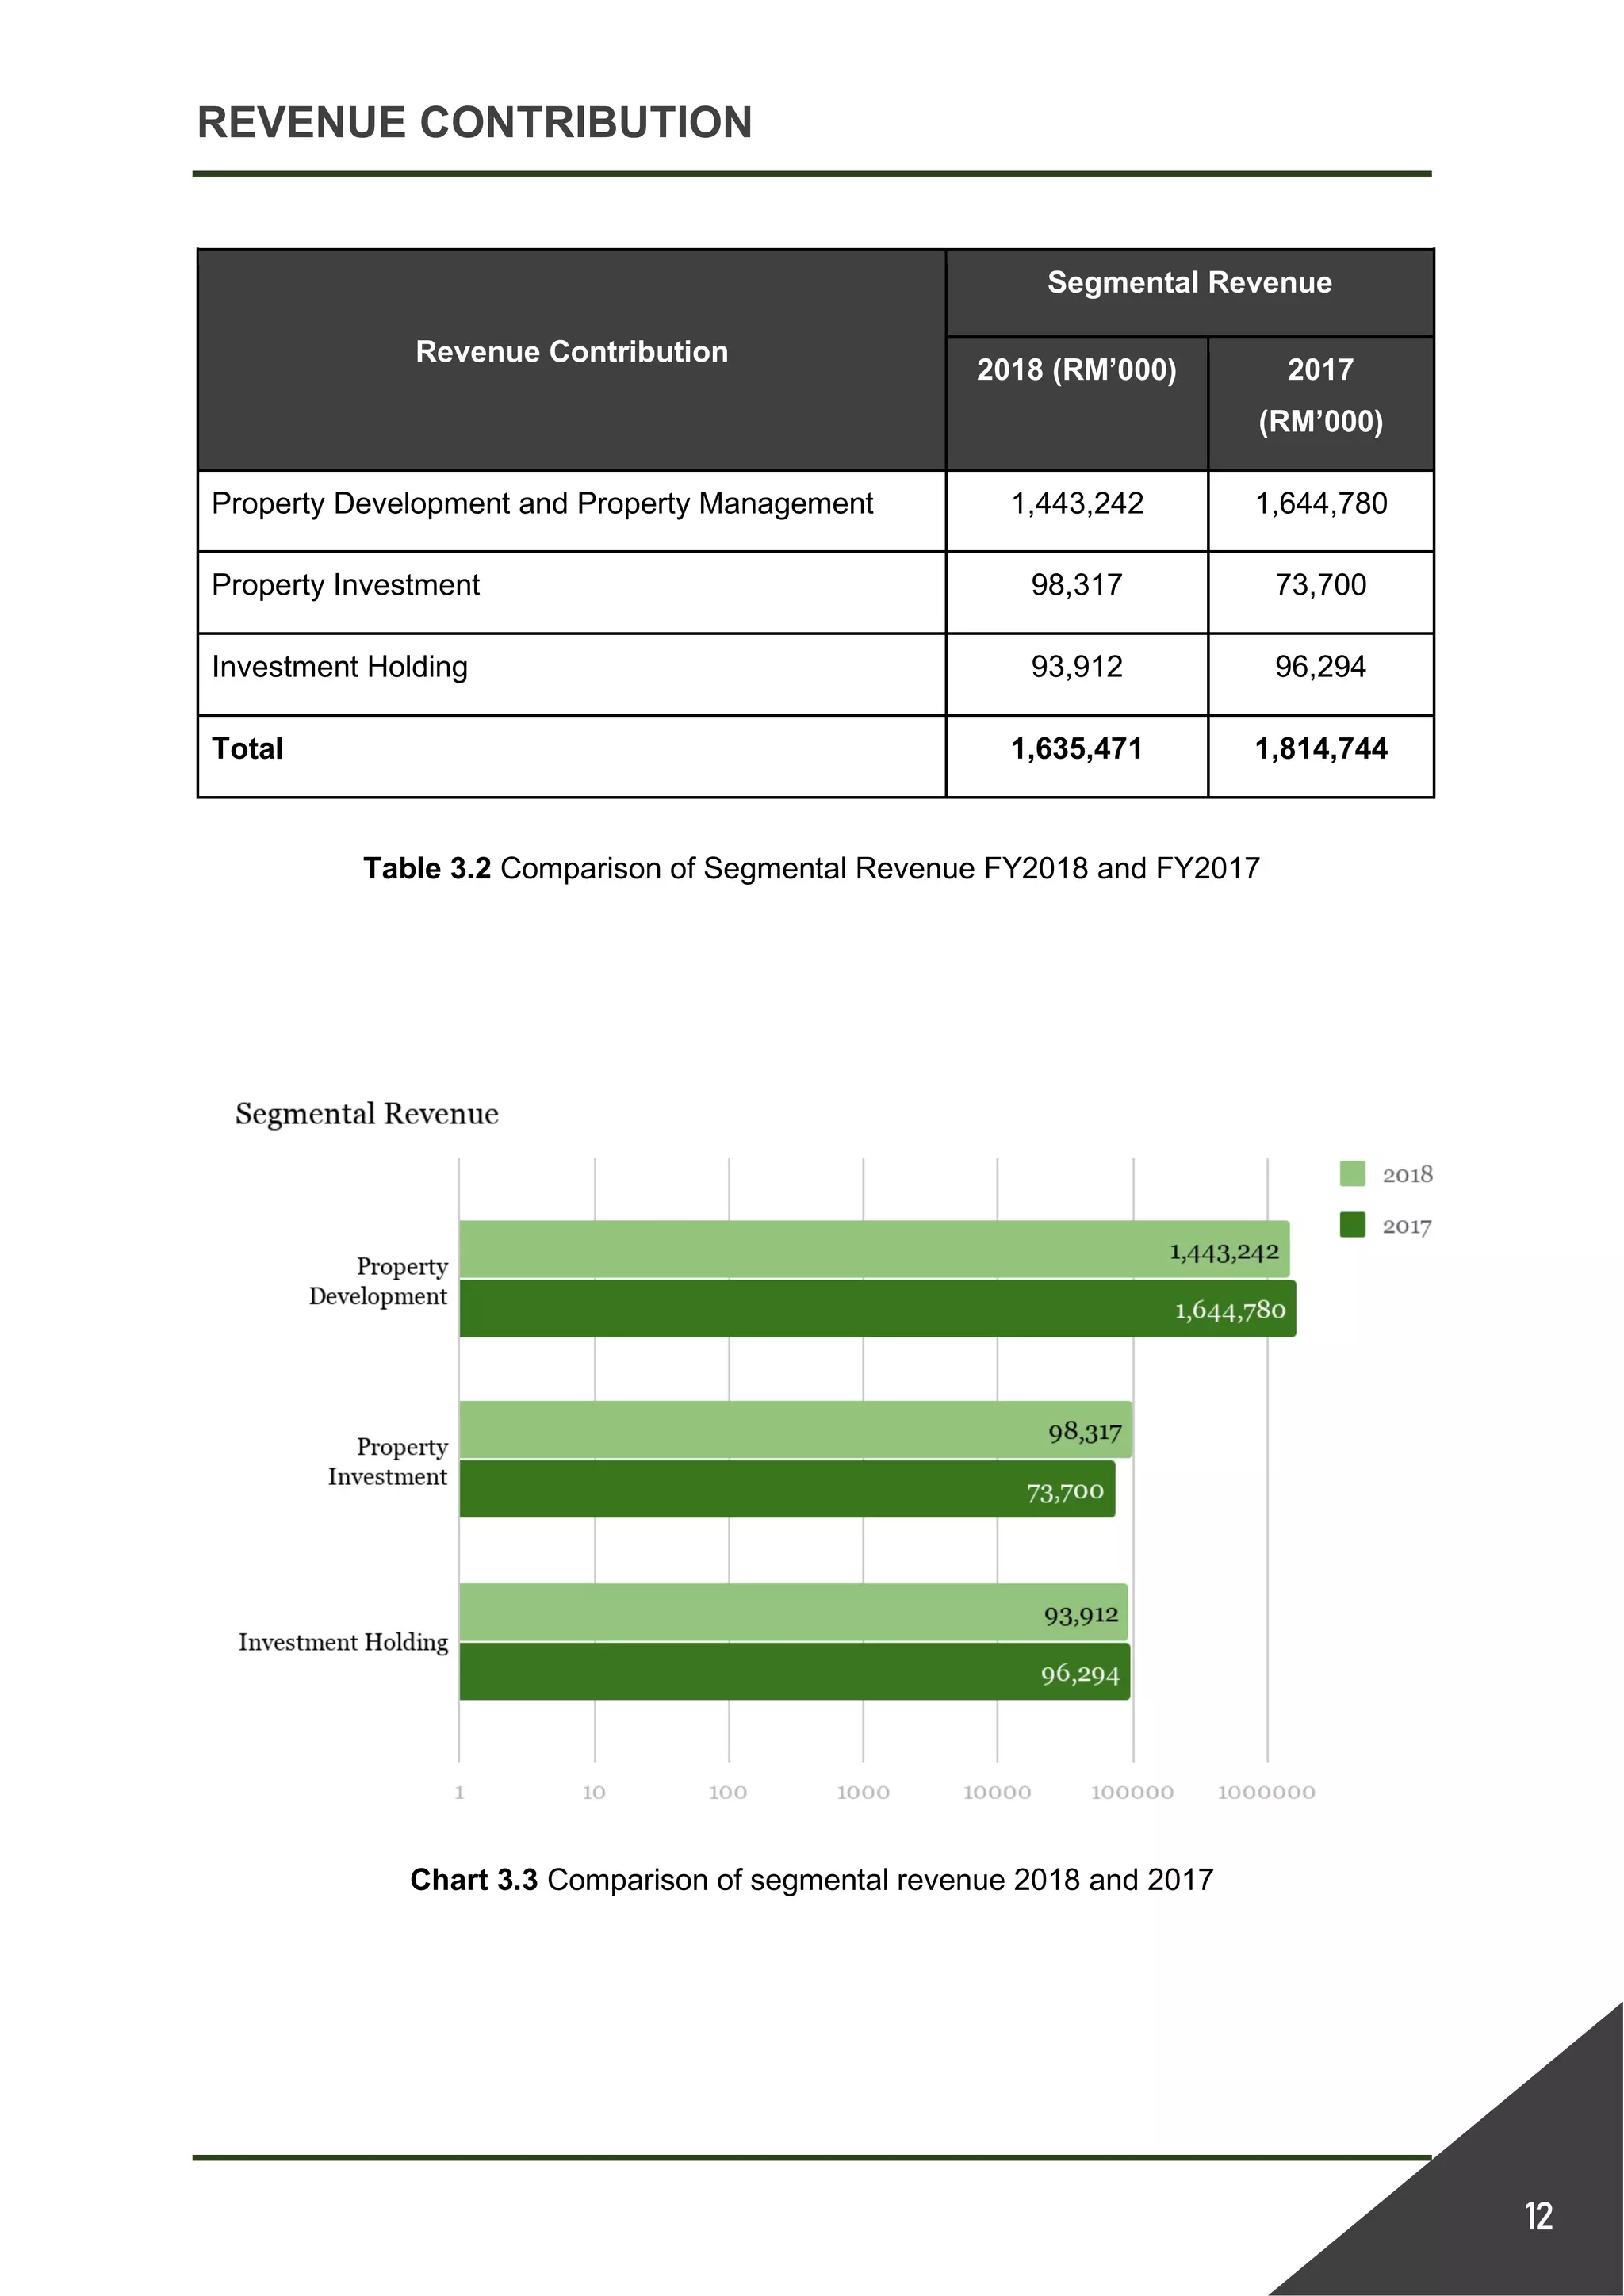
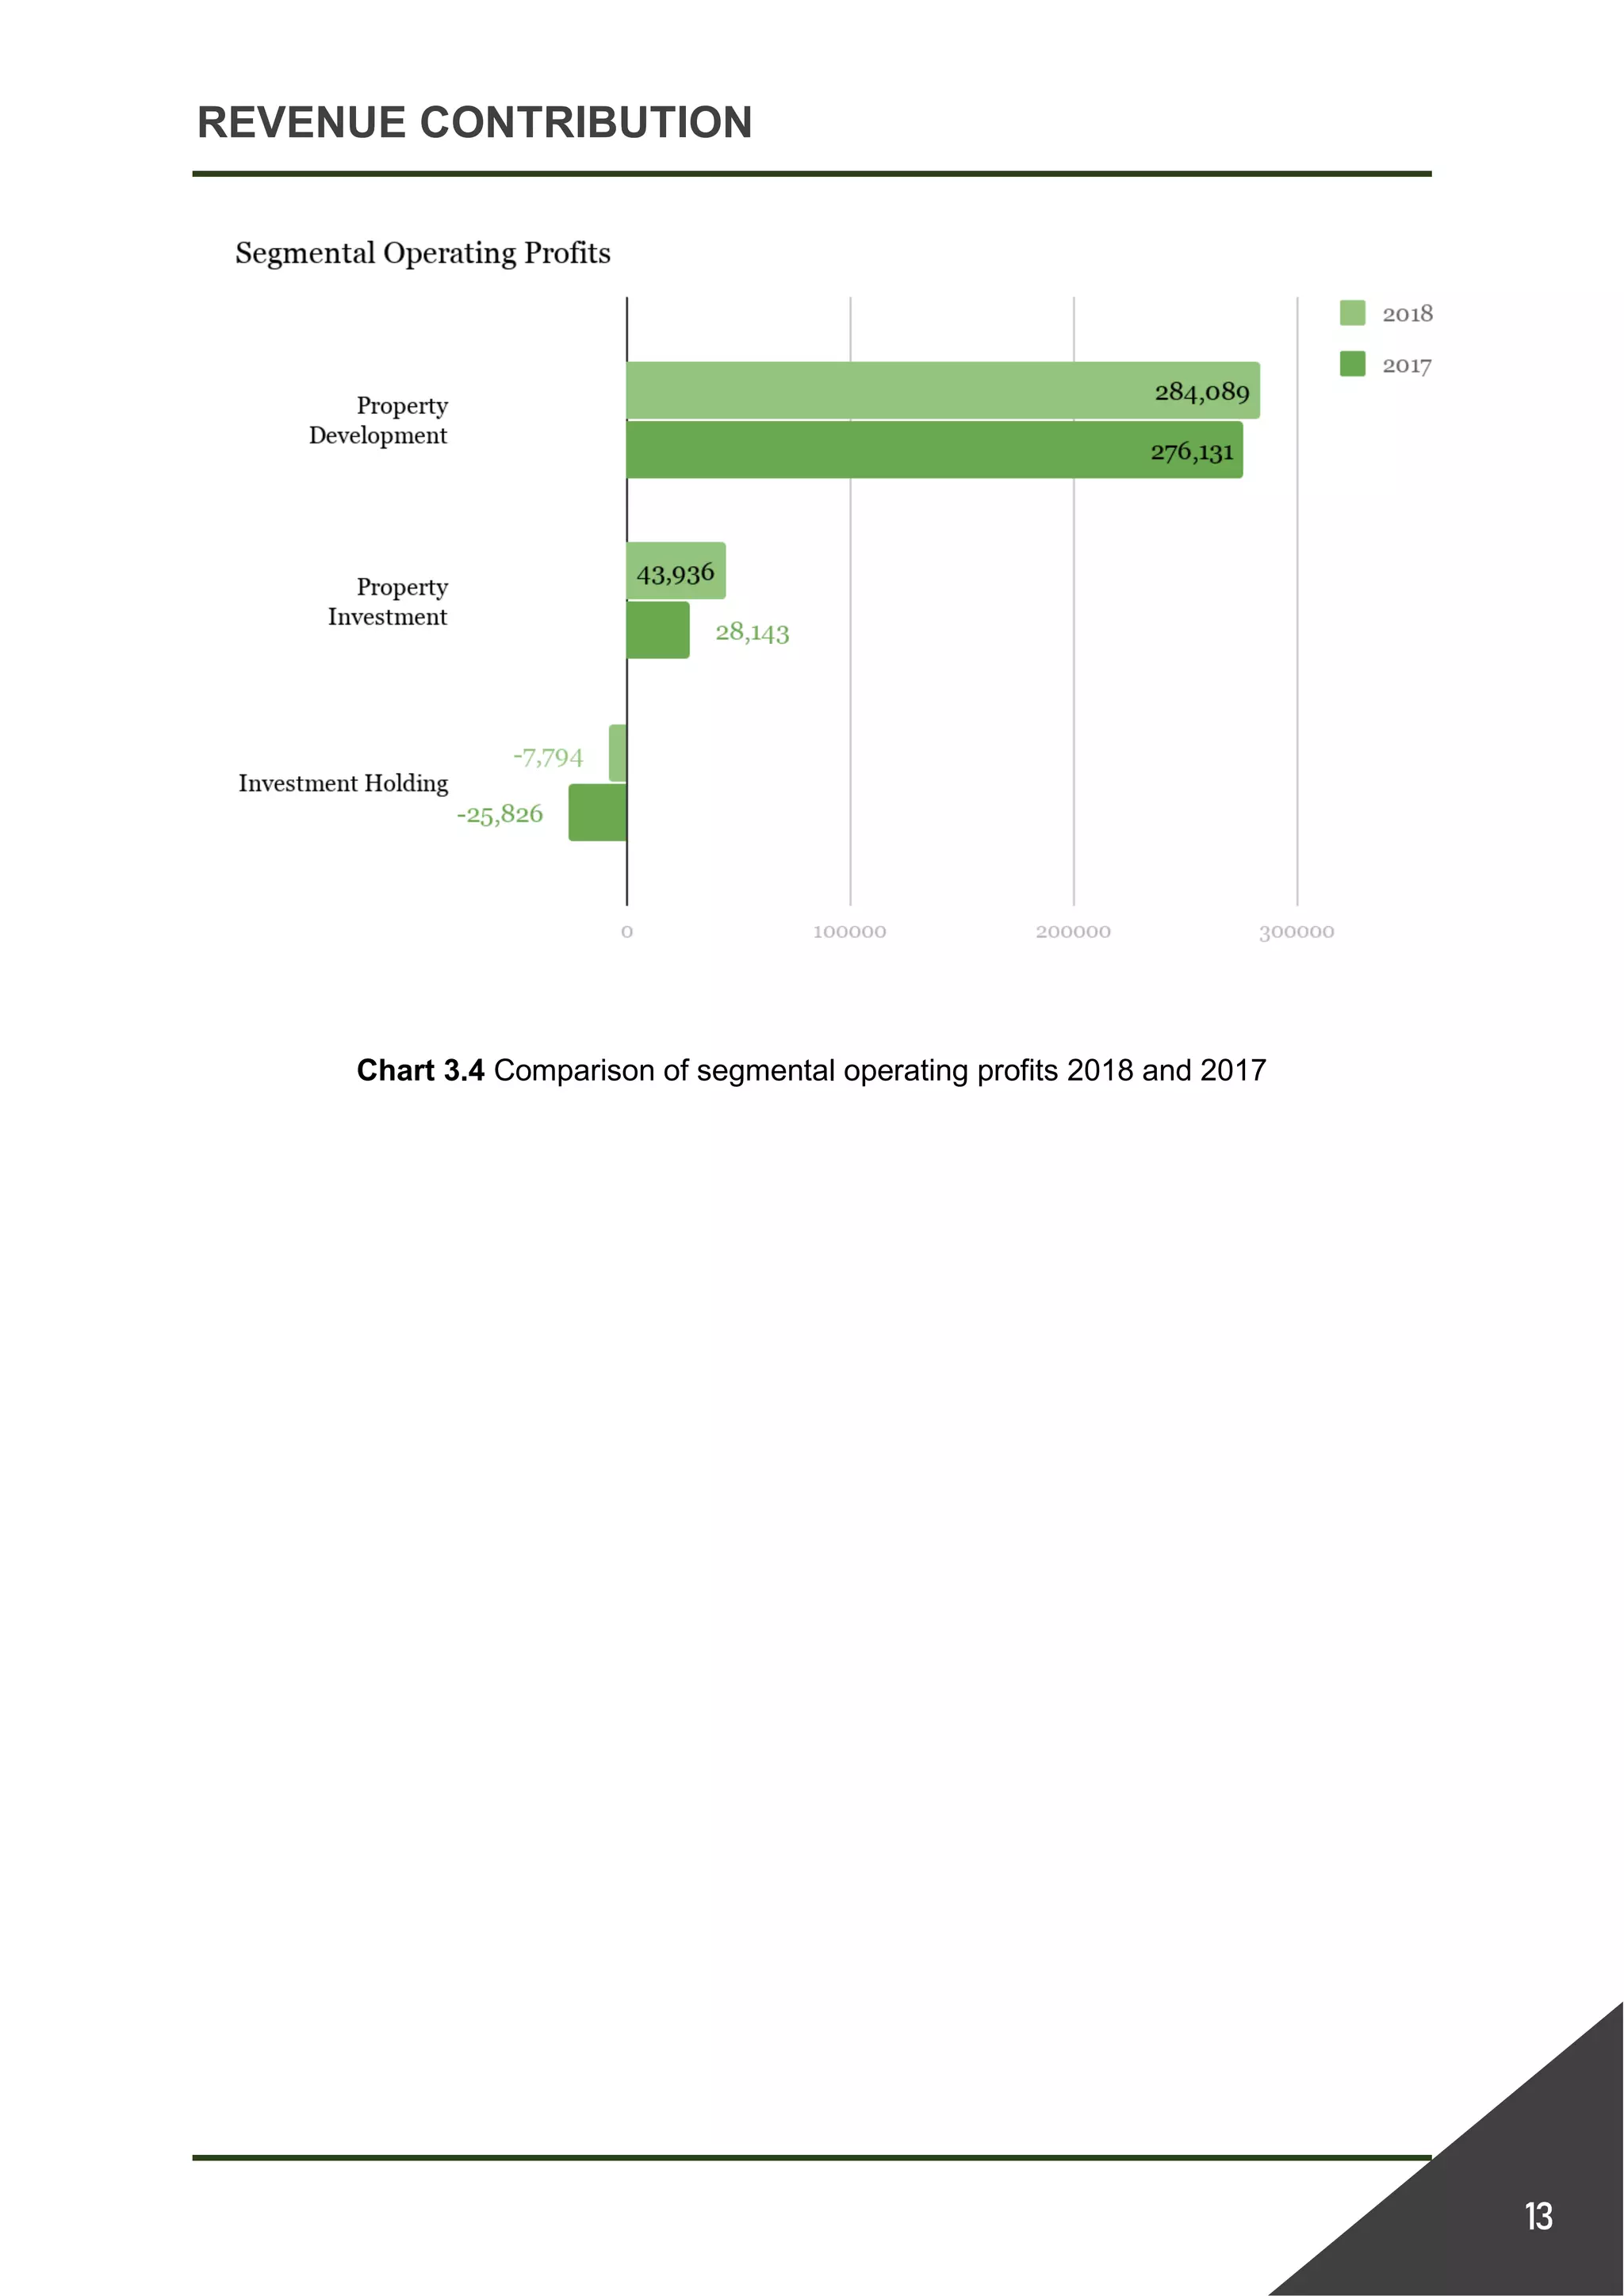
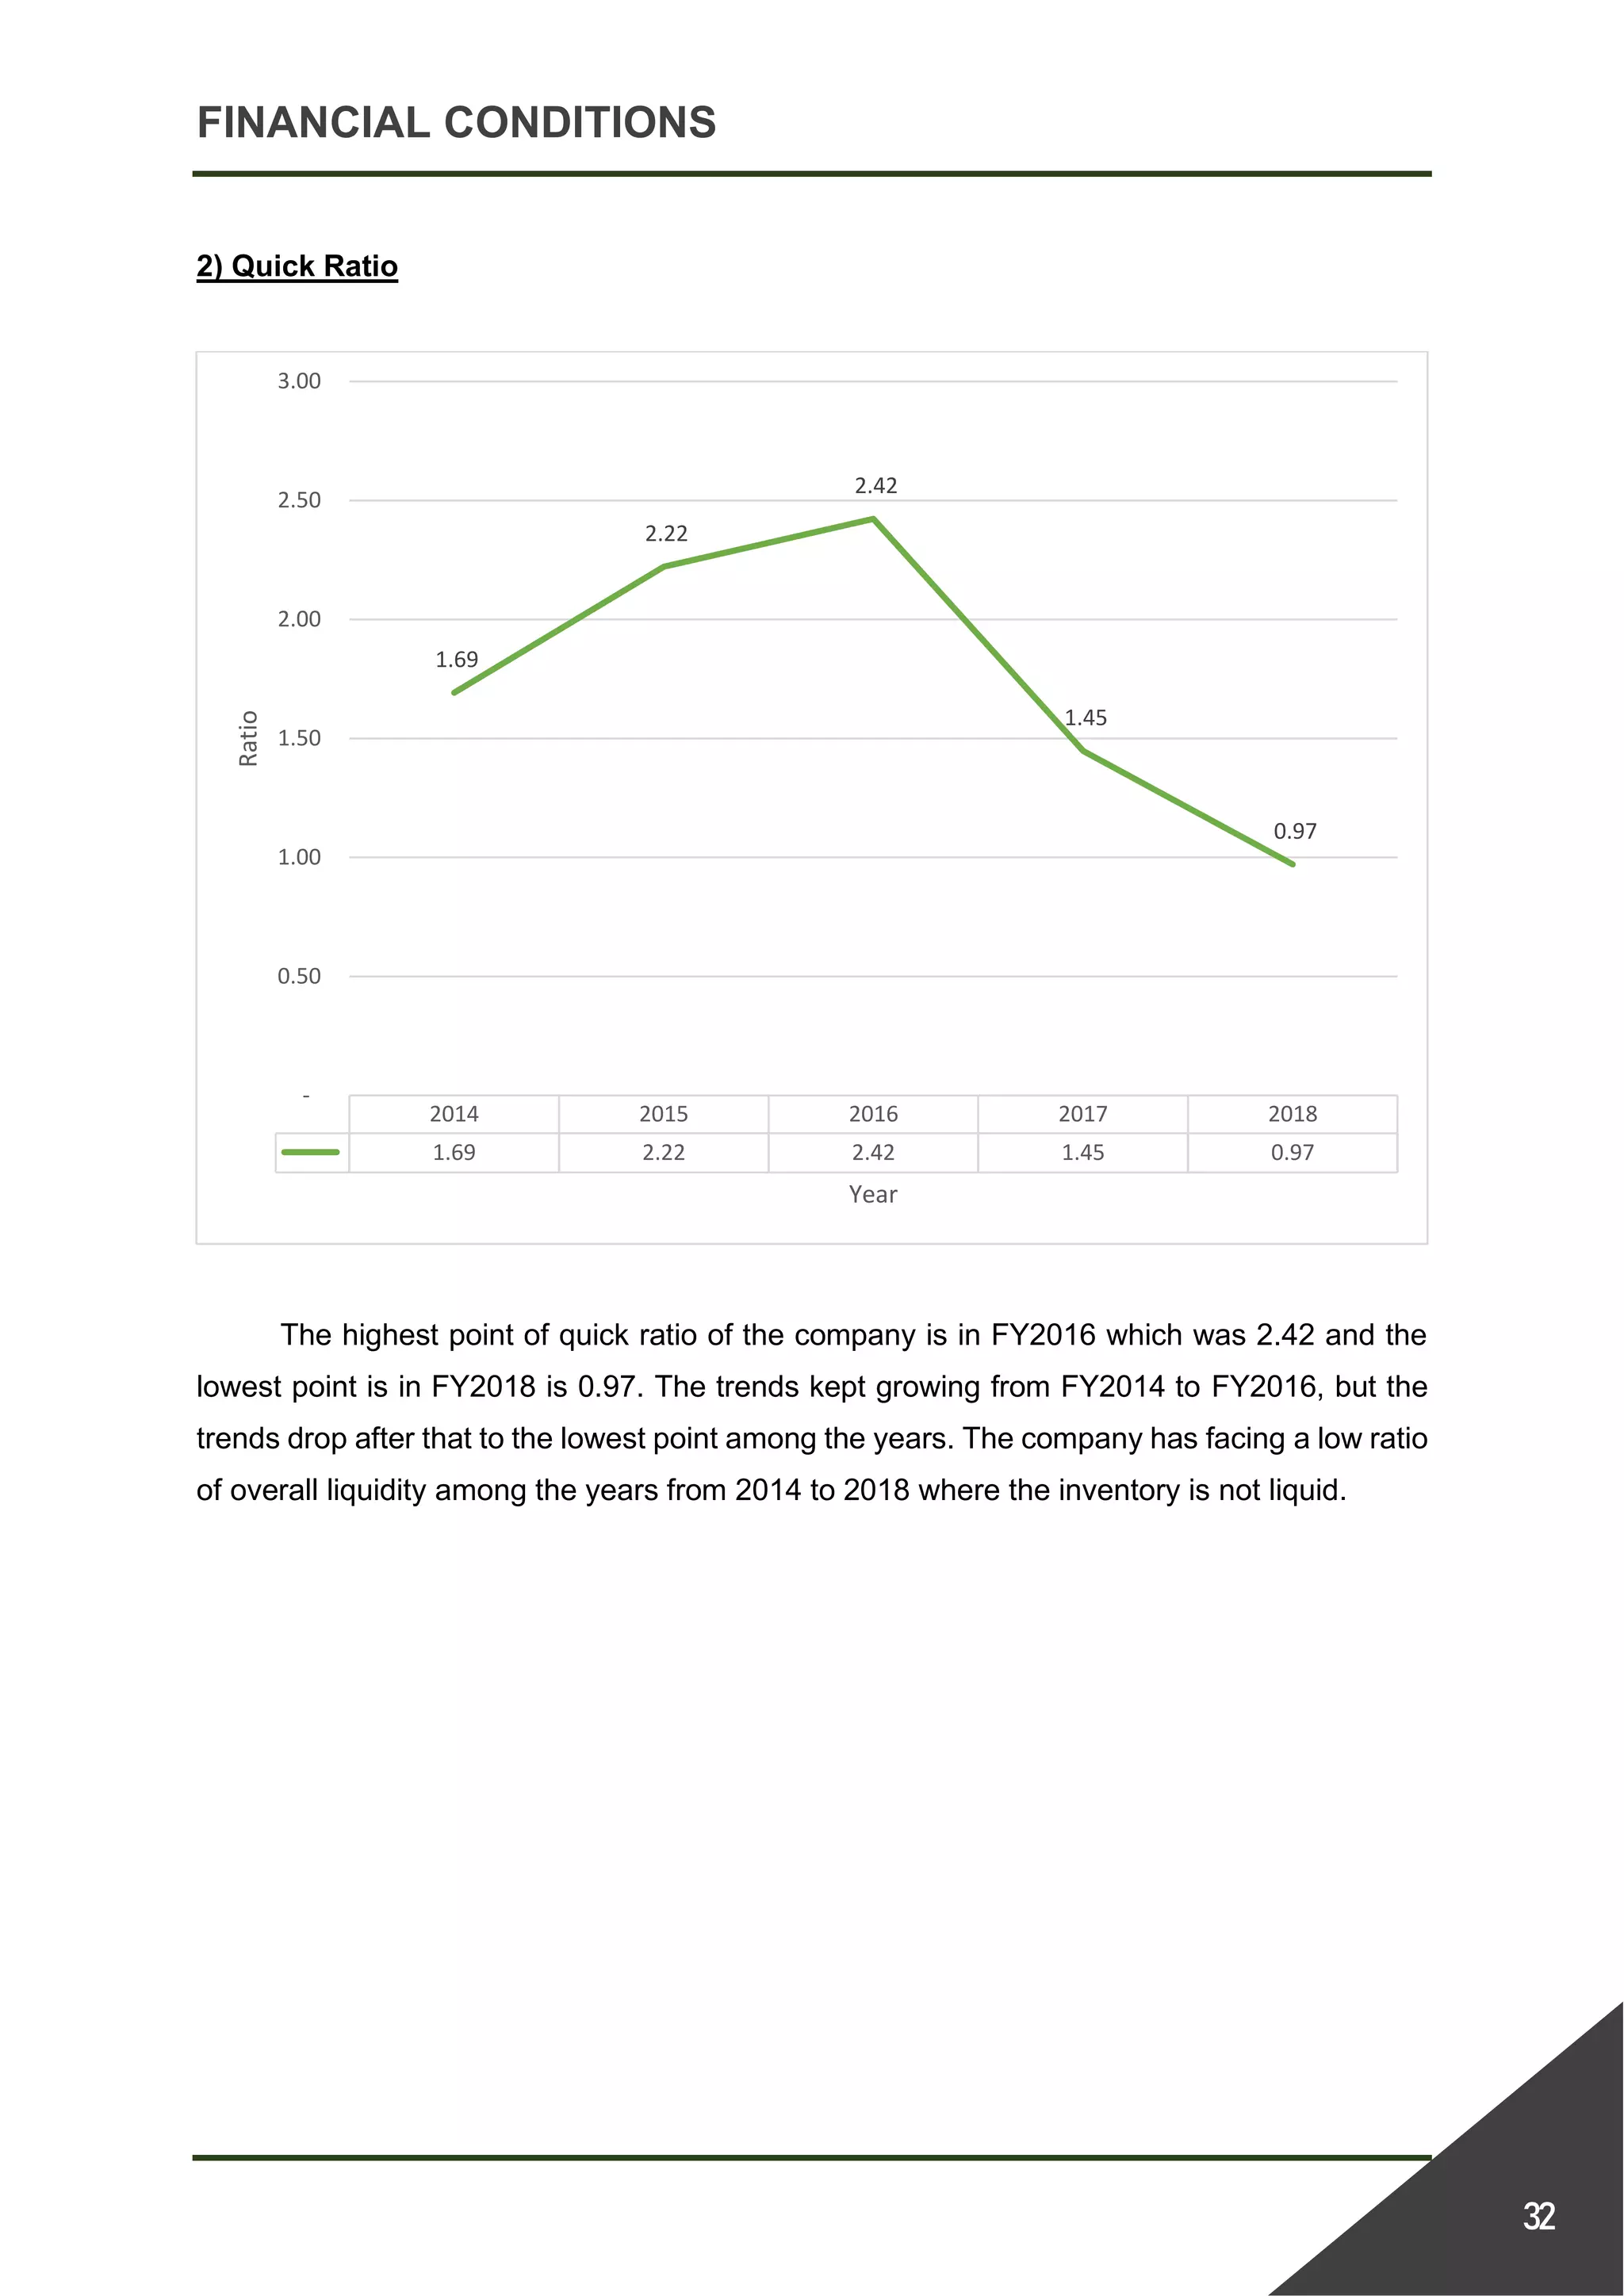
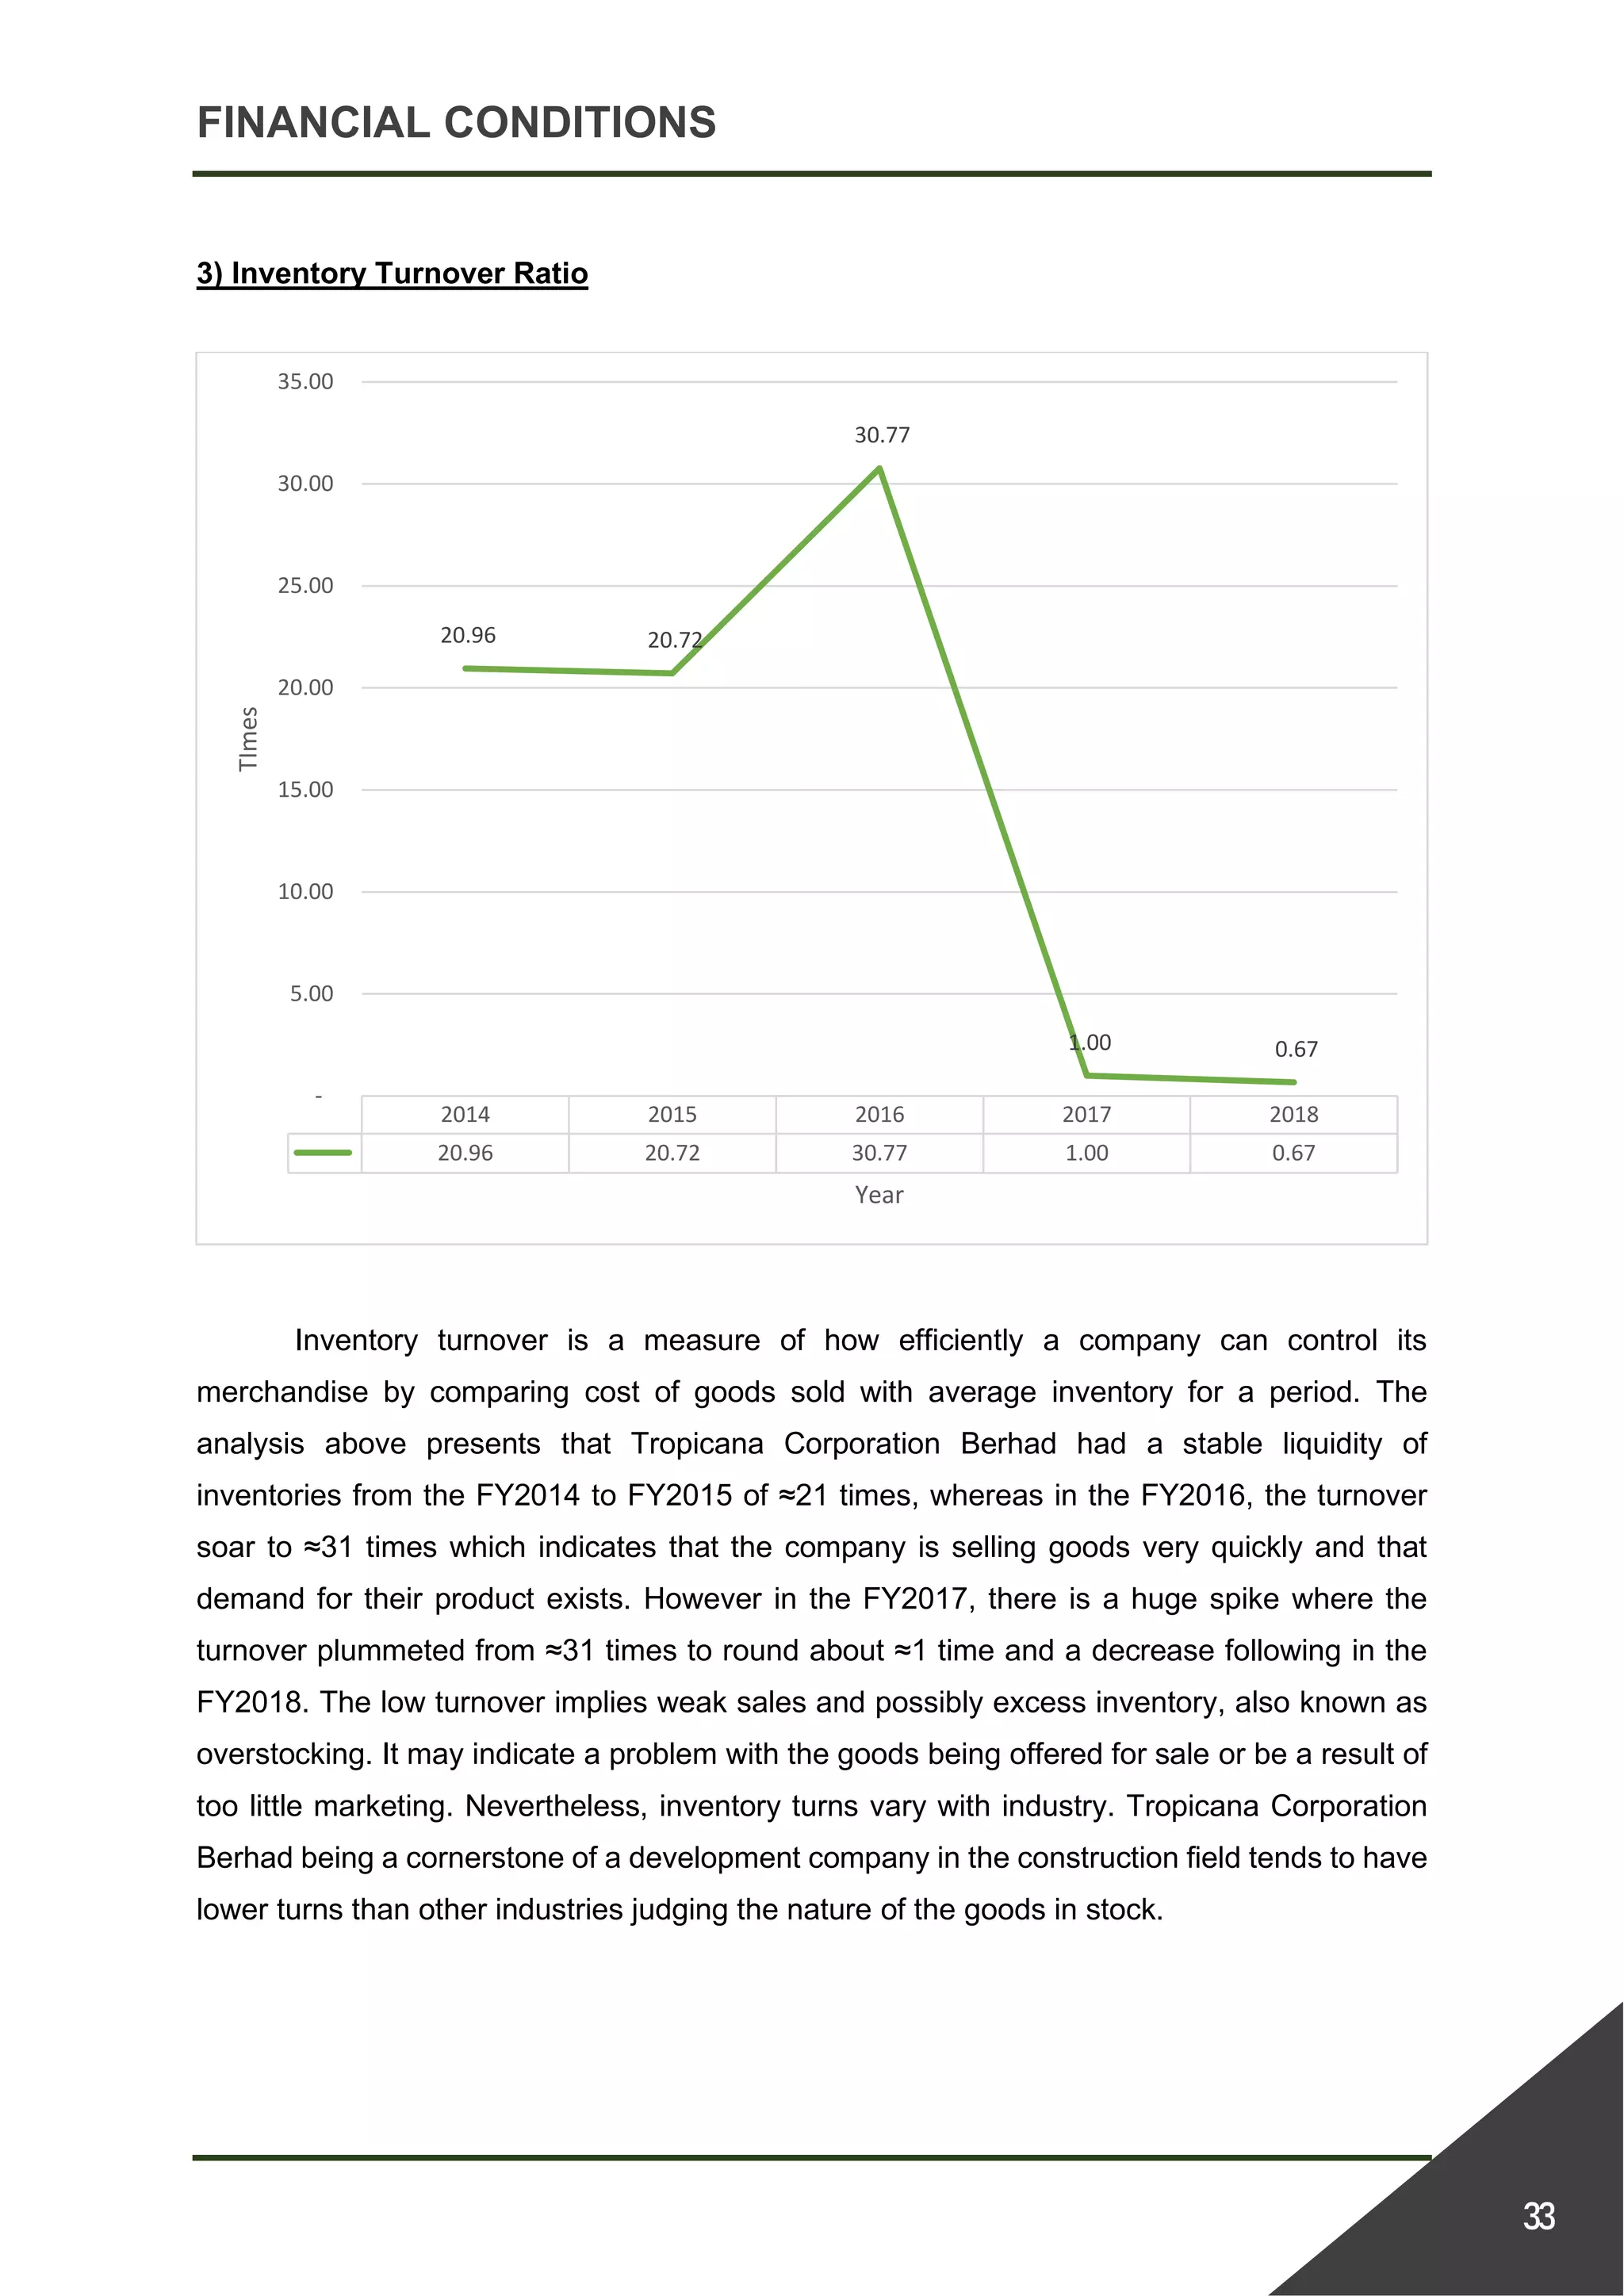
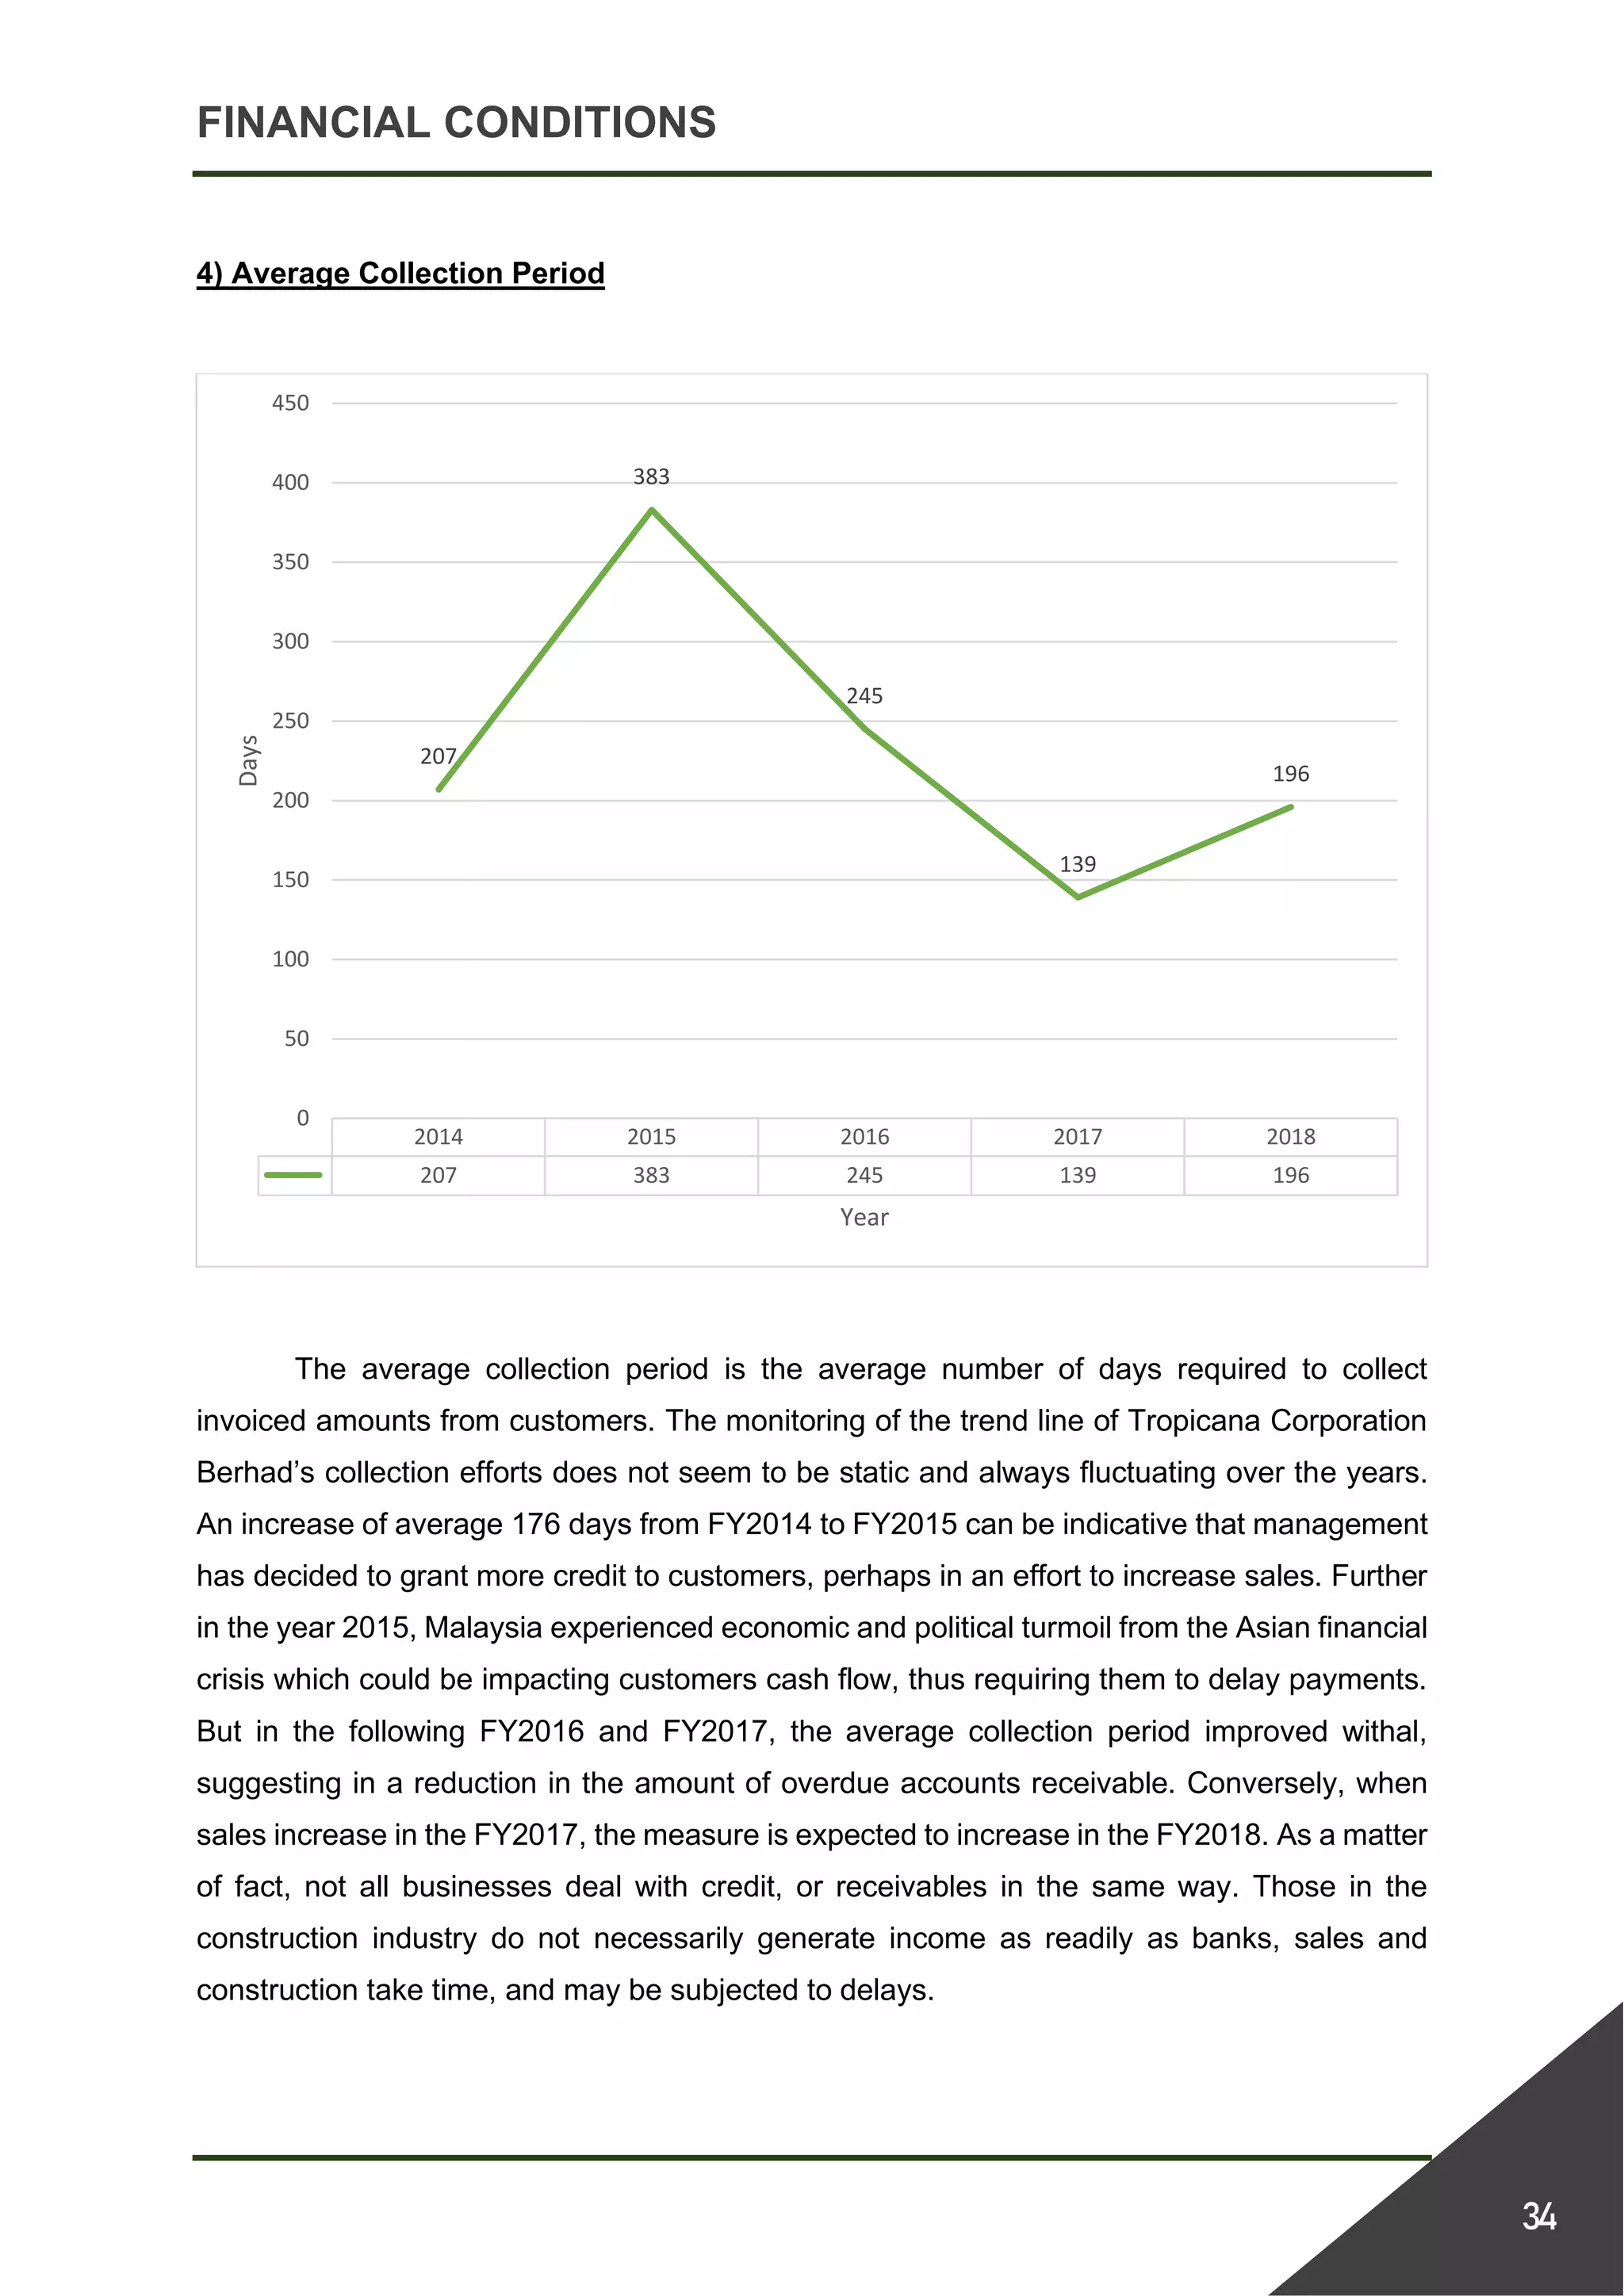
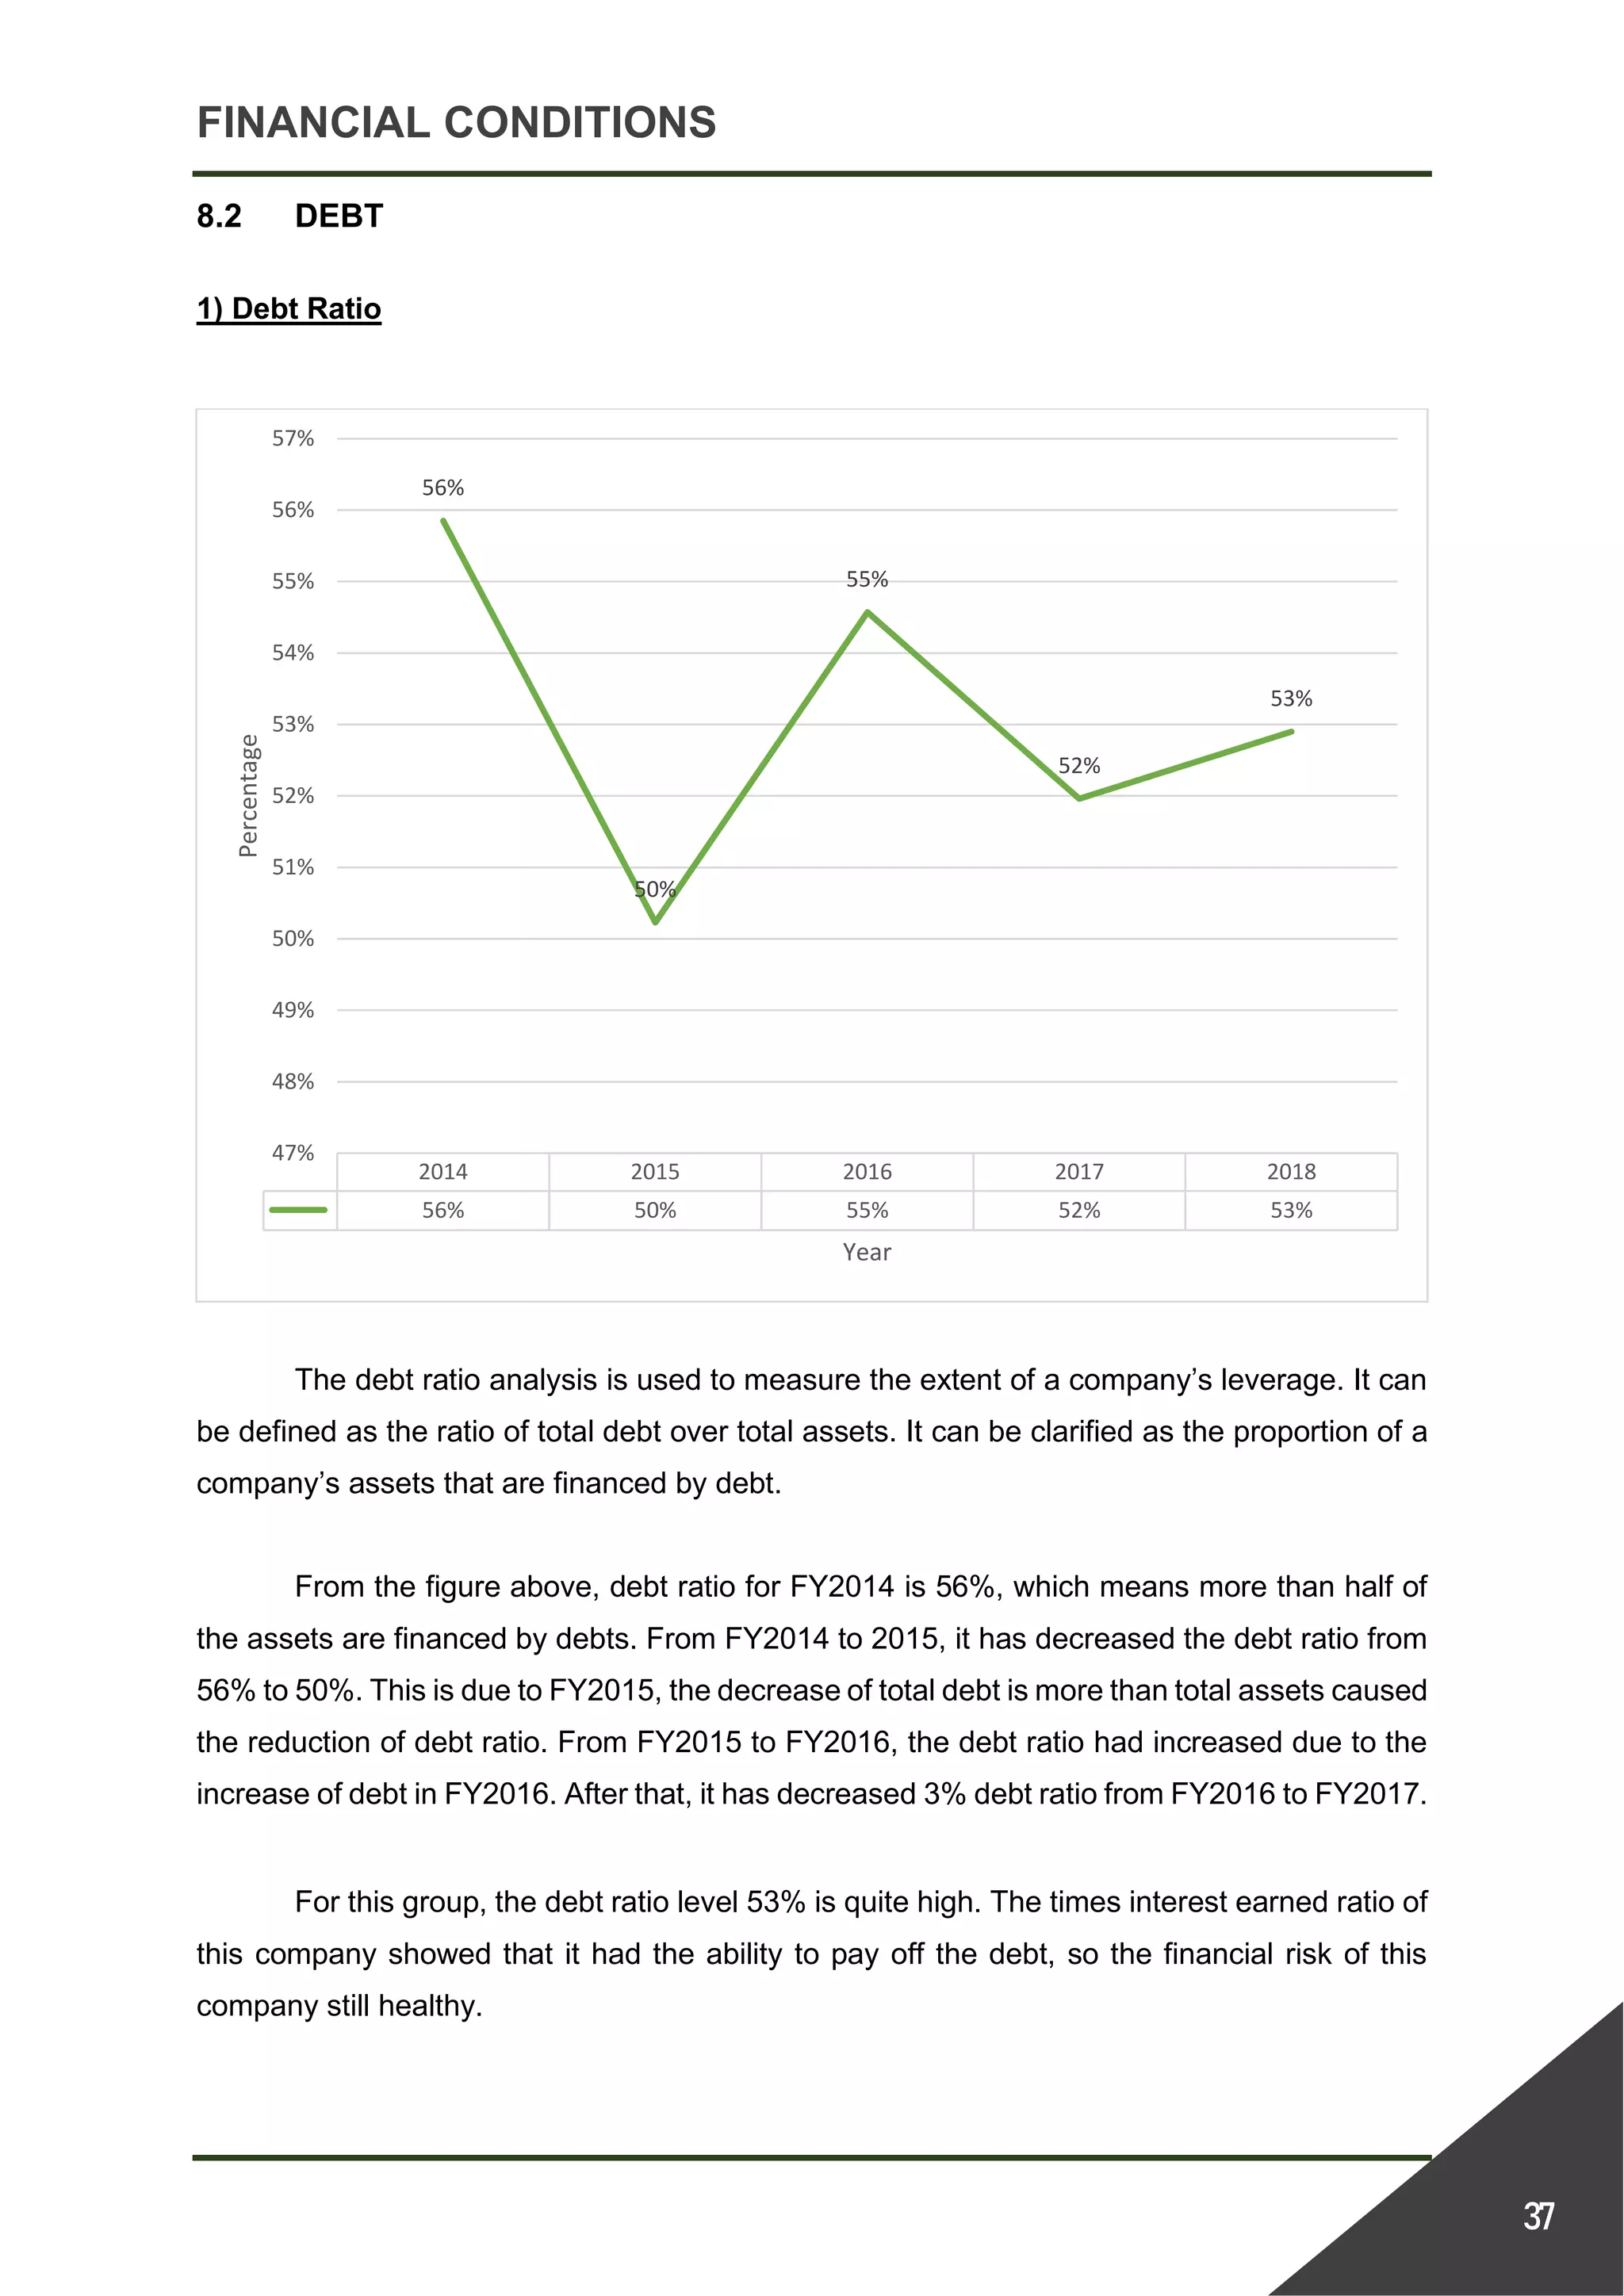
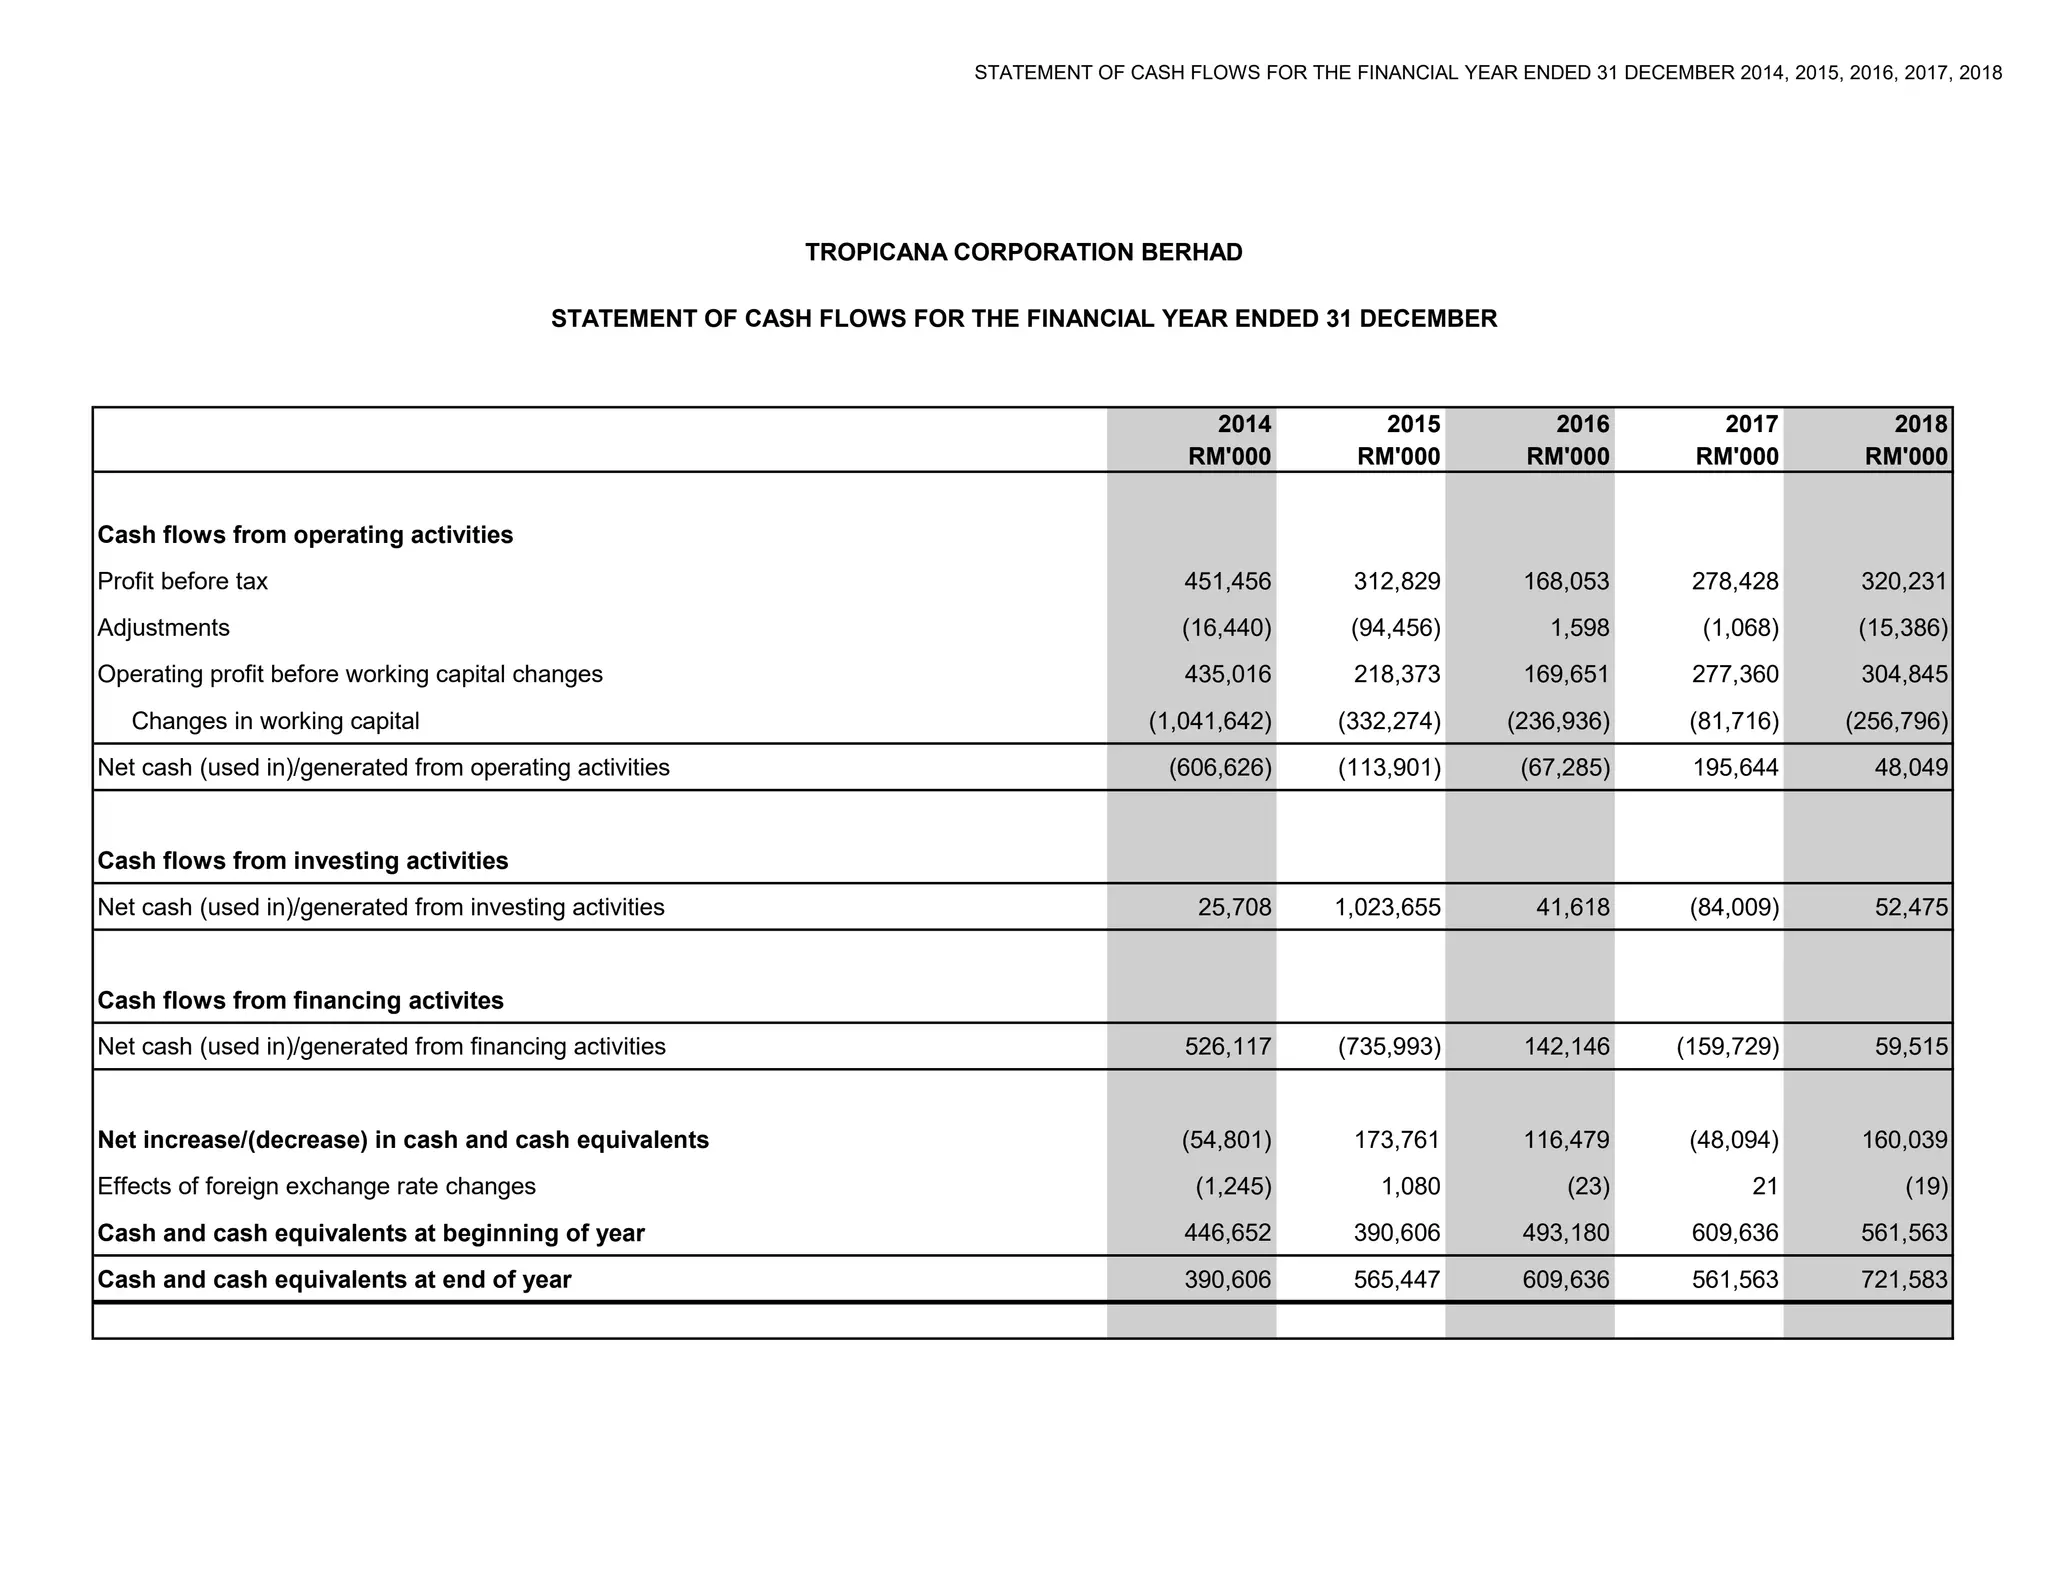
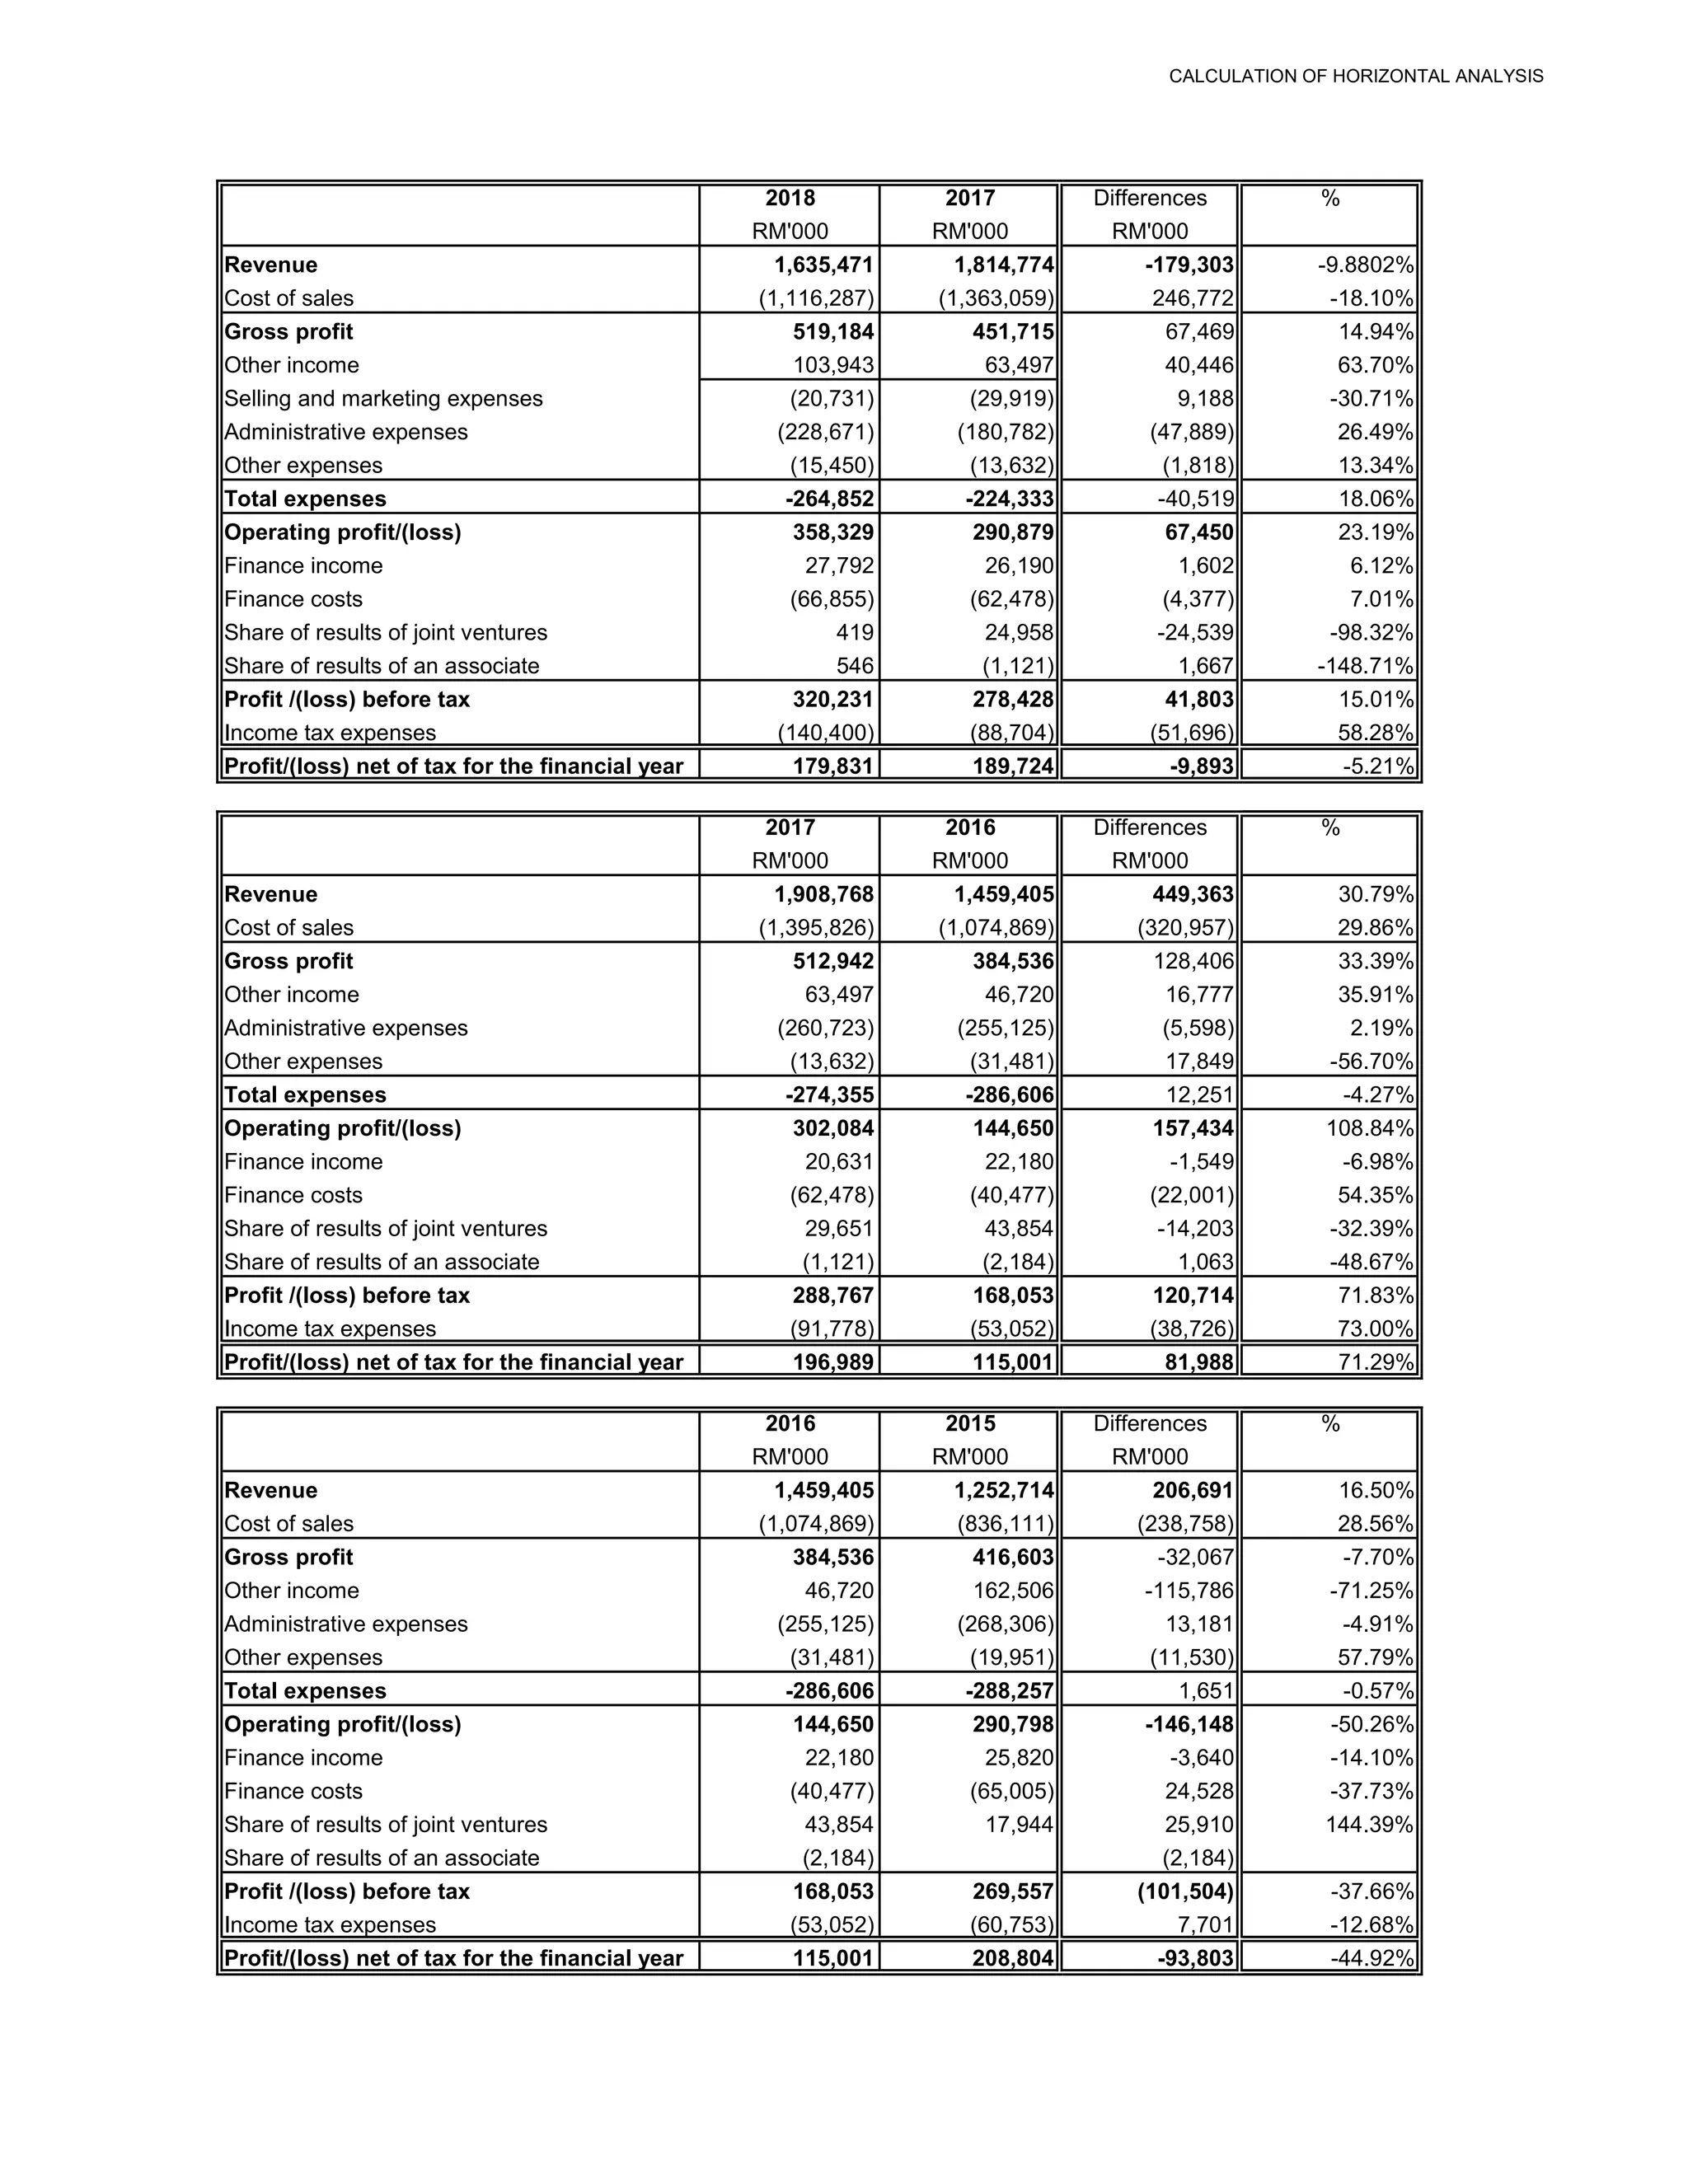
Tropicana Corporation's revenue declined 9.9% to RM1.64 billion in 2018 due to lower progress billings and sales across projects. However, pre-tax profit increased 15% to RM320.2 million due to higher profit recognition and cost savings. The company has been selling non-core assets and land since 2014 to reduce debt levels. Property development remains the core business and driver of financial performance, with over RM827 million in unbilled sales providing earnings visibility. Investment holding revenue grew slightly through investment income and private school operations.


![SUMMARY OF RATIOS FORMULA
Financial Ratio
Current Assets
Current Liabilities
Current Assets - Inventories
Current Liabilities
Costs of goods sold
Inventories
Accounts receivables
Daily credit sales
Accounts payables
Average purchase per day
Sales
Total assets
Total debt
Total assets
Operating profit
Interest expense
EBIT + Lease payments
Interest + Lease payment + [(Principal payment + Preferred stock dividents)/(1-T)]
Gross profit
Sales
Operating profit
Sales
Net profit
Sales
Net profit
Total assets
Net profit
Total common equity
Net profit
No. of shares of common stock outstanding
Market price per share
Earnings per share
Market price per share
Equity book value per share
Net profit margin
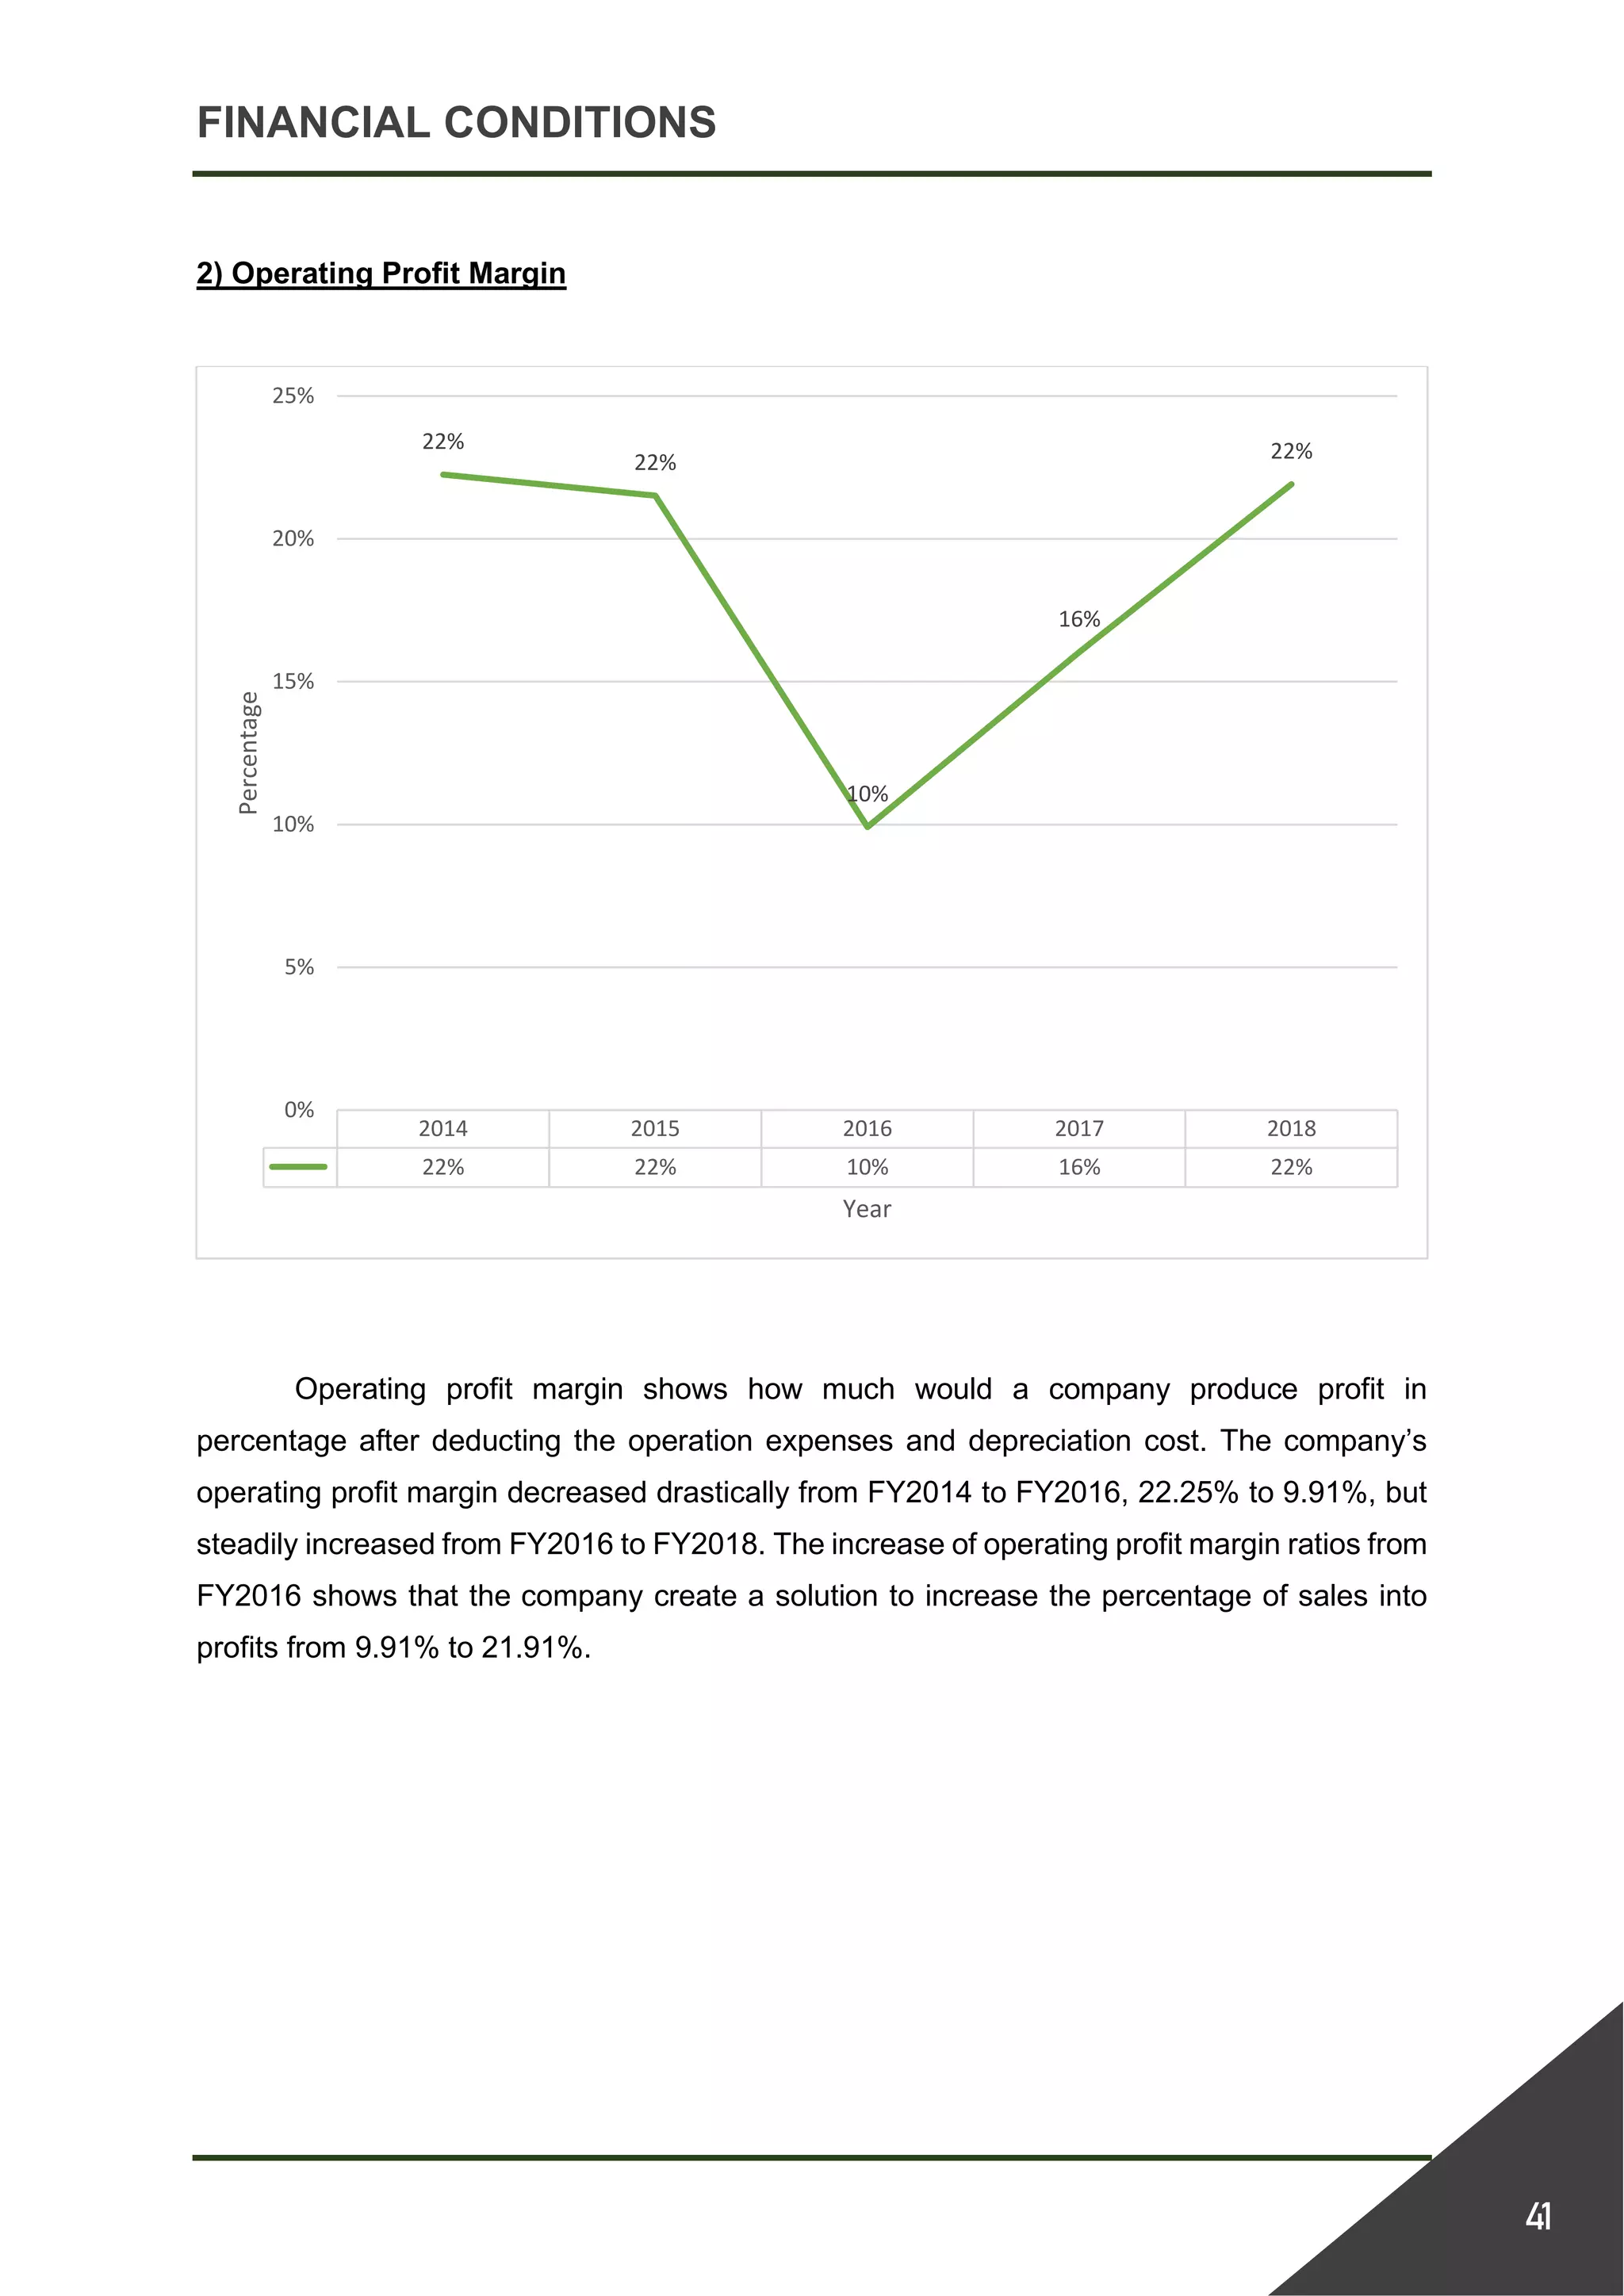
Operating profit margin
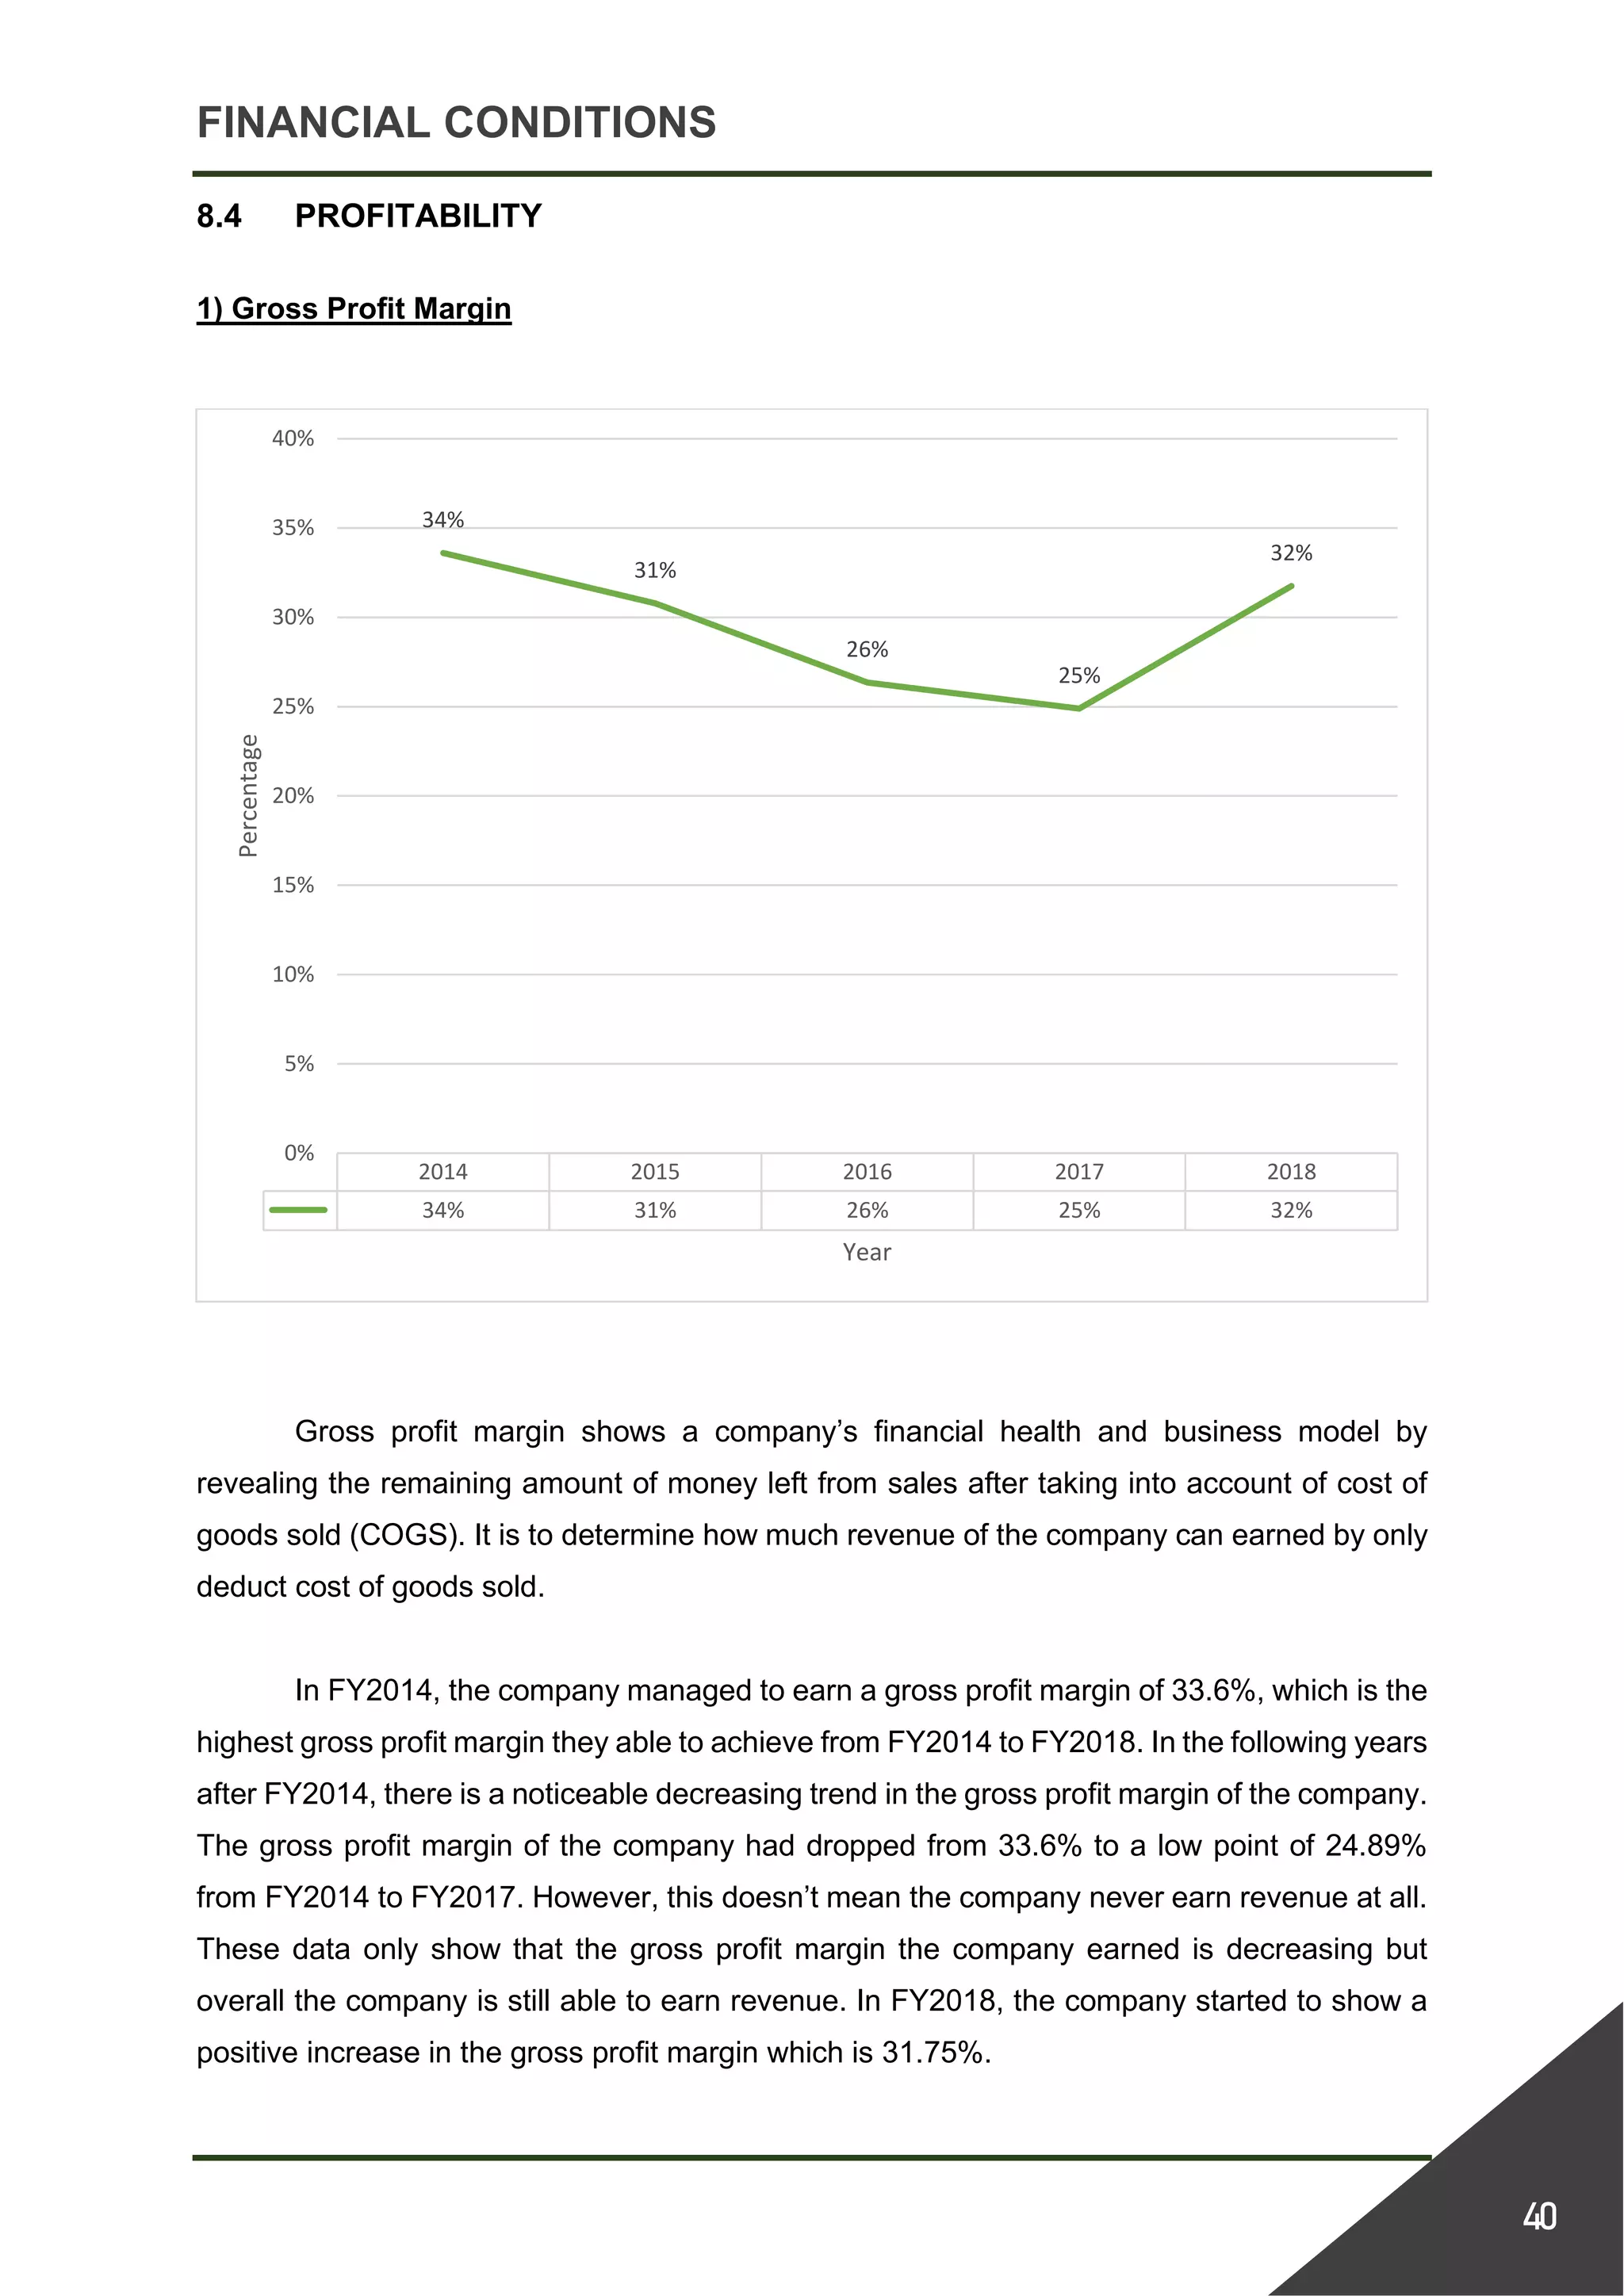
Gross profit margin
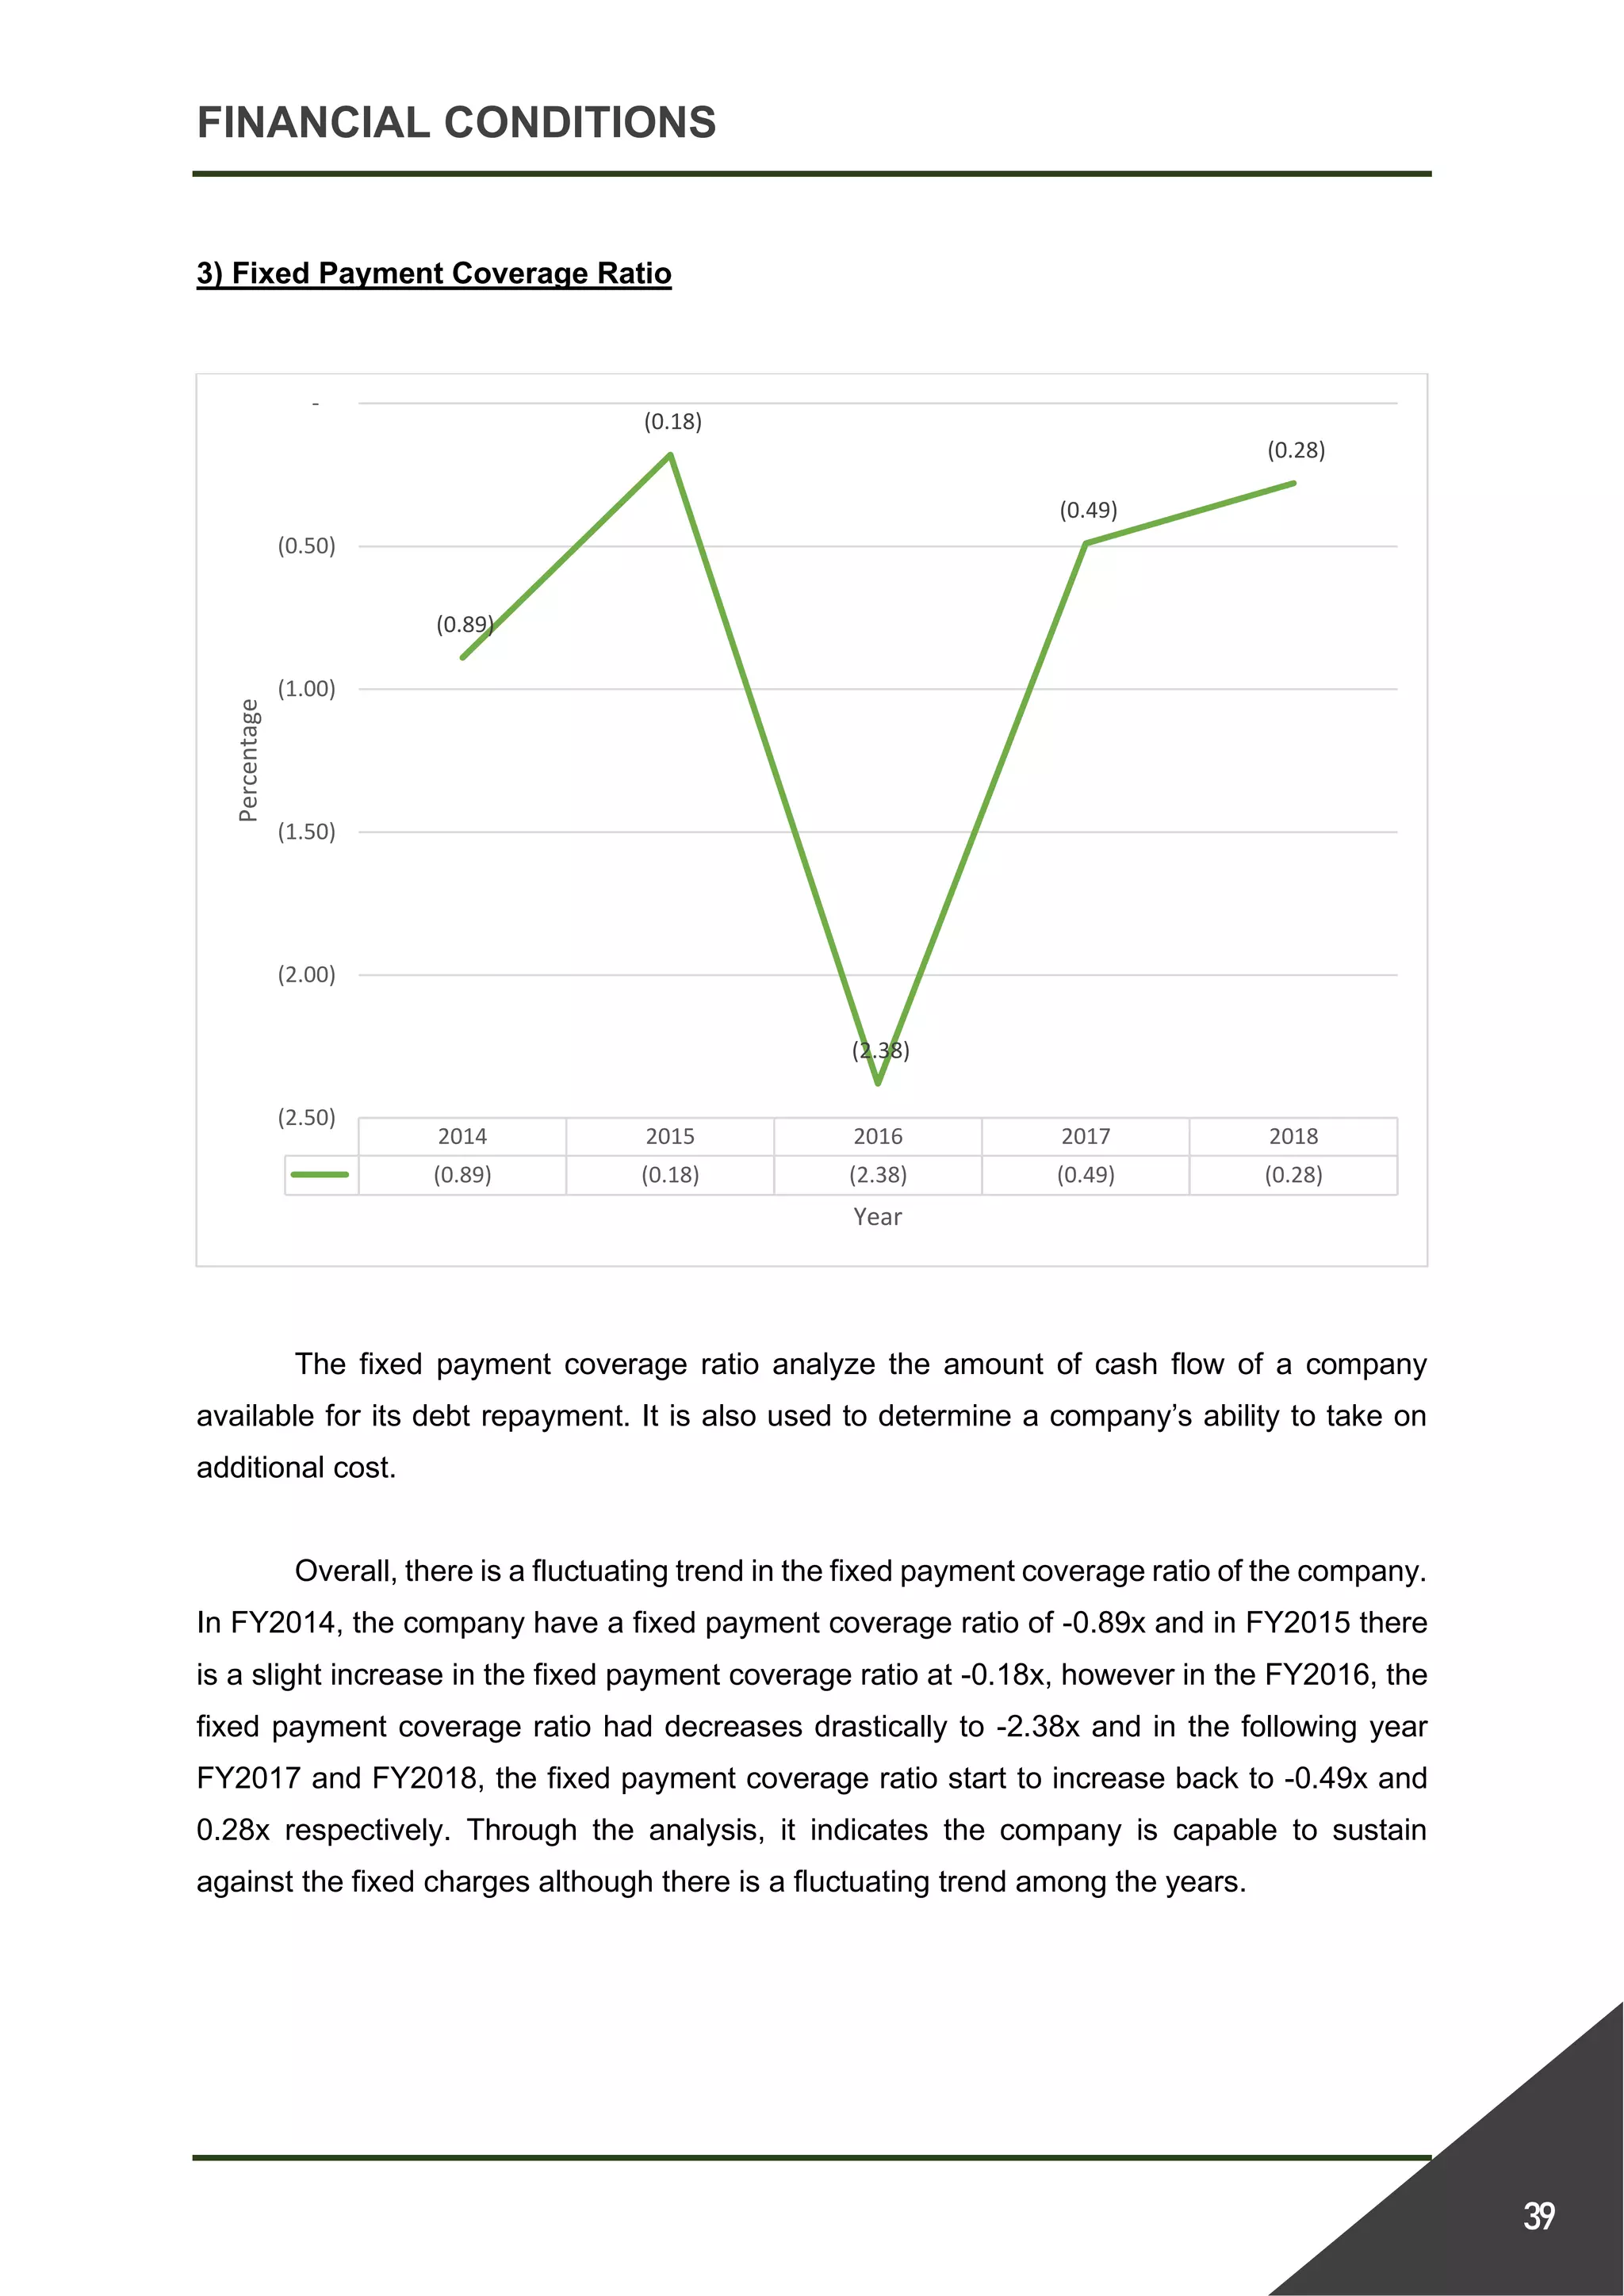
Fixed payment coverage ratio (FPCR)
Price/Book ratio (P/B)
Price/Earnings (P/E)
Earnings per share (EPS)
Return on common equity (ROE)
Return on total assets
Quick ratio
Current ratio
RATIOS FORMULA
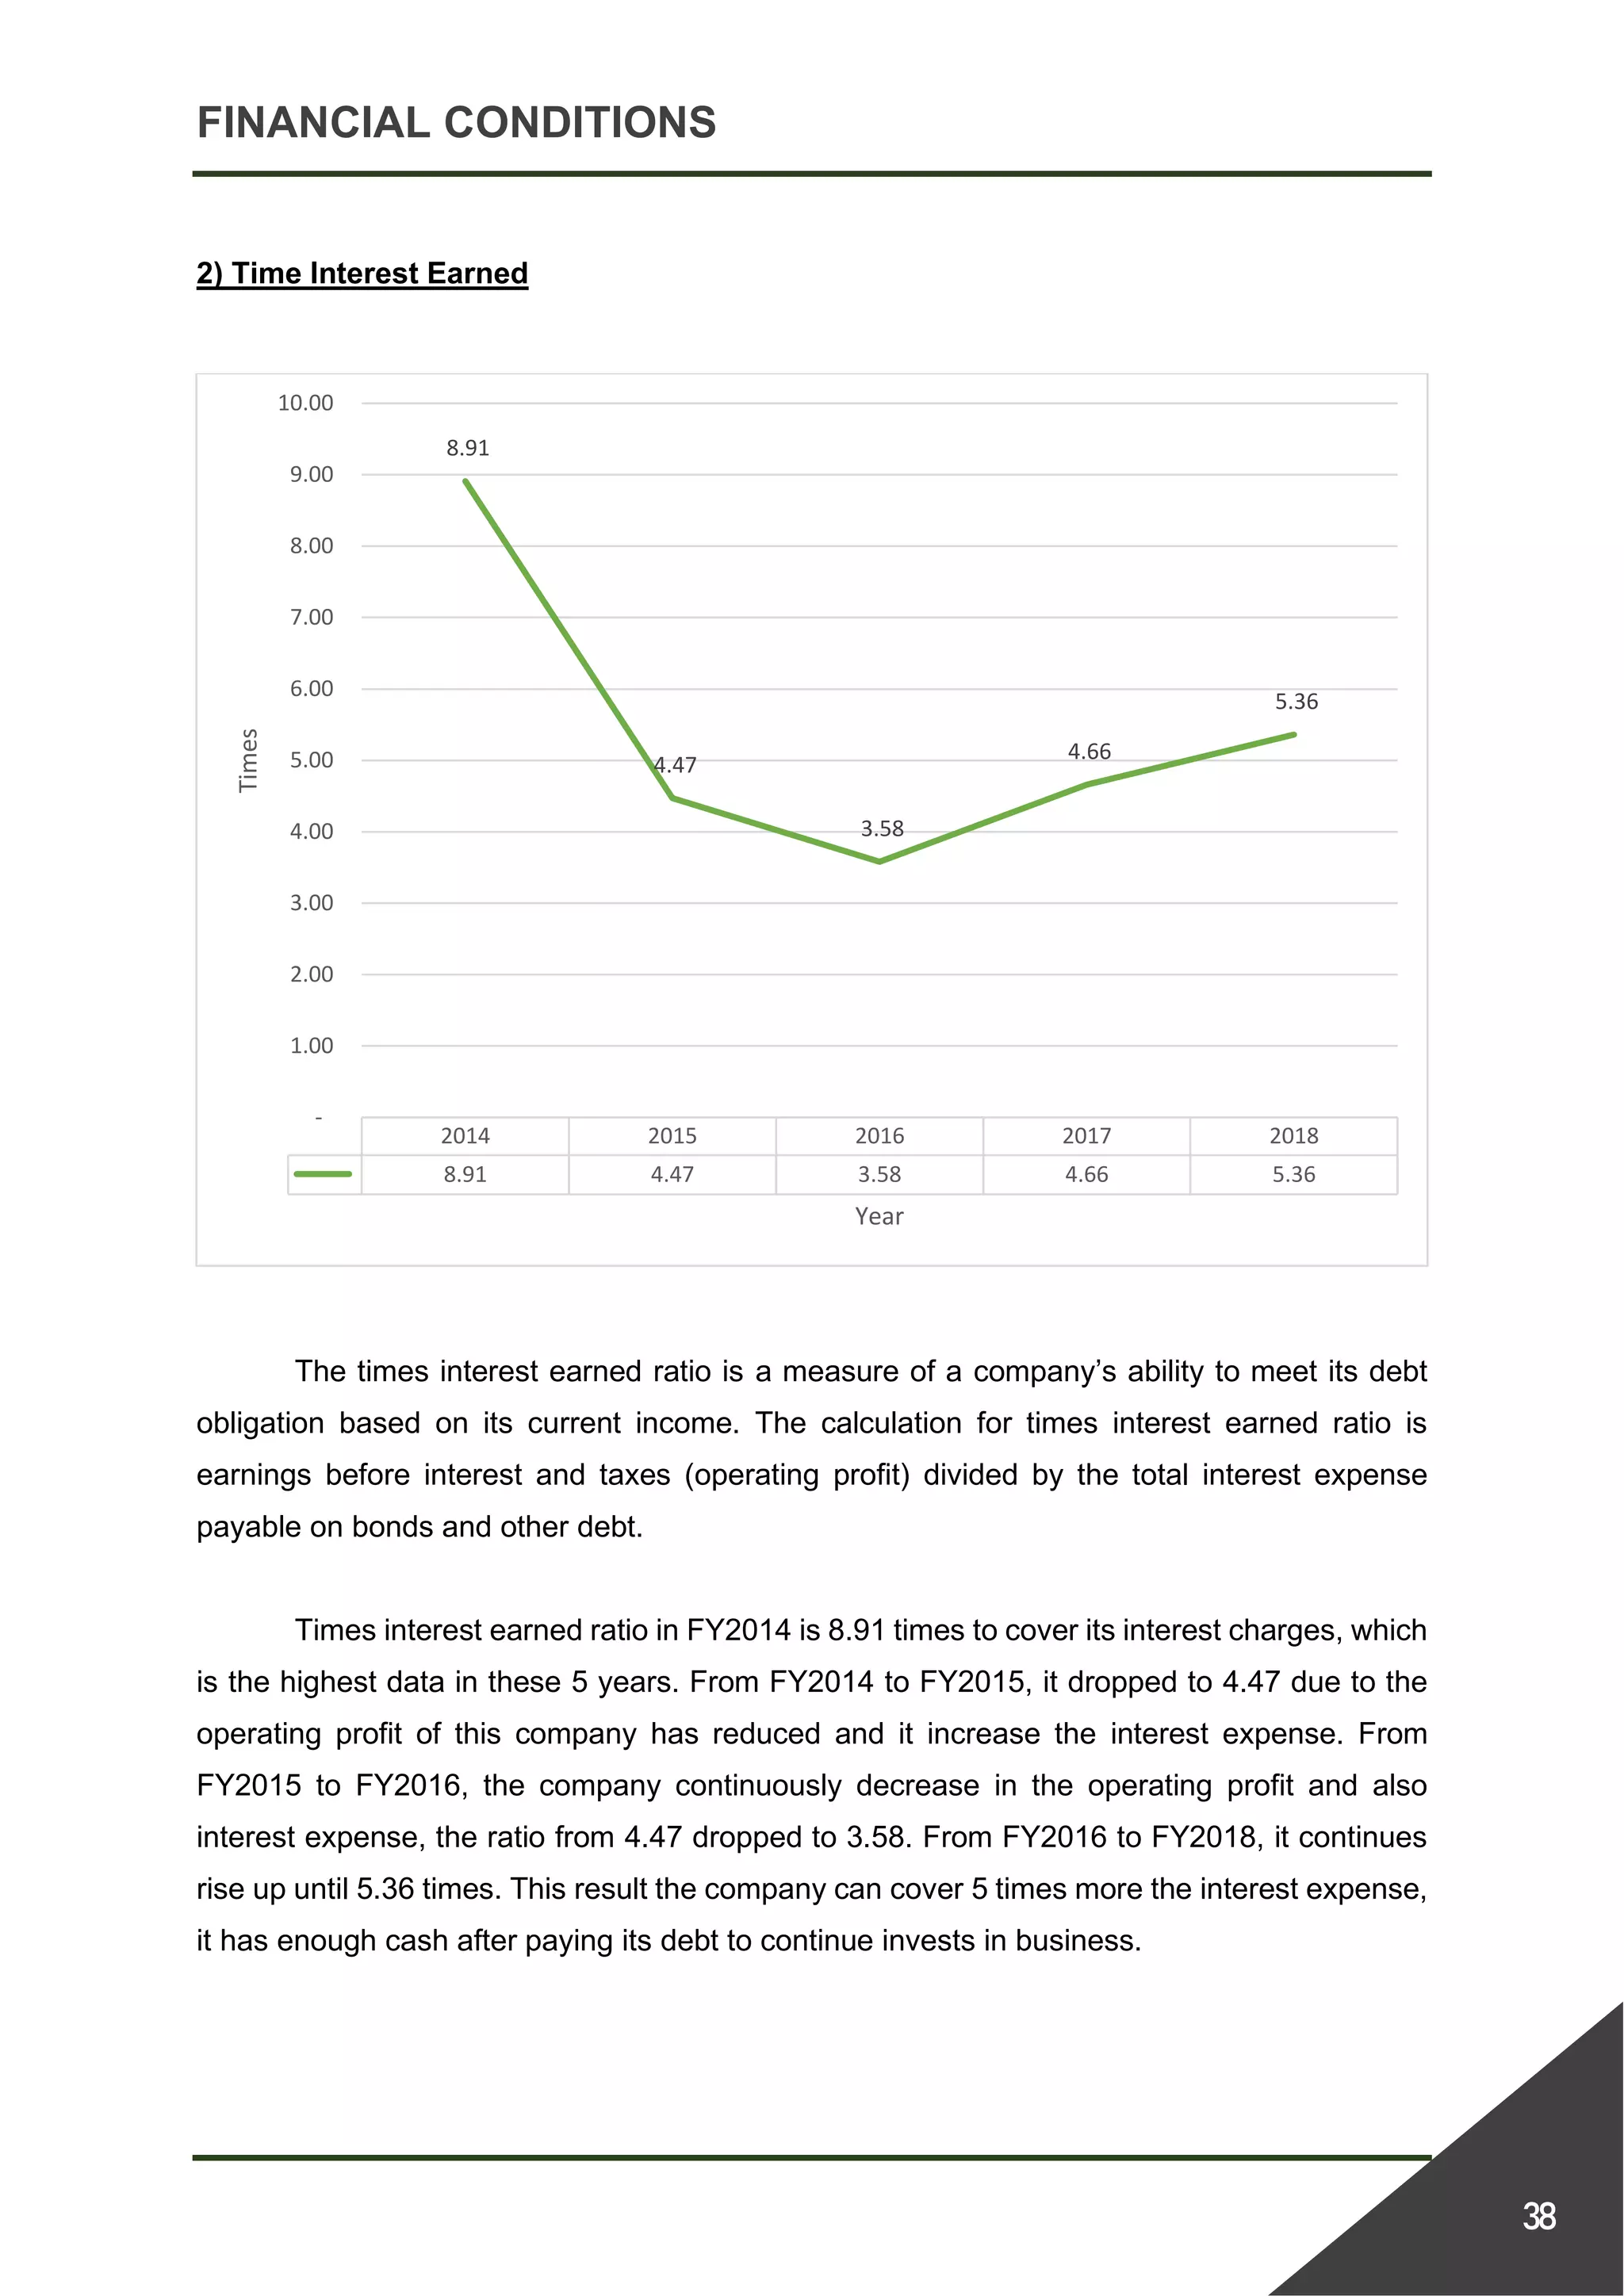
Times interest earned
Debt ratio
Total asset turnover
Average payment period (Days)
Average collection period (Days)
Inventory turnover
Formula](https://image.slidesharecdn.com/ilovepdfmerged1-200619055822/75/Financial-Management-Group-Assignment-Financial-Analysis-67-2048.jpg)


![SUMMARY OF RATIOS FORMULA
Financial Ratio
Current Assets
Current Liabilities
Current Assets - Inventories
Current Liabilities
Costs of goods sold
Inventories
Accounts receivables
Daily credit sales
Accounts payables
Average purchase per day
Sales
Total assets
Total debt
Total assets
Operating profit
Interest expense
EBIT + Lease payments
Interest + Lease payment + [(Principal payment + Preferred stock dividents)/(1-T)]
Gross profit
Sales
Operating profit
Sales
Net profit
Sales
Net profit
Total assets
Net profit
Total common equity
Net profit
No. of shares of common stock outstanding
Market price per share
Earnings per share
Market price per share
Equity book value per share
Quick ratio
Current ratio
RATIOS FORMULA
Times interest earned
Debt ratio
Total asset turnover
Average payment period (Days)
Average collection period (Days)
Inventory turnover
Formula
Net profit margin
Operating profit margin
Gross profit margin
Fixed payment coverage ratio (FPCR)
Price/Book ratio (P/B)
Price/Earnings (P/E)
Earnings per share (EPS)
Return on common equity (ROE)
Return on total assets](https://image.slidesharecdn.com/ilovepdfmerged1-200619055822/75/Financial-Management-Group-Assignment-Financial-Analysis-77-2048.jpg)


