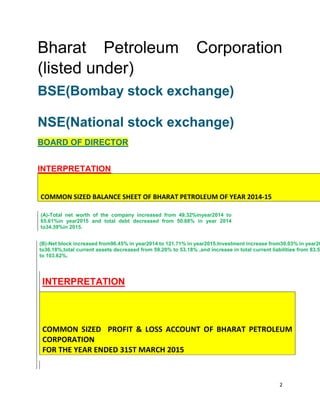
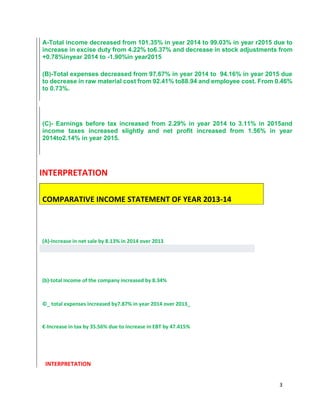
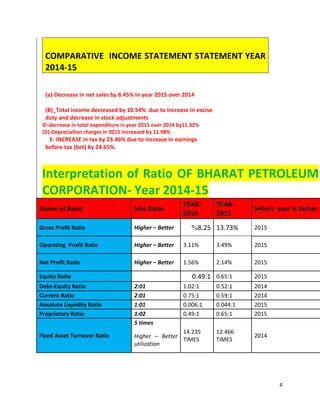
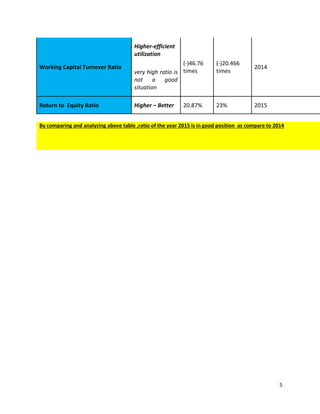
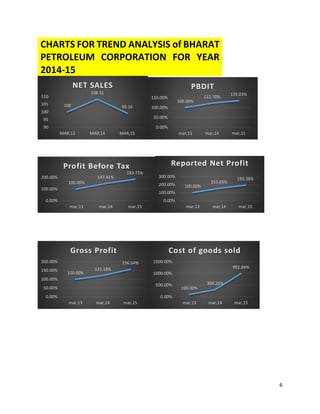
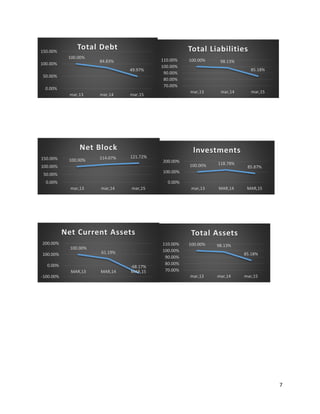
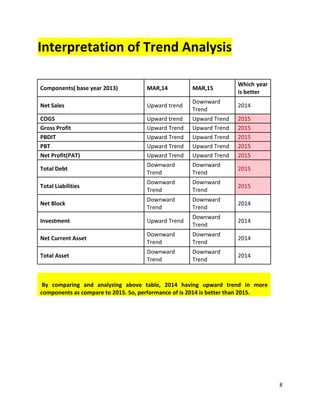
1
Vision
� we are the most admired global energy company leveraging talent
And technology
� We are the first choice of customers, always
� We exploit profitable growth opportunities outside energy
� We are the role model for Health, Safety, Security & Environment
� We are a great organisation to work for
� We are a learning organisation
� We are a model corporate entity with social responsibility
Mission
� We are the most admired global energy company leveraging talent
and technology
� We are the first choice of customers, always
� We exploit profitable growth opportunities outside energy
� We are the role model for Health, Safety, Security & Environment
� We are a great organization to work for
� We are a learning organization
2
Bharat Petroleum Corporation
(listed under)
BSE(Bombay stock exchange)
NSE(National stock exchange)
BOARD OF DIRECTOR
INTERPRETATION
COMMON SIZED BALANCE SHEET OF BHARAT PETROLEUM OF YEAR 2014-15
(A)-Total net worth of the company increased from 49.32%inyear2014 to
65.61%in year2015 and total debt decreased from 50.68% in year 2014
to34.39%in 2015.
(B)-Net block increased from96.45% in year2014 to 121.71% in year2015.Investment increase from30.03% in year20
to36.18%,total current assets decreased from 59.20% to 53.18% ,and increase in total current liabilities from 83.59
to 103.62%.
INTERPRETATION
COMMON SIZED PROFIT & LOSS ACCOUNT OF BHARAT PETROLEUM
CORPORATION
FOR THE YEAR ENDED 31ST MARCH 2015
3
A-Total income decreased from 101.35% in year 2014 to 99.03% in year r2015 due to
increase in excise duty from 4.22% to6.37% and decrease in stock adjustments from
+0.78%inyear 2014 to -1.90%in year2015
(B)-Total expenses decreased from 97.67% in year 2014 to 94.16% in year 2015 due
to decrease in raw material cost from 92.41% to88.94 and employee cost. From 0.46%
to 0.73%.
(C)- Earnings before tax increased from 2.29% in year 2014 to 3.11% in 2015and
income taxes increased slightly and net profit increased from 1.56% in year
2014to2.14% in year 2015.
INTERPRETATION
COMPARATIVE INCOME STATEMENT OF YEAR 2013-14
(A)-Increase in net sale by 8.13% in 2014 over 2013
(b)-total income of the company increased by 8.34%
©_ total expenses increased by7.87% in year 2014 over 2013_
€-Increase in tax by 35.56% due to increase in EBT by 47.415%
INTERPRETATION
4
COMPARATIVE INCOME STATEMENT STATEMENT YEAR
2014-15
(a)-Decrease in net sales by 8.45% in year 2015 over 2014
(B)_Total income decreased by 10.54% due to increase in excise
duty and decrease in stock adjustments
©-decrease in total expenditure in year 2015 over 2014 by11.32%
(D)-Depreciation charges in 2015 increased by 11.98%
E- INCREASE in tax by 23.46% due to increase in earnings
before tax (bet) by 24.65%.
Interpretation of Ratio OF BHARAT PETROLEUM
CORPORATION- Year 2014-15
Name of Ratio Idol Ratio
YEAR-
2014
YEAR-
2015
Which year Is Better
Gross Profit Ratio Higher – Better 52.8% 13.73% 2015
Operating Profit Ratio Higher – Better 3.11% 3.49% 2015
Net Profit Ratio Higher – Better 1.56% 2.14% 2015
Equity Ratio 1294.0 0.65:1 2015
Debt-Equity Ratio 2:01 1.02:1 0.52:1 2014
Current Ratio 2:01 0.75:1 0.59:1 2014
Absolute Liquidity Ratio 1:01 0.006:1 0.044:1 2015
Proprietary Ratio 1:02 0.49:1 0.65:1 2015
Fixed Asset Turnover Ratio
5 times
14.235
TIMES
12.466
TIMES
2014Higher – Better
utilization
5
Working Capital Turnover Ratio
Higher-efficient
utilization
(-)46.76
times
(-)20.466
times
2014
very high ratio is
not a good
situation
Return to Equity Ratio Higher – Better 20.87% 23% 2015
By comparing and analyzing above table ,ratio of the year 2015 is in good position as compare to 2014
6
CHARTS FOR TREND ANALYSIS of BHARAT
PETROLEUM CORPORATION FOR YEAR
2014-15
100
108.31
99.16
90
95
100
105
110
MAR,13 MAR,14 MAR,15
NET SALES
100.00%
122.70%
135.03%
0.00%
50.00%
100.00%
150.00%
mar,13 mar,14 mar,15
PBDIT
100.00%
147.41%
183.75%
0.00%
100.00%
200.00%
mar,13 mar,14 mar,15
Profit Before Tax
100.00%
153.65%
192.38%
0.00%
100.00%
200.00%
300.00%
mar,13 mar,14 mar,15
Reported Net Profit
100.00%
121.18%
156.54%
0.00%
50.00%
100.00%
150.00%
200.00%
mar,13 mar,14 mar,15
Gross Profit
100.00%
304.26%
992.84%
0.00%
500.00%
1000.00%
1500.00%
mar,13 mar,14 mar,15
Cost of goods sold
7
100.00%
84.83%
49.97%
0.00%
50.00%
100.00%
150.00%
mar,13 mar,14 mar,15
Total Debt
100.00% 98.13%
85.18%
70.00%
80.00%
90.00%
100.00%
110.00%
mar,13 mar,14 mar,15
Total Liabilities
100.00% 114.07% 121.72%
0.00%
50.00%
100.00%
150.00%
mar,13 mar,14 mar,15
Net Block
100.00% 118.78%
85.87%
0.00%
100.00%
200.00%
mar,13 MAR,14 MAR,15
lnvestments
100.00%
61.19%
-68.17%
-100.00%
0.00%
100.00%
200.00%
MAR,13 MAR,14 MAR,15
Net Current Assets
100.00% 98.13%
85.18%
70.00%
80.00%
90.00%
100.00%
110.00%
mar,13 mar,14 mar,15
Total Assets
8
Interpretation of Trend Analysis
Components( base year 2013) MAR,14 MAR,15
Which year
is better
Net Sales Upward trend
Downward
Trend
2014
COGS Upward trend Upward Trend 2015
Gross Profit Upward Trend Upward Trend 2015
PBDIT Upward Trend Upward Trend 2015
PBT Upward Trend Upward Trend 2015
Net Profit(PAT) Upward Trend Upward Trend 2015
Total Debt
Downward
Trend
Downward
Trend
2015
Total Liabilities
Downward
Trend
Downward
Trend
2015
Net Block
Downward
Trend
Downward
Trend
2014
Investment Upward Trend
Downward
Trend
2014
Net Current Asset
Downward
Trend
Downward
Trend
2014
Total Asset
Downward
Trend
Downward
Trend
2014
By comparing and analyzing above table, 2014 having upward trend in more
components as compare to 2015. So, performance of is 2014 is better than 2015.

Financial analysis for Bharat petroleum

  • 1.
    1 Vision � we arethe most admired global energy company leveraging talent And technology � We are the first choice of customers, always � We exploit profitable growth opportunities outside energy � We are the role model for Health, Safety, Security & Environment � We are a great organisation to work for � We are a learning organisation � We are a model corporate entity with social responsibility Mission � We are the most admired global energy company leveraging talent and technology � We are the first choice of customers, always � We exploit profitable growth opportunities outside energy � We are the role model for Health, Safety, Security & Environment � We are a great organization to work for � We are a learning organization
  • 2.
    2 Bharat Petroleum Corporation (listedunder) BSE(Bombay stock exchange) NSE(National stock exchange) BOARD OF DIRECTOR INTERPRETATION COMMON SIZED BALANCE SHEET OF BHARAT PETROLEUM OF YEAR 2014-15 (A)-Total net worth of the company increased from 49.32%inyear2014 to 65.61%in year2015 and total debt decreased from 50.68% in year 2014 to34.39%in 2015. (B)-Net block increased from96.45% in year2014 to 121.71% in year2015.Investment increase from30.03% in year20 to36.18%,total current assets decreased from 59.20% to 53.18% ,and increase in total current liabilities from 83.59 to 103.62%. INTERPRETATION COMMON SIZED PROFIT & LOSS ACCOUNT OF BHARAT PETROLEUM CORPORATION FOR THE YEAR ENDED 31ST MARCH 2015
  • 3.
    3 A-Total income decreasedfrom 101.35% in year 2014 to 99.03% in year r2015 due to increase in excise duty from 4.22% to6.37% and decrease in stock adjustments from +0.78%inyear 2014 to -1.90%in year2015 (B)-Total expenses decreased from 97.67% in year 2014 to 94.16% in year 2015 due to decrease in raw material cost from 92.41% to88.94 and employee cost. From 0.46% to 0.73%. (C)- Earnings before tax increased from 2.29% in year 2014 to 3.11% in 2015and income taxes increased slightly and net profit increased from 1.56% in year 2014to2.14% in year 2015. INTERPRETATION COMPARATIVE INCOME STATEMENT OF YEAR 2013-14 (A)-Increase in net sale by 8.13% in 2014 over 2013 (b)-total income of the company increased by 8.34% ©_ total expenses increased by7.87% in year 2014 over 2013_ €-Increase in tax by 35.56% due to increase in EBT by 47.415% INTERPRETATION
  • 4.
    4 COMPARATIVE INCOME STATEMENTSTATEMENT YEAR 2014-15 (a)-Decrease in net sales by 8.45% in year 2015 over 2014 (B)_Total income decreased by 10.54% due to increase in excise duty and decrease in stock adjustments ©-decrease in total expenditure in year 2015 over 2014 by11.32% (D)-Depreciation charges in 2015 increased by 11.98% E- INCREASE in tax by 23.46% due to increase in earnings before tax (bet) by 24.65%. Interpretation of Ratio OF BHARAT PETROLEUM CORPORATION- Year 2014-15 Name of Ratio Idol Ratio YEAR- 2014 YEAR- 2015 Which year Is Better Gross Profit Ratio Higher – Better 52.8% 13.73% 2015 Operating Profit Ratio Higher – Better 3.11% 3.49% 2015 Net Profit Ratio Higher – Better 1.56% 2.14% 2015 Equity Ratio 1294.0 0.65:1 2015 Debt-Equity Ratio 2:01 1.02:1 0.52:1 2014 Current Ratio 2:01 0.75:1 0.59:1 2014 Absolute Liquidity Ratio 1:01 0.006:1 0.044:1 2015 Proprietary Ratio 1:02 0.49:1 0.65:1 2015 Fixed Asset Turnover Ratio 5 times 14.235 TIMES 12.466 TIMES 2014Higher – Better utilization
  • 5.
    5 Working Capital TurnoverRatio Higher-efficient utilization (-)46.76 times (-)20.466 times 2014 very high ratio is not a good situation Return to Equity Ratio Higher – Better 20.87% 23% 2015 By comparing and analyzing above table ,ratio of the year 2015 is in good position as compare to 2014
  • 6.
    6 CHARTS FOR TRENDANALYSIS of BHARAT PETROLEUM CORPORATION FOR YEAR 2014-15 100 108.31 99.16 90 95 100 105 110 MAR,13 MAR,14 MAR,15 NET SALES 100.00% 122.70% 135.03% 0.00% 50.00% 100.00% 150.00% mar,13 mar,14 mar,15 PBDIT 100.00% 147.41% 183.75% 0.00% 100.00% 200.00% mar,13 mar,14 mar,15 Profit Before Tax 100.00% 153.65% 192.38% 0.00% 100.00% 200.00% 300.00% mar,13 mar,14 mar,15 Reported Net Profit 100.00% 121.18% 156.54% 0.00% 50.00% 100.00% 150.00% 200.00% mar,13 mar,14 mar,15 Gross Profit 100.00% 304.26% 992.84% 0.00% 500.00% 1000.00% 1500.00% mar,13 mar,14 mar,15 Cost of goods sold
  • 7.
    7 100.00% 84.83% 49.97% 0.00% 50.00% 100.00% 150.00% mar,13 mar,14 mar,15 TotalDebt 100.00% 98.13% 85.18% 70.00% 80.00% 90.00% 100.00% 110.00% mar,13 mar,14 mar,15 Total Liabilities 100.00% 114.07% 121.72% 0.00% 50.00% 100.00% 150.00% mar,13 mar,14 mar,15 Net Block 100.00% 118.78% 85.87% 0.00% 100.00% 200.00% mar,13 MAR,14 MAR,15 lnvestments 100.00% 61.19% -68.17% -100.00% 0.00% 100.00% 200.00% MAR,13 MAR,14 MAR,15 Net Current Assets 100.00% 98.13% 85.18% 70.00% 80.00% 90.00% 100.00% 110.00% mar,13 mar,14 mar,15 Total Assets
  • 8.
    8 Interpretation of TrendAnalysis Components( base year 2013) MAR,14 MAR,15 Which year is better Net Sales Upward trend Downward Trend 2014 COGS Upward trend Upward Trend 2015 Gross Profit Upward Trend Upward Trend 2015 PBDIT Upward Trend Upward Trend 2015 PBT Upward Trend Upward Trend 2015 Net Profit(PAT) Upward Trend Upward Trend 2015 Total Debt Downward Trend Downward Trend 2015 Total Liabilities Downward Trend Downward Trend 2015 Net Block Downward Trend Downward Trend 2014 Investment Upward Trend Downward Trend 2014 Net Current Asset Downward Trend Downward Trend 2014 Total Asset Downward Trend Downward Trend 2014 By comparing and analyzing above table, 2014 having upward trend in more components as compare to 2015. So, performance of is 2014 is better than 2015.