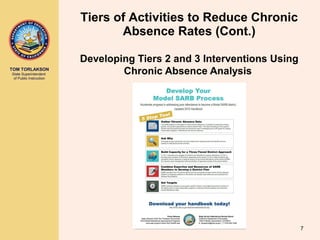
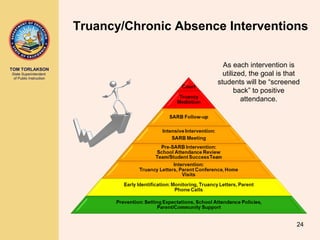
The document provides information about School Attendance Review Boards (SARBs) in California and their role in addressing chronic absenteeism. It discusses how SARBs lead a three-tiered approach to reduce chronic absence rates through community awareness campaigns, student and administrator recognition programs, and targeted interventions for at-risk students. SARBs analyze chronic absence data to identify focus areas and set goals. The SARB process involves prevention, intervention, directives for non-compliant families, and follow-up to monitor progress. Model SARBs that demonstrate success through data are recognized.
A Conversation about Accountability Challenges Associated with Authorizing Sc...Leslie Talbot
This document summarizes a discussion about accountability challenges for schools serving opportunity youth. It outlines fundamental considerations for authorizers, including clearly defining these student populations and establishing enrollment thresholds. While authorizers typically require consistent performance measures, some request additional school-designed measures aligned with the mission. Reasons for charter denial include lack of focus on challenges, reliance on anecdotes over progress, and insufficient capacity evidence. Schools are advised to proactively work with authorizers to negotiate distinct measures using comparable schools. The discussion addressed developing comprehensive definitions, quantifying school design, and involving stakeholders in negotiations.
The Impact of Special Education Reform: A Case Study of MassachusettsSheldon Berman
This document summarizes a case study on the impact of special education reform in Massachusetts. It finds that while the percentage of students in special education has declined slightly, the costs have greatly increased due to factors like medical advances allowing more children with severe disabilities to attend public schools. Early intervention and preschool special education enrollments have also increased dramatically. The increasing costs are straining school district budgets and limiting education reform efforts. It calls for increased federal and state funding to address the growing financial burden on districts from rising special education expenditures.
Educating Youth in Short-Term DetentionTanya Paperny
Each year thousands of youth in America are uprooted from their schools and communities and sent to a juvenile justice detention center. The majority of these confined youth are there for nonviolent offenses, including technical violations, such as failing to complete treatment or violating probation. Even youth awaiting foster care placement can be placed in a detention center. Over the course of a year, we estimate between 90,000 and 170,000 youth spend at least one day in a short-term detention center, and over 40% are detained for more than a month.
While in these facilities, young people are entitled to the same educational opportunities that they would have in the outside world. However, there is little research or data about this population.
In “Educating Youth in Short-Term Detention,” we found that youth’s educational experiences in these facilities often compound, rather than alleviate, the challenges they face. They are commonly unenrolled from their home school once they are arrested, and while detained, youth often do not receive coursework aligned with their needs, nor do they receive credit for the work they complete. Moreover, once they’re released, youth face significant challenges reenrolling in school, so even a brief period in confinement can severely disrupt a youth’s education.
The document discusses drug, alcohol, and substance abuse among young people in London and the UK. It notes that drug use results in high costs to the London Ambulance Service and police. While most schools provide drug education once a year or less, proven programs like Life Skills Training that are implemented in US schools have been shown to reduce substance abuse and have a cost benefit ratio of $25 saved for every $1 invested. The document calls for increased funding for early intervention and prevention programs in schools to address substance abuse among youth.
Press Release N-45 2015-2016 (City Announces New Initiatives to increase Dive...Lida Roman
The document announces six new initiatives by the New York City Department of Education to increase diversity at the city's specialized high schools. The initiatives include increasing outreach to underrepresented students, piloting administering the entrance exam during the school day, offering test preparation through middle school programs, expanding free tutoring programs, enrolling more students through the Discovery Program, and strengthening school culture and climate. The goals are to boost the number of black and Latino students taking the entrance exam and gaining admission, without lowering standards.
On May 9, Civic Enterprises and the Everyone Graduates Center at Johns Hopkins University, as part of the GradNation Campaign, released the 2016 Building a Grad Nation report. Released annually, the report shows detailed progress toward the GradNation goal of a national on-time graduation rate of 90 percent by 2020.
That afternoon, expert speakers and co-authors of the report – John Bridgeland, CEO and president, Civic Enterprises,Jennifer DePaoli, senior education advisor, Civic Enterprises, and Robert Balfanz, director of the Everyone Graduates Center at Johns Hopkins University School of Education – discussed where the nation and states stand on the path to 90 percent.
The webinar was moderated by Tanya Tucker, vice president of alliance engagement, America's Promise Alliance.
In addition to audience questions, topics included:
• Where the nation and states stand on reaching the 90 percent by 2020 goal
• Threats to achieving the goal
• Setting the record straight on graduation rates
• Recommendations for moving forward
Find the report at: www.gradnation.org/2016report
Breaking Down the "Surveying the Military" ReportEdChoice
Our survey of military servicemembers, veterans and their spouses is the first of its kind and methodology to delve deeper this important population's thoughts on K–12 education in America. This new research aims to help policymakers and the public better understand military families' perspectives on school choice policies, the military profession and more. Click through to get the key findings, complete with critical data you should know.
To download the full report, visit www.edchoice.org/Military Survey.
Charter schools currently serve 3 million students in more than 7,000 schools across 44 states and Washington, D.C. And their reach continues to grow: Since 2005, the number of charter schools in the U.S. has nearly doubled, and the number of charter students has nearly tripled.
Despite being an enduring presence in the nation’s education space, charter schools remain a topic of ongoing debate. The State of the Charter Sector provides the latest available information on charter schools across the country, including updated data on growth, performance, and geographic trends. It also includes analyses of the challenges that charter schools face and how the sector is trying to address them.
This comprehensive slide deck updates our 2015 State of the Charter School Movement, and together, these resources serve as a fact base to cut through the rhetoric that often accompanies conversations about charter schools.
The goal of this analysis is not to persuade, but to inform. As the charter sector continues to grow and improve, it needs a rigorous, evidence-based debate around its weaknesses and strengths. Accurate information is crucial for thoughtful policymaking and, ultimately, to ensuring all students have access to a high-quality education.
Unfinished: Insights From Ongoing Work to Accelerate Outcomes for Students Wi...Jeremy Knight
Despite some gains over the past 20 years, significant numbers of students are not meeting grade-level expectations as defined by performance on academic assessments. Meanwhile, few schools are able to support the sort of accelerated academic learning needed to catch students up to grade-level expectations.
Evidence indicates this is not for lack of educator commitment or dedication. Instead, many educators lack clarity about how to help students catch up. Common messages about holding a high bar for academic rigor and personalizing learning to meet students where they are can be perceived as being at odds with one another.
“Unfinished: Insights From Ongoing Work to Accelerate Outcomes for Students With Learning Gaps” synthesizes a broad body of research on the science of learning in order to inform efforts to help students close gaps and meet grade-level expectations. This deck argues that helping students catch up is not about rigor or personalization — classrooms need both.
Closing learning gaps requires students to be motivated and engaged to grapple with challenging, grade-level skills and knowledge — while also having their individual learning needs met.
The report identifies what must happen among educators, systems-level leaders, teacher developers, instructional materials providers, and technology experts to move beyond the dichotomy of “rigor versus personalization” and toward a future that effectively blends the two.
Patterns and Trends in Educational Opportunity for Students in Juvenile Justi...Jeremy Knight
Every two years the U.S. Department of Education’s Office for Civil Rights conducts the Civil Rights Data Collection (CRDC), which includes information about school demographics, course enrollment, discipline, and other measures of school quality. For the first time in 2013-14 and again in 2015-16, the CRDC included juvenile justice schools, which serve approximately 50,000 adjudicated youth placed in secure facilities across the country.
Students’ educational experiences in juvenile justice facilities have historically gone unnoticed. Due to the unique and relatively small population they serve, these schools are typically exempt from traditional state and federal data collection. The two most recent surveys from the CRDC offer limited insight, leading our team to analyze only 18 states in 2013-14 and 15 states in 2015-16. Our analysis includes a comparison of student access to critical math and science courses disaggregated by race and ethnicity.
In “Patterns and Trends in Educational Opportunity for Students in Juvenile Justice Schools: Updates and New Insights,” we found that juvenile justice facilities fail to provide adjudicated youth with sufficient access to the courses they need to graduate high school. For example, students in juvenile justice facilities are 25 percent less likely to have access to Algebra I, a foundational class required for graduation. Moreover, these facilities offer only limited access to credit recovery programs, which are critical to helping students recoup course credits that they missed or failed to complete earlier in their academic careers.
A closer look at the data reveals that while all youth in juvenile justice facilities experience inadequate access to important classes, no group of students has less access than Native American youth. Only 63% of Native youth in juvenile justice schools have access to Algebra I compared with 79% of white students. This pattern persists in the sciences. Forty-seven percent of Native students have access to biology compared with 70% of white students. Indeed, among all groups of students in juvenile justice facilities, Native students have the lowest access to math and science courses.
These alarming statistics make clear that juvenile justice systems must do a better job providing incarcerated youth with the educational opportunities they need to get back on track. Improving the quality of data about students’ educational experiences in juvenile justice facilities is a critical first step. States — which typically run these schools — can then use improved data to increase resources to these facilities and ensure students are enrolled in the proper classes. These steps will help juvenile justice facilities perform their rehabilitative functions rather than further punishing youth by severely limiting their educational opportunities.
Putting aside the detail of the findings for one moment, one of the very interesting aspects of this year’s survey is that, unlike in previous years, there is far less divergence of opinions between academy and maintained school respondents. This perhaps reflects the fact that we are now entering into the sixth year of the expanded academies programme and all schools are feeling the continued effects of the changing accountability measures, frailties of the examination system as well as financial restraint in the public sector.
Two clear themes struck me when looking at the survey findings. The Government’s education programme heavily relies on school leaders and it is clear more needs to be done to support current leaders as well as identifying and developing the leaders of the future.With continuation of the academy programme at pace and the emergence of more local school groups this will be a critical part of succession planning at both a local and national level.
This Government also needs to follow through on its manifesto commitments on schools funding. The Conservative manifesto made a commitment to provide‘proper funding’ to every school and to ‘make schools funding fairer’. However, Nicky Morgan has said the new funding formula will not be ready until September 2017 at the very earliest. Many will remember the last Education Secretary of State started consultation on fair funding in 2012 but progress soon stalled.
Whilst 2017 will feel too late for many, it is important to ensure that this time real progress will be delivered for our worst funded schools and their pupils. The Prime Minister’s announcement in July this year that the additional £390m previously confirmed for 2015-16 would be base-lined in budgets for future years was a welcome start. Any additional measures the Chancellor can facilitate in the comprehensive spending review to help narrow the gap pending the full implementation of fair funding will be very welcome.
https://www.brownejacobson.com/education/training-and-resources/guides/2015/11/school-leaders-survey-2015
- The Opportunity Scholarship Program (OSP) was a federally-funded school voucher program established in 2003 to provide vouchers of up to $7,500 for low-income students in Washington D.C. to attend private schools.
- Early studies of OSP found no statistically significant impact on student achievement in reading or math test scores overall, though some subgroups saw modest gains in reading.
- By 2009, funding to OSP was reduced due to a lack of evidence that the program was improving student outcomes overall. The program was phased out, though students already enrolled could continue with vouchers through high school graduation.
NC Early Childhood Attendance Counts ReportEducationNC
- Chronic absenteeism, defined as missing 10% or more of the school year, puts students at risk of lower academic achievement and can hinder reading proficiency by 3rd grade.
- In North Carolina, nearly 1 in 8 students miss more than 15 days of school annually, and chronic absenteeism rates vary widely between school districts and demographic groups.
- Measuring and addressing chronic absenteeism is important for improving 3rd grade reading outcomes and school quality, as regular attendance in early grades is critical for literacy development.
This document summarizes a case study on education sector programs in four African countries (Burkina Faso, Mali, Kenya, and Tanzania) that have adopted sector-wide approaches (SWAPs) influenced by the aid effectiveness agenda. It finds that while civil society organizations (CSOs) have gained a seat at the education policy table in these countries, their engagement remains uneven and limited by a lack of coordination and capacity. CSOs in Tanzania and Burkina Faso have achieved a greater degree of voice through cohesive national networks, while engagement is more fragmented in Kenya and Mali. However, across all cases there is a need for more transparent frameworks and donor support to strengthen CSO participation
Measuring Educational Opportunity in Juvenile Justice SchoolsJeremy Knight
Every two years, the Office for Civil Rights, a division of the U.S. Department of Education, conducts a civil rights data collection that includes information about school demographics, course enrollment, discipline, and other measures of school-based experience. In 2013, the office collected data from schools identified as juvenile justice schools for the first time. These schools serve only students placed in secure facilities by law enforcement or courts, and there are approximately 50,000 young people across the country in these on any given day.
Because of their unique position and small student populations, juvenile justice schools are historically exempt from most common state and federal measures of education achievement. In fact, this 2013 data set offers the first opportunity to establish a data baseline across states.
However, in attempting to conduct an analysis of the available data from 2013, the Bellwether team discovered troubling inconsistencies in the data set that suggested inaccurate or incomplete data collection. In order to conduct a credible analysis, we cross-referenced the Office for Civil Rights data with residential facility census data collected by the U.S. Department of Education’s Office of Juvenile Justice and Delinquency Prevention. This revealed serious deficiencies in most states’ data; in fact, only 18 states provided credible data about enrollment and achievement in their juvenile justice schools.
We were able to draw some conclusions about higher-level math and science course access and enrollment from the available data. However, without more accurate and more nuanced data collection from the Office for Civil Rights, these conclusions are of limited utility to policymakers and program leaders. Both the conclusions and recommendations for improved data collection practices are presented in this deck.
Disrupting Rural Poverty: …what State & Federal Legislators can do to helpRobert Mackey
The challenges faced by public schools operating in rural NY State where poverty levels are increasing rapidly and key resources, staff, time, and money, are not increasing at nearly the same pace. Presented at the DCMO BOCES Legislative Breakfast held on December 3, 2016.
This document summarizes different levels of government involvement in education funding and policymaking in the United States. It discusses the role of local school districts and boards, as well as state boards of education and departments that oversee funding, standards, and policy. It also briefly outlines the role of the federal government in providing some funding and initiatives. Key groups that influence education policy are also identified.
NC Early Childhood Foundation: Attendance CountsAnalisa Sorrells
This document discusses chronic absence in North Carolina schools and its negative impacts on student achievement. It defines chronic absence as missing 10% or more of school days in an academic year. The document summarizes research finding that chronic absence in early grades is associated with lower academic performance, increased dropout rates, and other issues. It also notes that chronic absence disproportionately affects low-income students and students of color. The document then outlines strategies that schools and communities can take to address chronic absence at the state, district, and local levels, such as improving attendance data collection, family engagement, and collaboration with outside organizations.
President Donald Trump’s nomination of philanthropist and education advocate Betsy DeVos for Secretary of Education thrust Michigan education into the national spotlight. Because DeVos doesn’t have a track record as a government official or school system leader, her work in Michigan on education issues provides some of the only information about her track record and what she might do as Secretary. Yet, DeVos’ critics and her boosters alike are making a variety of claims about Michigan that are confusing and contradictory.
To help clarify some of these questions, a new analysis from Bellwether Education Partners provides a comprehensive look at the education policy landscape in Michigan.
Presentation on HIV, Education and Human Rights, by Jack Fletcher of SexpressionHIVScotland
Presentation on HIV, Education and Human Rights, by Jack Fletcher of Sexpression. Presented on 21 February 2015 at the Positive Persons' Forum in Glasgow.
This document discusses challenges low-income, high-achieving students face in accessing higher education opportunities and presents Sixup as a solution. It notes that low-income students are often forced to attend less selective colleges due to cost barriers, which can negatively impact outcomes. Sixup aims to bridge funding gaps for such students to allow them to attend more selective institutions through an outcomes-based model pairing students with philanthropic investors. The organization provides gap financing, grants, and wraparound support services to help students succeed in college and beyond.
Want to know how our flagship publication—The ABCs of School Choice 2018 Edition—can work for you? Check out our demo on this handbook that state legislators have used for nearly a decade to compare and contrast school choice programs and policies across the country.
To order yours, visit www.edchoice.org/order.
Presented on 9 July 2013 the Minnesota House Education Policy Committee held a hearing on integration policy at the Crosswinds Arts & Science School in Woodbury, MN.
Florida’s tax-credit scholarship program—a type of private school choice program—serves some of the most disadvantaged students in the state. In an effort to better understand how those families feel about the program and their schools, our researchers surveyed more than 14,000 parents and guardians of Florida children using tax-credit scholarships.
Download the full report at www.edchoice.org/FLParentSurvey.
The COVID-19 pandemic has significantly impacted students' higher education and career plans according to a survey of nearly 1,000 parents. Specifically:
- One-third of students changed their career plans and 30% altered what type of higher education institution they planned to attend.
- The vast majority (87%) of students will take either fully online or a hybrid of online and in-person courses. However, over half of parents are unwilling to pay full tuition for remote classes.
- Many families have also experienced financial hardship during the pandemic, with over half reporting a lost job or reduced work hours and 8% losing all sources of income.
- Despite these challenges, two-thirds of parents have maintained sound higher education
An analysis of the social impact of the
stipend program for secondary school girls
of Khyber Pakhtunkhwa (in Pakistan)
Sustainable Development Policy Institute
Breaking Down “Back to the Staffing Surge”EdChoice
Our latest report—“Back to the Staffing Surge”—measures US public school employment growth versus student growth as well as teacher salary fluctuations and student outcomes over the past 65 years using publicly available data that state departments of education annually report to the U.S. Department of Education. The results were shocking.
What did the numbers say exactly? And what could our system have done to better serve public school teachers and students? Flip through this slide show to learn more!
To access the full Back to the Staffing Surge report and more resources, including a podcast video with author Dr. Ben Scafidi, visit www.edchoice.org/StaffingSurge.
The document discusses strategies for states to improve FAFSA completion rates. It recommends that states set ambitious yet achievable FAFSA completion goals, build shared ownership of completion efforts across K-12 and higher education, spur local action through incentives and partnerships, use data to target support and measure progress, and spread awareness of the importance of completing the FAFSA form. FAFSA completion is positioned as a promising strategy for states to improve postsecondary access and attainment.
Adobe Captivate Prime is a modern learning management system (LMS) that allows users to easily setup, deliver, and track learning. It offers a unique fluidic player to seamlessly play all types of content and allows note-taking. The LMS also provides gamification, mobile learning, offline access, and powerful reporting capabilities to measure learning impact and establish a learning culture. Administrators can create customized learning programs and plans to help employees develop skills and achieve training objectives.
The document summarizes information about the Yellow-bellied Sea Snake (Pelamis platura). It discusses the snake's classification, distribution throughout tropical oceans worldwide except for some regions, and habitat in the upper layers of open ocean waters. The snake preys on small fish, using an ambush technique and potent venom. It can hold its breath for extended periods while diving and surfaces to breathe every few hours, demonstrating adaptations for its fully aquatic pelagic lifestyle.
El documento proporciona instrucciones en 5 pasos para crear un blog en Blogger.com. Estos pasos incluyen hacer clic en el botón "Nuevo blog", completar los campos de título y dirección URL, seleccionar un diseño de plantilla, y hacer clic en "Crear blog". Una vez creado, los usuarios pueden agregar nuevas entradas editando el título, texto, imágenes y enlaces usando las herramientas del editor.
On February 17, 2017 ICLR conducted a Friday Forum workshop entitled 'Canadian wildland fire interface maps: Tools for wildland fire protection of our communities, industries, and infrastructure' with Lynn Johnston of the Canadian Forest Service. Wildland fires have the potential to destroy communities, industrial buildings, and critical infrastructure and they also put human lives at risk. Wildland firefighting aims to prevent these destructive events, but not all fires can be controlled. Two recent wildfire events, Slave Lake in 2011 and Fort McMurray in 2016, resulted in significant destruction with direct costs of over $1 billion (Slave Lake) and $4 billion (Fort McMurray). In this webinar, Lynn Johnston reviewed wildland fire as a threat to Canadians and provided details of recent research into mapping locations across the country where communities, industry, or infrastructure have the potential to be at risk from wildland fire (known as “interface” areas).
Lynn Johnston is a Forest Fire Research Specialist with the Canadian Forest Service at the Great Lakes Forestry Centre in Sault Ste. Marie, Ontario. She has worked with the CFS since 2007 on a variety of wildland fire topics, including fire behaviour, fire risk, and fire and climate change. Lynn recently completed her MSc. at the University of Alberta in Forest Biology and Management, focusing on wildland fires. Her thesis research provided a first national map of interface areas in Canada (i.e. where human-built structures and potentially burnable land meet.
The document lists and describes 10 new features coming to FIFA 17. Some of the key features include The Journey, a new story mode; downward headers, which allow players to direct headers along the ground; and revolutionized set pieces with new aiming and mechanics for penalties and throw-ins. Managers will also be visible on the touchline during matches for an improved realism. FIFA 17 will also include Japan's professional soccer league and run on the Frostbite game engine for enhanced graphics. The game is scheduled for worldwide release on September 29, 2016.
The location risk assessment form summarizes the shoot details for a scene involving an assault between two characters, Rachel and Phoebe, in Burn Valley Park in Hartlepool on March 21st. The location is isolated which allows the altercation to occur without interference. The crew of 8 people will be on site to film the scene. Hazards checked off on the form include restricted access/egress, manual handling, night operations, noise, unstable set materials, scaffolds/platforms, stunts, and weather changes.
Este documento resume um capítulo do romance "Os Maias" de Eça de Queirós. O capítulo descreve um sarau no Teatro da Trindade que teve como objetivo arrecadar fundos para vítimas de cheias no Ribatejo. O evento foi importante para o desenvolvimento do enredo porque Ega encontrou o tio de Dâmaso, que lhe entregou um cofre contendo revelações sobre a verdadeira identidade de Maria Eduarda. O documento também analisa as críticas sociais feitas por Eça no romance, que ainda são relevantes hoje em dia.
Las abejas son GRANDES PRODUCTORAS, una sola colonia puede elaborar alrededor de 27 kilos de miel y para hacerlo deberán visitar más de dos millones de flores.
Los animales ,clasificasion y Beneficioslalacarlos
Este documento describe las características generales de los animales. Explica que los animales son organismos pluricelulares que se alimentan de sustancias elaboradas por otros seres vivos, y que generalmente tienen capacidad de movimiento y órganos sensoriales. También describe las principales funciones de los animales como la alimentación, respiración, circulación, excreción, respuesta, movimiento y reproducción. Finalmente, explica algunas de las características usadas para clasificar a los animales como la alimentación, reproducción, estructura ó
This presentation deals with radiographic imaging of three important phases of implant placement; PHASE 1: PRE-PROSTHETIC IMPLANT IMAGING
PHASE 2: SURGICAL AND INTERVENTIONAL IMPLANT IMAGING
PHASE 3: POST-PROSTHETIC IMPLANT IMAGING
1. O documento apresenta 20 questões sobre arte indígena, africana e movimentos artísticos modernos como o Cubismo. 2. As questões abordam tópicos como a pintura corporal indígena, a arte plumária, a arte africana e suas influências na cultura brasileira, além de movimentos como Cubismo, Fauvismo e Expressionismo. 3. O documento serve como banco de questões para um professor de arte analisar diferentes aspectos culturais e artísticos.
Este documento presenta un ejemplo de planificación anual para el sexto grado de primaria. Incluye los propósitos de aprendizaje organizados por áreas curriculares, la distribución del tiempo en trimestres y las unidades didácticas. También presenta los enfoques transversales que se abordarán y la organización de la tutoría y orientación educativa a lo largo del año escolar.
This document discusses potential filming locations for scenes involving teens. It analyzes four locations: Bournville Park, Jess' House, a photography room, and Niamh's House. For each location, it describes how the setting would convey realism and relatability for teen characters and scenes. Bournville Park is praised for its natural setting and ability to portray where teens hang out. Jess' House contains conventionally untidy rooms that would enhance relatability. The photography room offers controllable lighting suitable for an intense kidnapping scene. Niamh's pink room and typical street scene are seen as reinforcing the image of everyday teen life.
Este documento presenta una unidad didáctica para el primer grado de primaria. La unidad se titula "Nos conocemos y ambientamos nuestra aula" y tiene como propósito que los estudiantes organicen y ambienten su aula de manera colaborativa. La unidad propone actividades comunicativas y matemáticas orientadas a que los estudiantes expresen cómo mejorar su ambiente escolar y asuman responsabilidades compartidas.
This document discusses strategies for reducing chronic absenteeism in schools through a three-tiered approach of prevention, early intervention, and intensive intervention. It establishes school attendance review boards (SARBs) at the state, county, and local levels to identify and address barriers to attendance. SARBs regularly monitor attendance data and provide personalized outreach to students missing 10% or more of school, while referring persistent cases missing 20% or more of school for intensive case management. The document recognizes several SARBs that have been successful in reducing chronic absence rates through implementing the three-tiered approach and acting on attendance data.
Attendance and student performance arp (1)Cindy Paynter
The document presents research on the relationship between student attendance and academic performance. It finds that students with higher absenteeism, defined as missing 18 or more days of school, performed at lower levels on standardized tests than students who missed 7 or fewer days. Specifically, higher percentages of chronically absent students scored at the novice level in science and social studies assessments compared to their regularly attending peers. The author concludes that attendance impacts student achievement and that the school needs to implement strategies to improve attendance in order to help more students succeed academically.
This memorandum provides 3 recommendations to increase student retention and graduation rates by decreasing suspensions: 1) Eliminate suspensions for subjective offenses like "willful defiance" and instead require parent conferences and interventions; 2) Require professional development for restorative justice programs; 3) Include restorative justice in teacher credentialing programs. The recommendations aim to reduce disproportionate suspension of minority students and the school-to-prison pipeline.
AttendaNCe Counts: What North Carolina School Districts are Doing to Reduce C...Molly Osborne
This document discusses chronic absenteeism in North Carolina school districts. It finds that chronic absenteeism is an issue that affects many North Carolina communities and students, especially students from certain racial/ethnic groups. The document reports on a survey of North Carolina school districts that asked districts to self-assess their attendance policies and practices. The survey looked at four areas: data collection and use, family engagement, strategic planning, and community partnerships. The survey found that while districts feel fairly confident in their data collection, they see more room for improvement in data analysis and family engagement strategies. The document discusses recent state-level efforts to address chronic absenteeism and identifies questions for districts to improve their policies and practices.
This document discusses chronic early absence and strategies to address it. It defines key terms like average daily attendance, truancy, and chronic absence. It summarizes data showing chronic absence is associated with lower academic performance and higher dropout rates. Successful programs use multi-tiered approaches, data-driven action, attendance teams, home visits, and community partnerships. Reducing chronic absence requires ownership from superintendents, mobilizing communities, and using attendance data to monitor progress and target interventions.
Title I is a federal funding program intended to help students who are falling behind academically or who are at risk of not meeting academic standards. Funds are allocated based on the number of students eligible for free or reduced lunch. Schools can use Title I funds to hire teachers, purchase materials, support parental involvement activities, and fund professional development programs.
The Elementary and Secondary Education Act of 1965 aimed to provide equal access to education for all students. It has been reauthorized several times, most recently as the No Child Left Behind Act in 2001. North Carolina received a waiver from some NCLB requirements in 2012 in order to increase flexibility and accountability at the state and local levels. Schools are now measured based on whether student
ESSA and Chronic Absenteeism - A Conversation with Visionary Policy Leaders...Jonah_OD
This webinar discussed chronic absenteeism under the Every Student Succeeds Act (ESSA). Jessica Cardichon from the Learning Policy Institute discussed why chronic absenteeism matters and how states are addressing it. She defined chronic absenteeism and explained its negative impacts on students. Phillip Lovell from the Alliance for Excellent Education then discussed how ESSA requires states to report chronic absenteeism rates and select a fifth non-academic indicator. They took questions from participants on challenges in addressing chronic absenteeism and opportunities provided by ESSA. The webinar provided resources on state efforts to improve data collection and reduce chronic absenteeism through interventions and professional development.
JBlocker Contextual Analysis of the Learning Communityjblockermedia
Tattnall County High School (TCHS) is located in Tattnall County, Georgia between Glennville and Reidsville. It serves over 900 students annually from grades 9-12. Over 63% of students are economically disadvantaged and receive free or reduced lunches. The school aims to provide a quality education to all students and help them succeed through innovative strategies and programs that support student needs. It faces challenges related to the rural nature of the county and high poverty rates, but is working to improve student achievement, parental involvement, and access to technology resources.
Tattnall County High School (TCHS) is located in Tattnall County, Georgia between Glennville and Reidsville. It serves over 900 students in grades 9-12, over 63% of whom are economically disadvantaged. TCHS aims to provide a nurturing learning environment and ensure all students achieve success through its motto of "Whatever It Takes." It faces challenges serving its rural population over a wide geographic area and high poverty rates. The school library aims to support student learning and teachers through expanding access to information resources.
Educating the New Kids on the Block in our Country SchoolsRobert Mackey
The changing rural school student demographics cause them to have more in common with their urban counterparts; especially in the area of a growing number of students experiencing adverse social and economic conditions. This presentation shares a comparison of a rural school, the BOCES it is in, and three urban schools. There is also discussion on next steps for rural schools to take to ensure all kids learn at high levels.
How to Develop a Response to Intervention ModelAmy Robertson
Schools need a way to identify struggling students so they can intervene immediately to alter the course of action for students. Learn the 10 steps to developing an RTI model at your school with this eBook.
Extended Local Control Funding Formula presentation by Public Advocatesdistrict5united
Extended Local Control Funding Formula presentation by Public Advocates. In this PowerPoint, Public Advocates outlines the major changes the Local Control Funding Formula makes to school finance in California. They discuss funding and spending based on student needs, the benefits and concerns around local control, the state priorities’ broad definition of school success, Local Control and Accountability Plans and the importance of community involvement under LCFF. Afterwards, they develop talking points for the School Success Express.
The document is an online training module on bullying and cyberbullying from the California Department of Education. It aims to assist school staff, administrators, parents, students, and communities in recognizing, preventing, and intervening in bullying and its harmful effects. The training provides definitions of bullying from the California Education Code, facts and statistics about the prevalence of bullying, groups most at risk of being bullied, potential consequences of bullying for both targets and perpetrators, and the legal responsibilities of local educational agencies to address bullying. It also discusses how measures of school climate from the California Healthy Kids Survey can inform school safety plans and the Local Control Accountability Plan.
This document provides information about Title I funding and parental involvement for a school's PAC meeting. It explains that Title I funds come from the federal government to support students who are below grade level or at risk of not meeting standards, and can be used for teachers, materials, parental activities, and pre-K programs. It encourages parents to get involved in their child's education, know how the school is performing, and outlines how the school will be evaluated based on student subgroup progress.
This document proposes solutions to address high dropout rates and low learning levels in primary schools in India. It suggests implementing two initiatives: 1) A District School Monitoring Body (DSMB) to oversee teacher performance, address complaints, and ensure infrastructure standards. 2) A monthly school magazine called "Pahal" to develop basic skills for students, facilitate parent-teacher communication, and increase accountability. The DSMB would decentralize recruitment and include community monitoring. "Pahal" would provide low-level content in local languages to benefit all students and report individual performance to parents. These solutions aim to improve education quality, learning levels, and stakeholder involvement.
Local Control Funding Formula presentation by Public Advocatesdistrict5united
Local Control Funding Formula presentation by Public Advocates. The presentation was provided at the Local Control Funding Formula 101 Community Forum and Discussion held on October 29, 2013, at James Lick High School in San Jose, CA.
Two major policy initiatives now include chronic absence as an accountability measure for schools in California, the federal Every Student Succeeds Act (ESSA) and California’s Local Control Funding Formula (LCFF). This session will feature Attendance Works,the nation’s leading expert on chronic absence, California education policy leaders, and school health experts who will provide an overview of the accountability measures, how they can be used to reinforce the importance of health for attendance, and how school-based health providers can support efforts to address chronic absence.
This document summarizes that Sabin Elementary School is a Title I school, meaning it has a high number of students who qualify for free or reduced lunch and receives additional federal funding to increase student achievement. It explains that Title I money is used according to Unified Improvement Plans and that parents have input into how the funds are spent. It also provides details on Colorado's State School Performance Framework which evaluates schools in four key areas to determine improvement plans and defines the categories schools may be assigned to.
A presentation by Bradley Simmons HMI Ofsted Regional Director, South West at an Association of School and College Leaders conference: Bristol 2 June 2015.
Similar to FINAL-Reducing Chronic Absenteeism PP (20)
1. CALIFORNIA DEPARTMENT OF EDUCATION
Tom Torlakson, State Superintendent of Public Instruction
School Attendance Review Boards:
Leading Three Tiers of Activities to
Reduce Chronic Absenteeism
David Kopperud, Education Programs Consultant and
Chairperson, State School Attendance Review Board
Educational Options, Student Support, and American Indian
Education Office
Coordinated Student Support Division
ACSA’s Pupil Personnel Service Academy
Fremont Unified School District
Saturday, November 14, 2015
2. TOM TORLAKSON
State Superintendent
of Public Instruction
Workshop Objectives
• Provide a context for the increased focus on
the three tiers of activities to reduce chronic
absence rates
• Provide an overview of the methods of Model
School Attendance Review Boards (SARBs)
in leading district attendance activities and
interventions
• Share practices related to chronic absence
analysis and how Model SARBs are data-
driven
2
3. TOM TORLAKSON
State Superintendent
of Public Instruction
Current Context
• Developing a Local Control and Accountability
Plan (LCAP) that includes baseline chronic
absence rates and goals and strategies for
reducing those rates
• Understanding the focus on elementary and
middle school chronic absence rates
• SARBs that are models for reducing truancy,
chronic absenteeism, and dropout rates
3
4. TOM TORLAKSON
State Superintendent
of Public Instruction
Tier 1: Community Attendance Awareness
Tiers of Activities to Reduce Chronic
Absence Rates
4
5. TOM TORLAKSON
State Superintendent
of Public Instruction
Tier 1: Student Awards and Awareness
Tiers of Activities to Reduce Chronic
Absence Rates (Cont.)
5
6. TOM TORLAKSON
State Superintendent
of Public Instruction
Tier 1: Administrator Awards and Awareness
Tiers of Activities to Reduce Chronic
Absence Rates (Cont.)
6
7. TOM TORLAKSON
State Superintendent
of Public Instruction
Developing Tiers 2 and 3 Interventions Using
Chronic Absence Analysis
Tiers of Activities to Reduce Chronic
Absence Rates (Cont.)
7
8. TOM TORLAKSON
State Superintendent
of Public Instruction
Local Control Funding Formula
• New language requiring that appropriate Local
Control Funding Formula (LCFF) funding be
“principally directed” to high-needs students will
help ensure that high-needs students are provided
needed support to close the gap in chronic
absence rates, dropout rates, suspension rates,
and in student achievement. The next step will be
an evaluation rubric to ensure accountability in
meeting each of the state priority areas in the
LCAP.
Funding Can Support Work of School Attendance
Review Boards in Reducing Chronic Absence
8
9. TOM TORLAKSON
State Superintendent
of Public Instruction
Local Control and Accountability Plan
The LCAP must include a description of annual goals to be achieved
for state priorities and any local priorities must be identified.
Priorities
9
10. TOM TORLAKSON
State Superintendent
of Public Instruction
Chronic Absence
• A "chronic absentee" has been defined in
California Education Code (EC) Section
60901(c)(1) as “…a pupil who is absent on 10
percent or more of the school days in the
school year when the total number of days a
pupil is absent is divided by the total number
of days the pupil is enrolled and school was
actually taught in the regular day schools of
the district, exclusive of Saturdays and
Sundays."
Definition
10
11. TOM TORLAKSON
State Superintendent
of Public Instruction
The Value of Chronic Absence Data to the
School Attendance Review Board Compared to
Truancy Data
Chronic Absence Data
11
12. TOM TORLAKSON
State Superintendent
of Public Instruction
Future of Attendance Data
• The research indicates that chronic absenteeism
rates are a better indicator of risk, especially at the
elementary level, than truancy rates. Chronic
absenteeism includes both excused and unexcused
absences while truancy only includes unexcused
absences.
• As a result, the California Department of Education
(CDE) is considering the collection of attendance
data through the California Longitudinal Pupil
Achievement Data System to calculate the rates of
chronic absenteeism on a statewide basis. Truancy
identification is still critical for parent notification and
the SARB process to ensure compliance with
compulsory education laws.
12
14. TOM TORLAKSON
State Superintendent
of Public Instruction
The Ways School Attendance Review Boards Analyze
Chronic Absence to Identify High Need Groups
• Chronic absence by grade, by year
• Chronic absence by school summary
• Chronic absence by race/ethnicity
• Chronic absence by special needs status
• Chronic absence by eligibility for free or reduced
price lunch
• Chronic absence by English learner status
Chronic Absence Data Analysis
Free Cal District Attendance Tracking Tool from Attendance
Works provides:
14
15. TOM TORLAKSON
State Superintendent
of Public Instruction
Guiding Questions for School Attendance Review
Boards Analysis of Chronic Absence Data
• To what extent is chronic absence a problem in
your district that has been identified in your LCAP?
• Is chronic absence a growing or decreasing trend?
• What does chronic absence look like at different
grade levels in your district?
• Is chronic absence concentrated at particular
schools?
• Which racial/ethnic subgroups have better or
worse chronic absence?
Chronic Absence Data Analysis (Cont.)
15
16. TOM TORLAKSON
State Superintendent
of Public Instruction
Additional Questions for School Attendance
Review Boards
• Is chronic absence higher among students with
special needs?
• Is chronic absence higher among children in
foster care?
• How does chronic absence compare to average
daily attendance or truancy rates for each
school?
• How does chronic absence compare to
measures of school climate, such as
suspension rates?
Chronic Absence Data Analysis (Cont.)
16
17. TOM TORLAKSON
State Superintendent
of Public Instruction
Critical Questions for the School
Attendance Review Board
• Where should attendance improvement be
targeted? Particular grades? Particular schools?
Particular subgroups, such as foster youth?
• What would be a realistic goal to set for
improvement from baseline in chronic absence
levels for next year by school? By district as a
whole? (Some LCAP goals expect at least a 10
percent to 20 percent reduction from baseline. For
example, a 20 percent chronic absence rate would
be reduced by 2 to 4 percent when LCAP defined
strategies are fully implemented.)
17
18. TOM TORLAKSON
State Superintendent
of Public Instruction
School Attendance Review Boards and
Making Adequate Yearly Progress
• For elementary and middle school grades, the
State Board of Education approved an average
attendance rate of 90 percent for Adequate
Yearly Progress (AYP) in 2015. SARBs should
provide intensive assistance to elementary or
middle schools with an average attendance rate
below 90 percent.
• For high schools, the cohort graduation rate is
the indicator for AYP. High schools with low
cohort graduation rates and high dropout rates
should be provided intensive assistance by the
SARB.
18
19. TOM TORLAKSON
State Superintendent
of Public Instruction
Model School Attendance Review Boards
• The Model SARB process is an effective tool
with three approaches to combating truancy
and to making measurable progress in chronic
absenteeism rates in the LCAP.
• The SARB leads a process of prevention and
different levels of intervention with the goal of
reducing chronic absence rates for all student
groups.
• The SARB’s collaborative, multi-disciplinary,
problem-solving approach identifies and
addresses barriers to attendance.
19
21. TOM TORLAKSON
State Superintendent
of Public Instruction
History of the State School Attendance
Review Board
• In 1987, EC Section 48325 authorized the State
Superintendent of Public Instruction (SSPI) to
convene the State SARB. Its mission is to provide
guidance and strategies for prevention and early
intervention to promote regular school attendance
and higher graduation rates.
• State SARB members are invited to participate on
the Board by the SSPI; the State SARB makes
annual recommendations to the SSPI.
• State SARB meetings are held quarterly at the CDE;
participants also attend via videoconference.
21
24. TOM TORLAKSON
State Superintendent
of Public Instruction
As each intervention is
utilized, the goal is that
students will be “screened
back” to positive
attendance.
Truancy/Chronic Absence Interventions
24
25. TOM TORLAKSON
State Superintendent
of Public Instruction
Example of Successful Truancy Interventions
The chart below shows the effectiveness of truancy interventions, with only 3 percent of identified truants
referred to a SARB in Sonoma County.
Source: AG’s 2013 Report on CA Elementary School Truancy and Chronic Absenteeism Crisis 25
26. TOM TORLAKSON
State Superintendent
of Public Instruction
School Attendance Review Board
Any minor pupil may be referred to SARB if he/she is:
•A habitual truant;
•Irregular in attendance;
•Habitually insubordinate or disorderly during
attendance at school.
A SARB referral should be made once the school has
exhausted its resources and interventions since SARB
referral is a Tier 3 intervention.
26
Referral Standards
27. TOM TORLAKSON
State Superintendent
of Public Instruction
School Attendance Review Board (Cont.)
(A) A parent
(B) A representative of school districts
(C) A representative of the county probation department
(D) A representative of the county welfare department
(E) A representative of the county superintendent of schools
(F) A representative of law enforcement agencies
(G) A representative of community-based youth service agencies
(H) A representative of school guidance personnel
(I) A representative of child welfare and attendance personnel
(J) A representative of school or county health care personnel
(K) A representative of school, county, or community mental health
(L) A representative of the public defender’s office
(M) A representative of the district attorney’s office
27
*County SARBs shall include, but need not be limited to, all of the above per EC Section 48321(a)(2).
*Local SARBs may include, but need not be limited to, all of the above per EC Section 48321(b)(1).
Composition
28. TOM TORLAKSON
State Superintendent
of Public Instruction
Attendance Investigations
EC Section 48290 states:
The governing board of any school district, shall, on the
complaint of any person, make full and impartial
investigation of all charges against any parent, guardian,
or other person having control or charge of any child, for
violation of any of the provisions of this chapter.
(Enacted by Stats. 1976, Ch. 1010.)
28
School Attendance Review Board (Cont.)
29. TOM TORLAKSON
State Superintendent
of Public Instruction
Required Referrals
EC Section 48291 states:
If it appears upon investigation that any parent, guardian, or other person
having control or charge of any child has violated any of the provisions of this
chapter, the secretary of the board of education, except as provided in Section
48292, or the clerk of the board of trustees, shall refer such person to a school
attendance review board. In the event that any such parent, guardian, or other
person continually and willfully fails to respond to directives of the school
attendance review board or services provided, the school attendance review
board shall direct the school district to make and file in the proper court a
criminal complaint against the parent, guardian, or other person, charging the
violation, and shall see that the charge is prosecuted by the proper authority. In
the event that a criminal complaint is not prosecuted by the proper authority as
recommended, the official making the determination not to prosecute shall
provide the school attendance review board with a written explanation for the
decision not to prosecute.
(Amended by State 1980, Ch.1329, Sec.7.)
29
School Attendance Review Board (Cont.)
30. TOM TORLAKSON
State Superintendent
of Public Instruction • The multi-agency composition of the local SARB
provides for a wealth of experience and expertise.
• Many families referred to the SARB already have been
referred to public service agencies. Agencies working
together can “put the pieces together” to create a
comprehensive plan to provide needed assistance.
• Information regarding student records may be shared
with members of the SARB (EC Section 49076[a][1][A]);
this allows SARB members to have a more complete
picture of the student’s current situation.
30
School Attendance Review Board (Cont.)
Collaboration
31. TOM TORLAKSON
State Superintendent
of Public Instruction 1. State the overall purpose of the SARB meeting
2. Introduce the SARB panel
3. Ask the family if they know why they have been
summoned to the SARB
4. Report history of student’s attendance
5. Present report from school representative listing all
school interventions and results
31
School Attendance Review Board (Cont.)
Meeting Procedures (Tier 3)
32. TOM TORLAKSON
State Superintendent
of Public Instruction
• SARB panel members and families address problems and
make recommendations for resolving the problems.
• Recommendations are formalized into written directives.
• The written directive/SARB contract is signed by the
student, parents/guardians/caregivers, the SARB
Chairperson, and school district representative. The
directive should include expectations, responsibilities,
referrals, and a monitoring timeline.
• The SARB may require the student and/or
parent/guardian/caregiver to provide proof of
participation/completion of community services.
(EC Section 48263)
32
School Attendance Review Board (Cont.)
Directives
33. TOM TORLAKSON
State Superintendent
of Public Instruction
The SARB follows up on the student’s behavior and
attendance and on the implementation of directives to assess
progress and determine next steps.
•Send follow-up letter with reminder about SARB directives
and continued monitoring
•Place SARB Identification sticker in cumulative folder
•Request progress reports from school site
•Check on contract conditions
•Provide rewards/acknowledgements for improvement
•Noncompliance results in a referral for legal recourse
33
Follow-up Procedures for Tier 3
Interventions
School Attendance Review Board (Cont.)
34. TOM TORLAKSON
State Superintendent
of Public Instruction
Best Practices and Resources
• Annual SARB Report (include chronic absence)
to County Superintendent
• Model SARB Recognition Program (data
analysis)
• Great Collaboration with Partners
• Contact Information for Model SARB
Chairpersons
34
School Attendance Review Board (Cont.)
35. TOM TORLAKSON
State Superintendent
of Public Instruction
Annual Report
• The State SARB has recommended a format for local
SARBs to use in compliance with EC Section 48273; the
template is available on the CDE’s Reports of SARB
Outcomes Web page at http://
www.cde.ca.gov/ls/ai/sb/outcomereport.asp.
• Using a uniform format for this report will:
o Enable SARBs to regularly and accurately assess
their local programs for reducing truancy and
improving attendance in the county.
o Provide SARBs with constructive data to inform their
decisions regarding dropout prevention.
35
School Attendance Review Board (Cont.)
36. TOM TORLAKSON
State Superintendent
of Public Instruction
Model School Attendance Review Board
Recognition Program
• Identify and recognize outstanding results-based
school attendance improvement programs and
creates a resource list of quality programs for
dropout reduction.
• Model SARBs serve as mentors to other SARBs
throughout the state.
• SARBs are encouraged to apply to become a
Model SARB; applications and the Scoring Rubric
are available on the CDE Web site.
36
Overview
37. TOM TORLAKSON
State Superintendent
of Public Instruction
• Application Certification Form (Required)
• Narratives for Content Areas 1–4, including
analysis of subgroup data (Required)
• Letters of Support for Content Area 5
(Required)
• Additional Content Area (Choose one)
37
Model School Attendance Review Board
Recognition Program (Cont.)
Application Requirements
38. TOM TORLAKSON
State Superintendent
of Public Instruction
• There is a recognized need to:
o Establish better attendance policies, practices,
and procedures throughout the state.
o Share effective practices and strategies.
• The California Association of Supervisors of Child
Welfare and Attendance and the State SARB
endorse the Model SARB Recognition Program.
• For information about Model SARBs, please contact
David Kopperud at cwa@cde.ca.gov.
38
Model School Attendance Review Board
Recognition Program (Cont.)
Objectives of the Model SARB Recognition Program
40. TOM TORLAKSON
State Superintendent
of Public Instruction
Resources
• Attorney General’s 2013 Report on California’s Elementary
School Truancy and Chronic Absenteeism Crisis
http://oag.ca.gov/truancy
• State SARB Handbook 2015
http://ww.cde.ca.gov/ls/ai/sb/sarbhandbook.asp
• State School Attendance Review Boards
http://www.cde.ca.gov/ls/ai/sb
• CDE Behavioral Intervention Strategies and Supports
http://www.cde.ca.gov/ls/ss/se/behaviorialintervention.asp
*Many sample SARB documents have been translated and are
available through the CDE.
40
41. TOM TORLAKSON
State Superintendent
of Public Instruction
Quote from the State
Superintendent
• “You can have the best facilities,
the best teachers, and the best
curriculum in the world, but none
of that matters if students are not
in school.”
• Tom Torlakson, State
Superintendent of Public
Instruction
41
42. TOM TORLAKSON
State Superintendent
of Public Instruction
Contact Information
For technical assistance in preparing an application for the Model
SARB Recognition Program contact:
David Kopperud, Education Programs Consultant
Coordinated Student Support Division
California Department of Education
1430 N Street, Suite 6408
Sacramento, CA 95814
Phone: 916-323-1028
E-mail: dkopperud@cde.ca.gov
The State SARB wants to identify new Model SARBs every school
year. This year’s awards ceremony will be held in Southern
California.
42