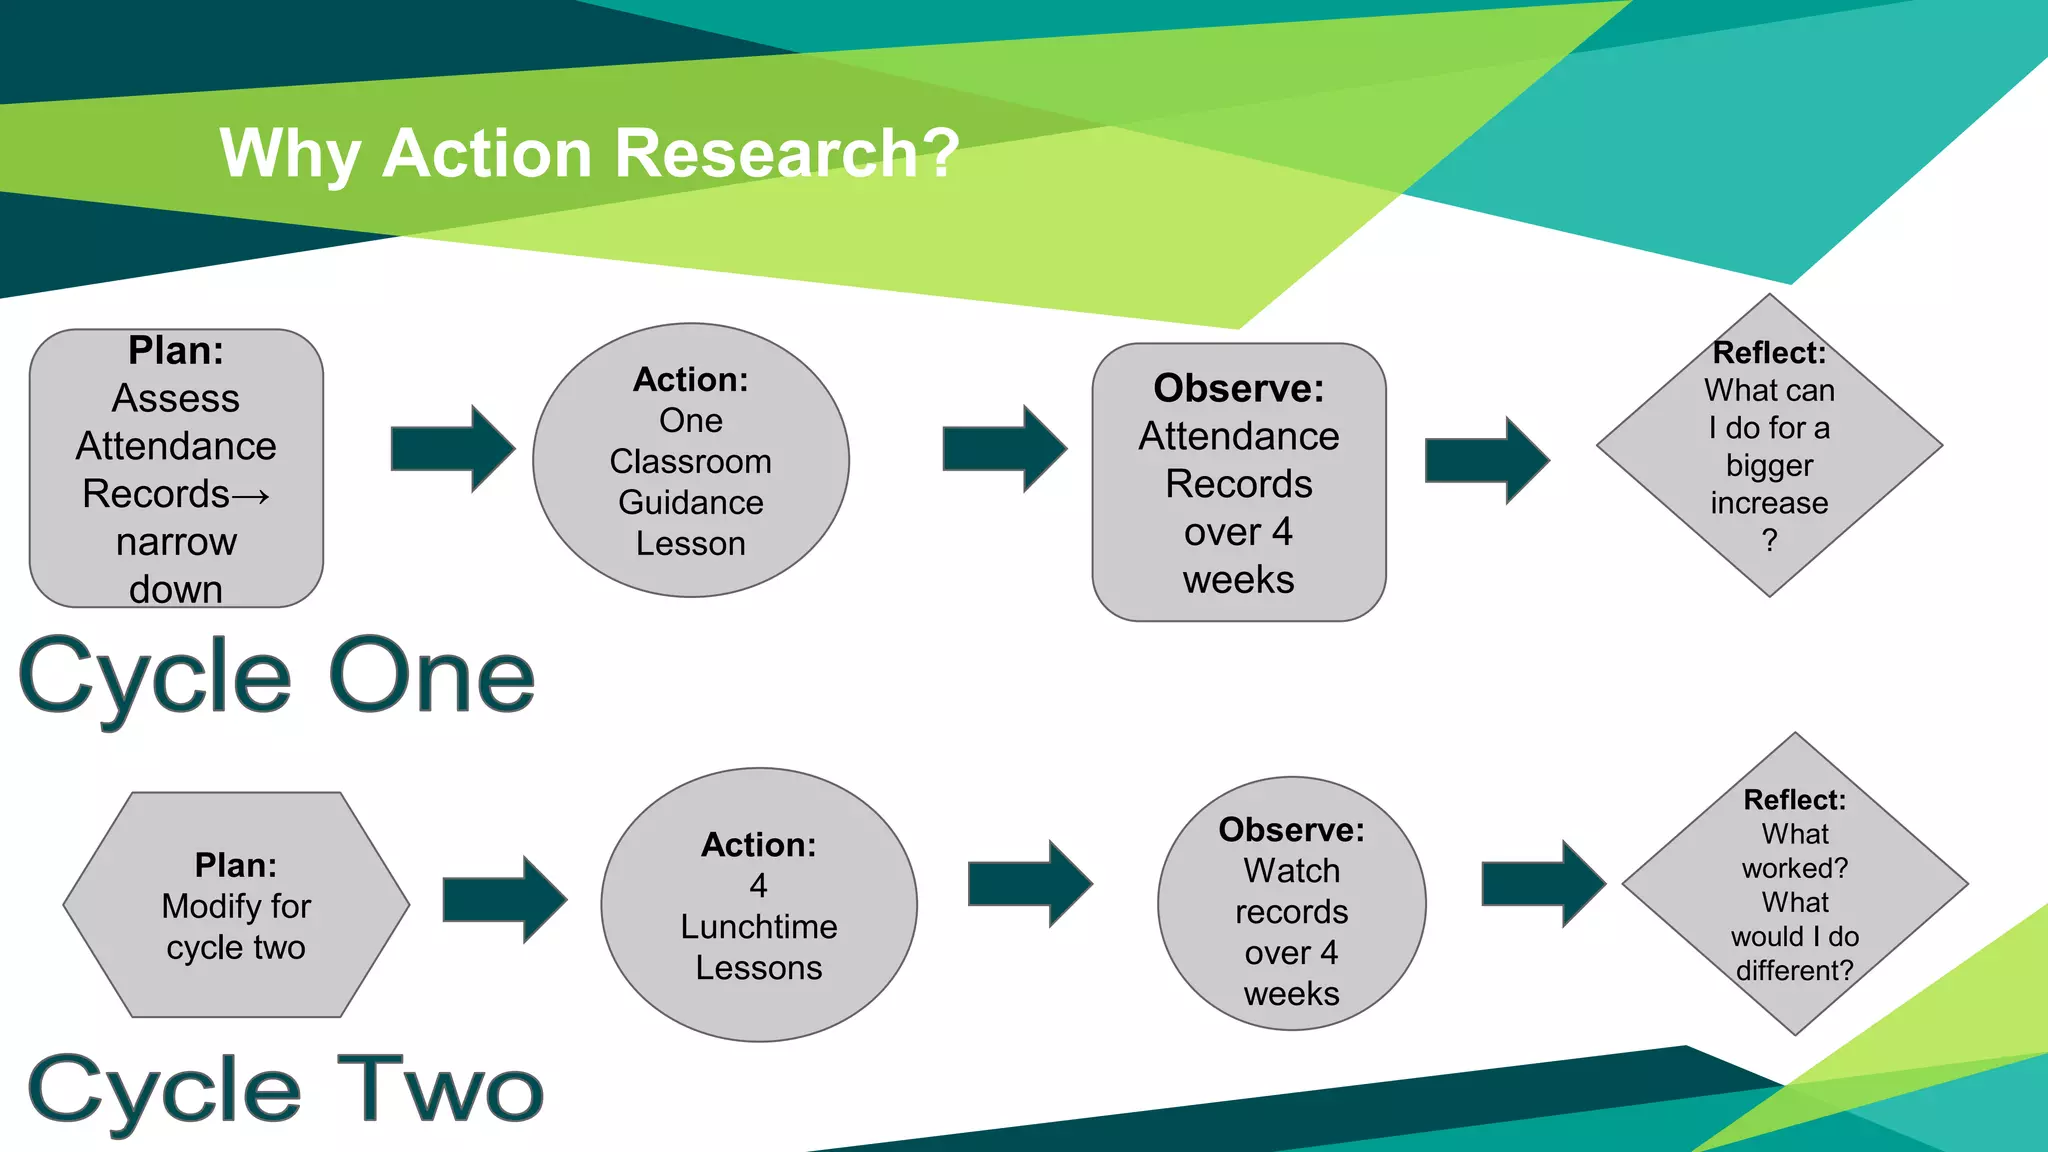
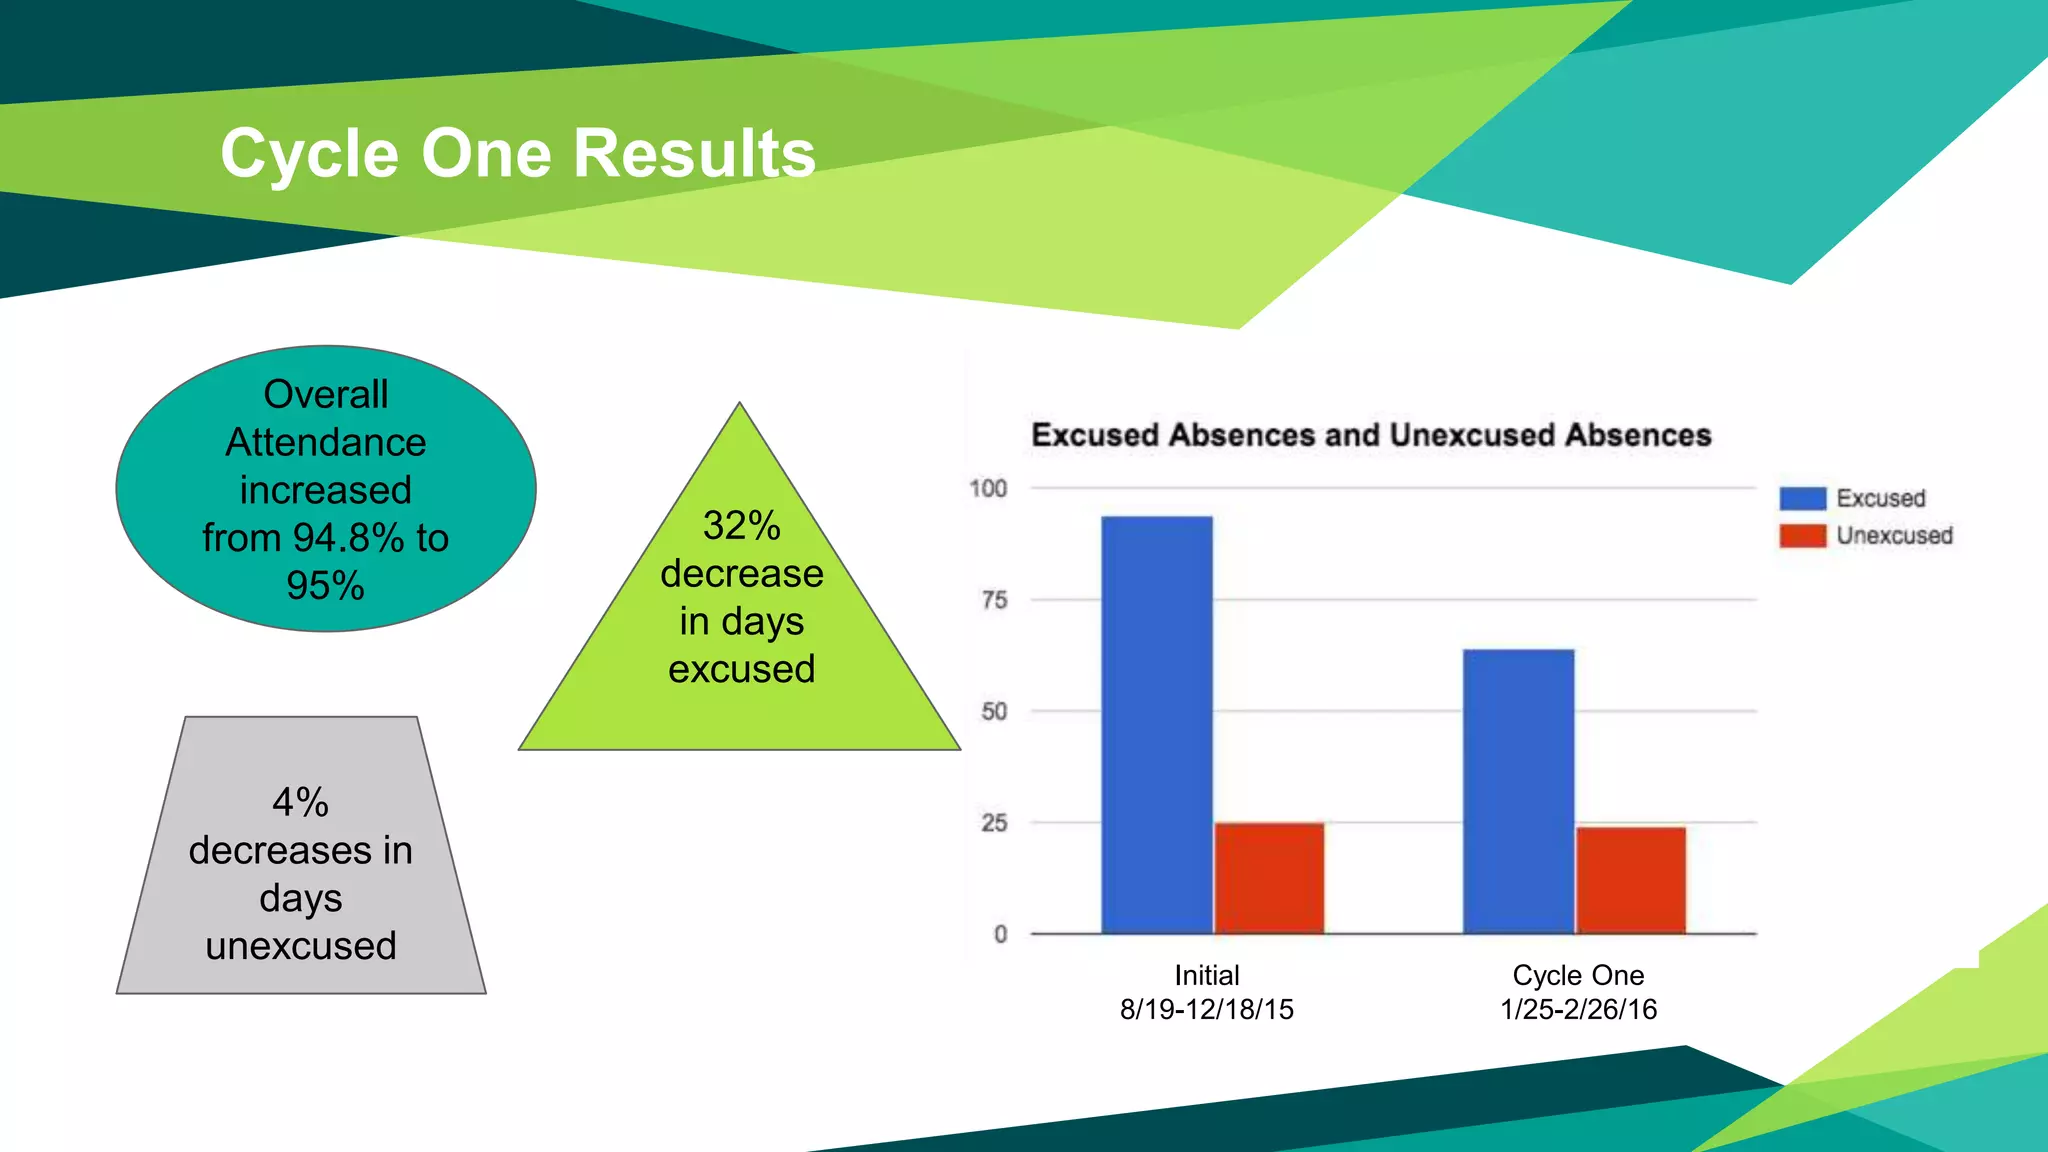
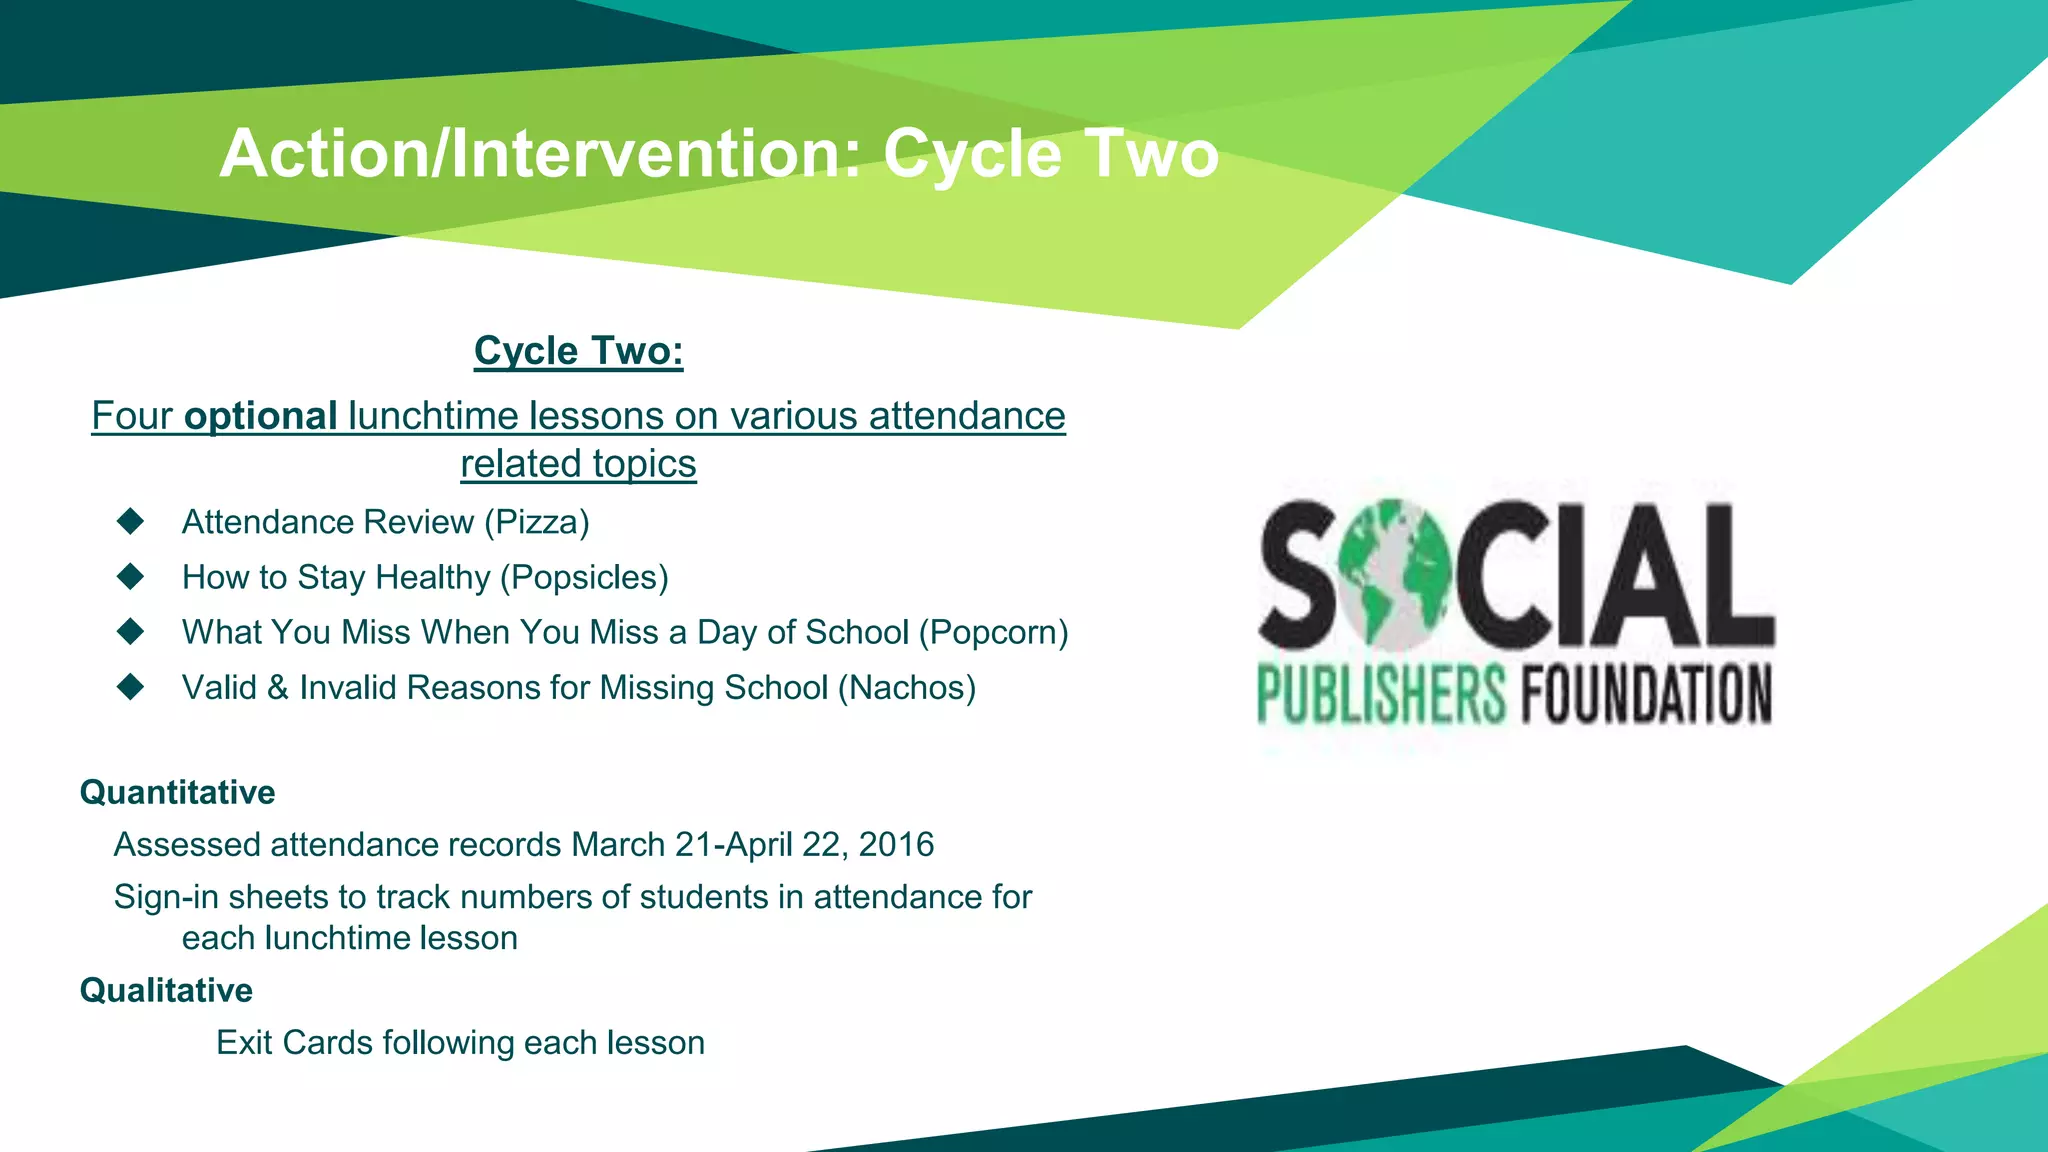
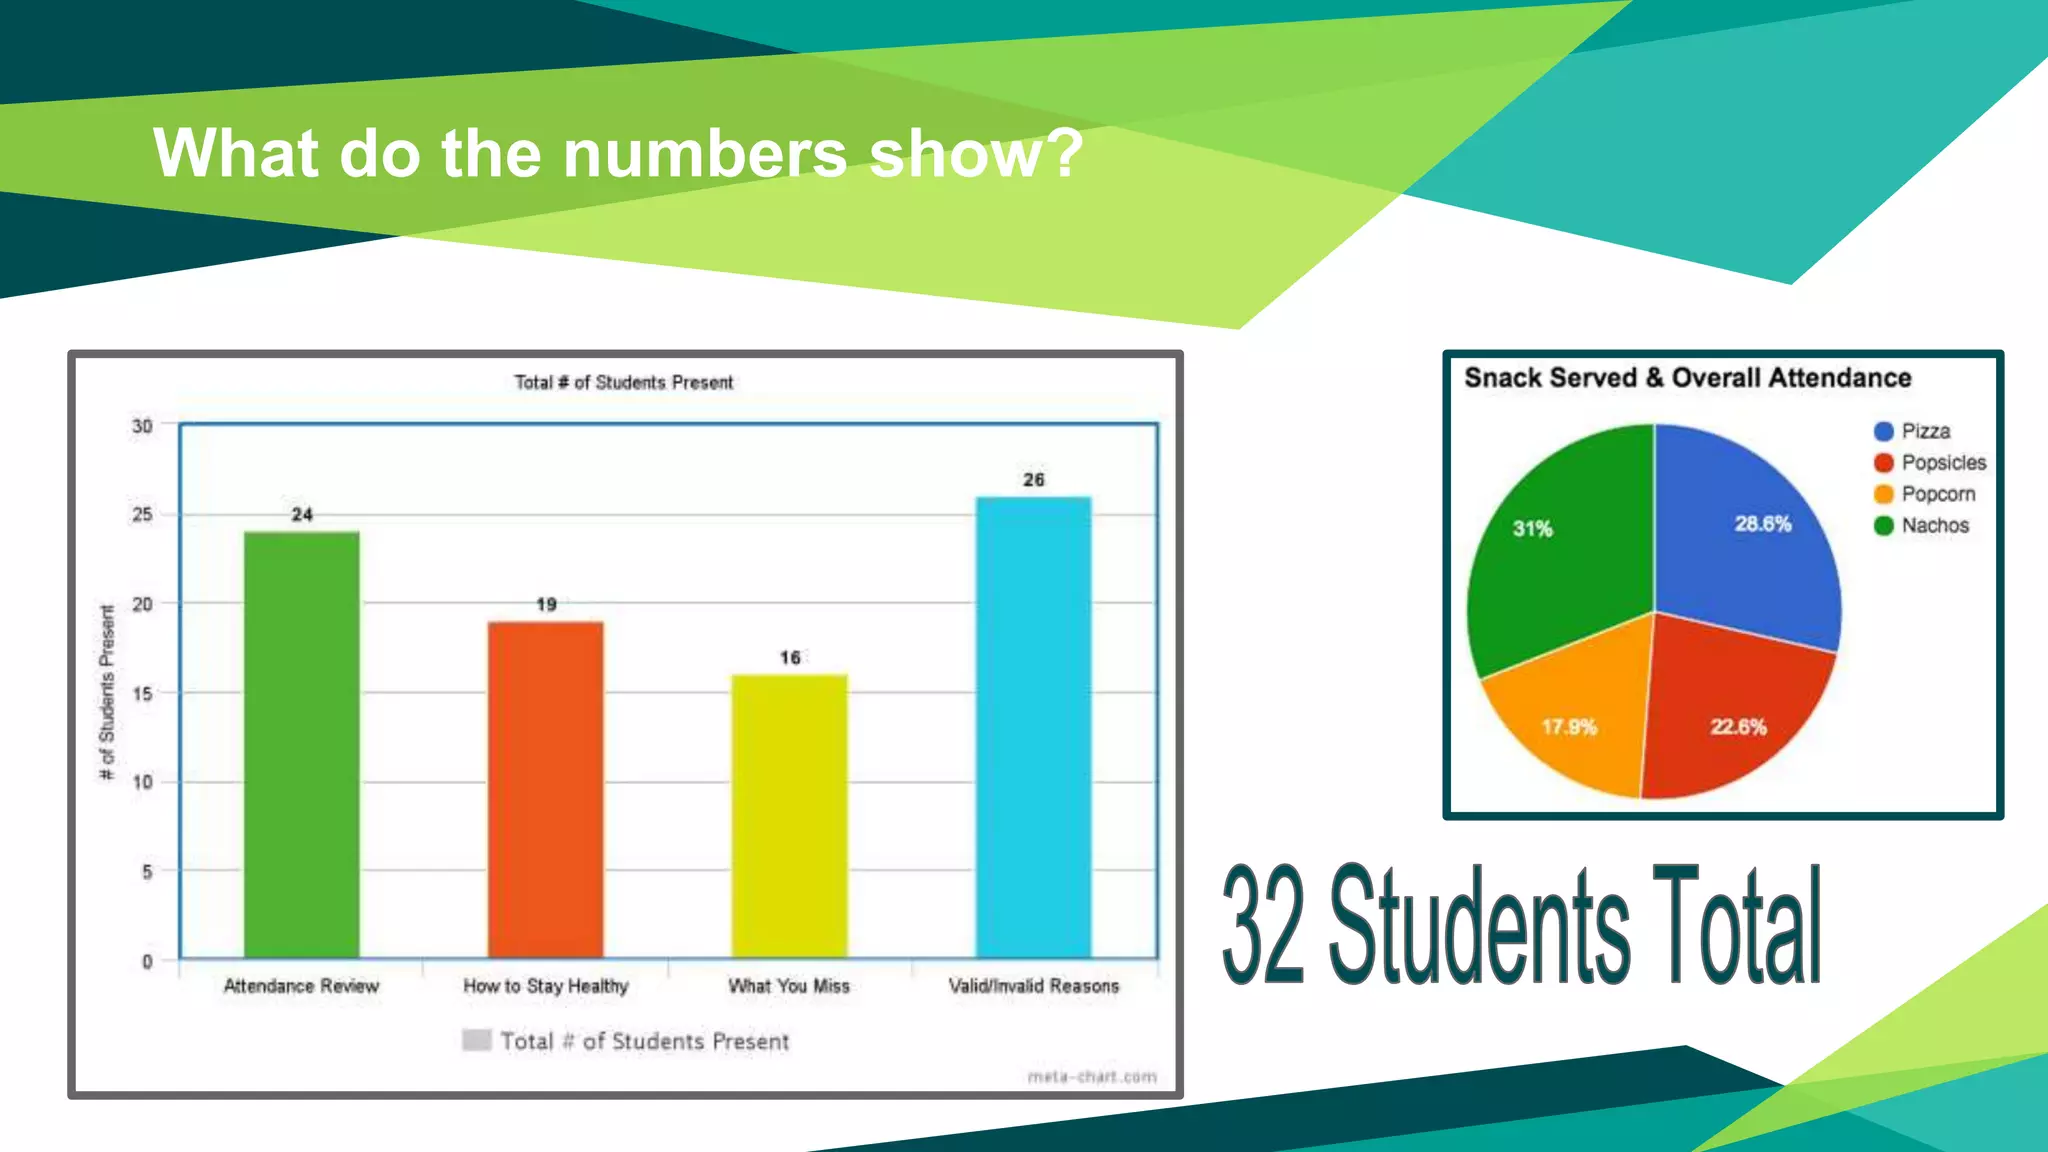
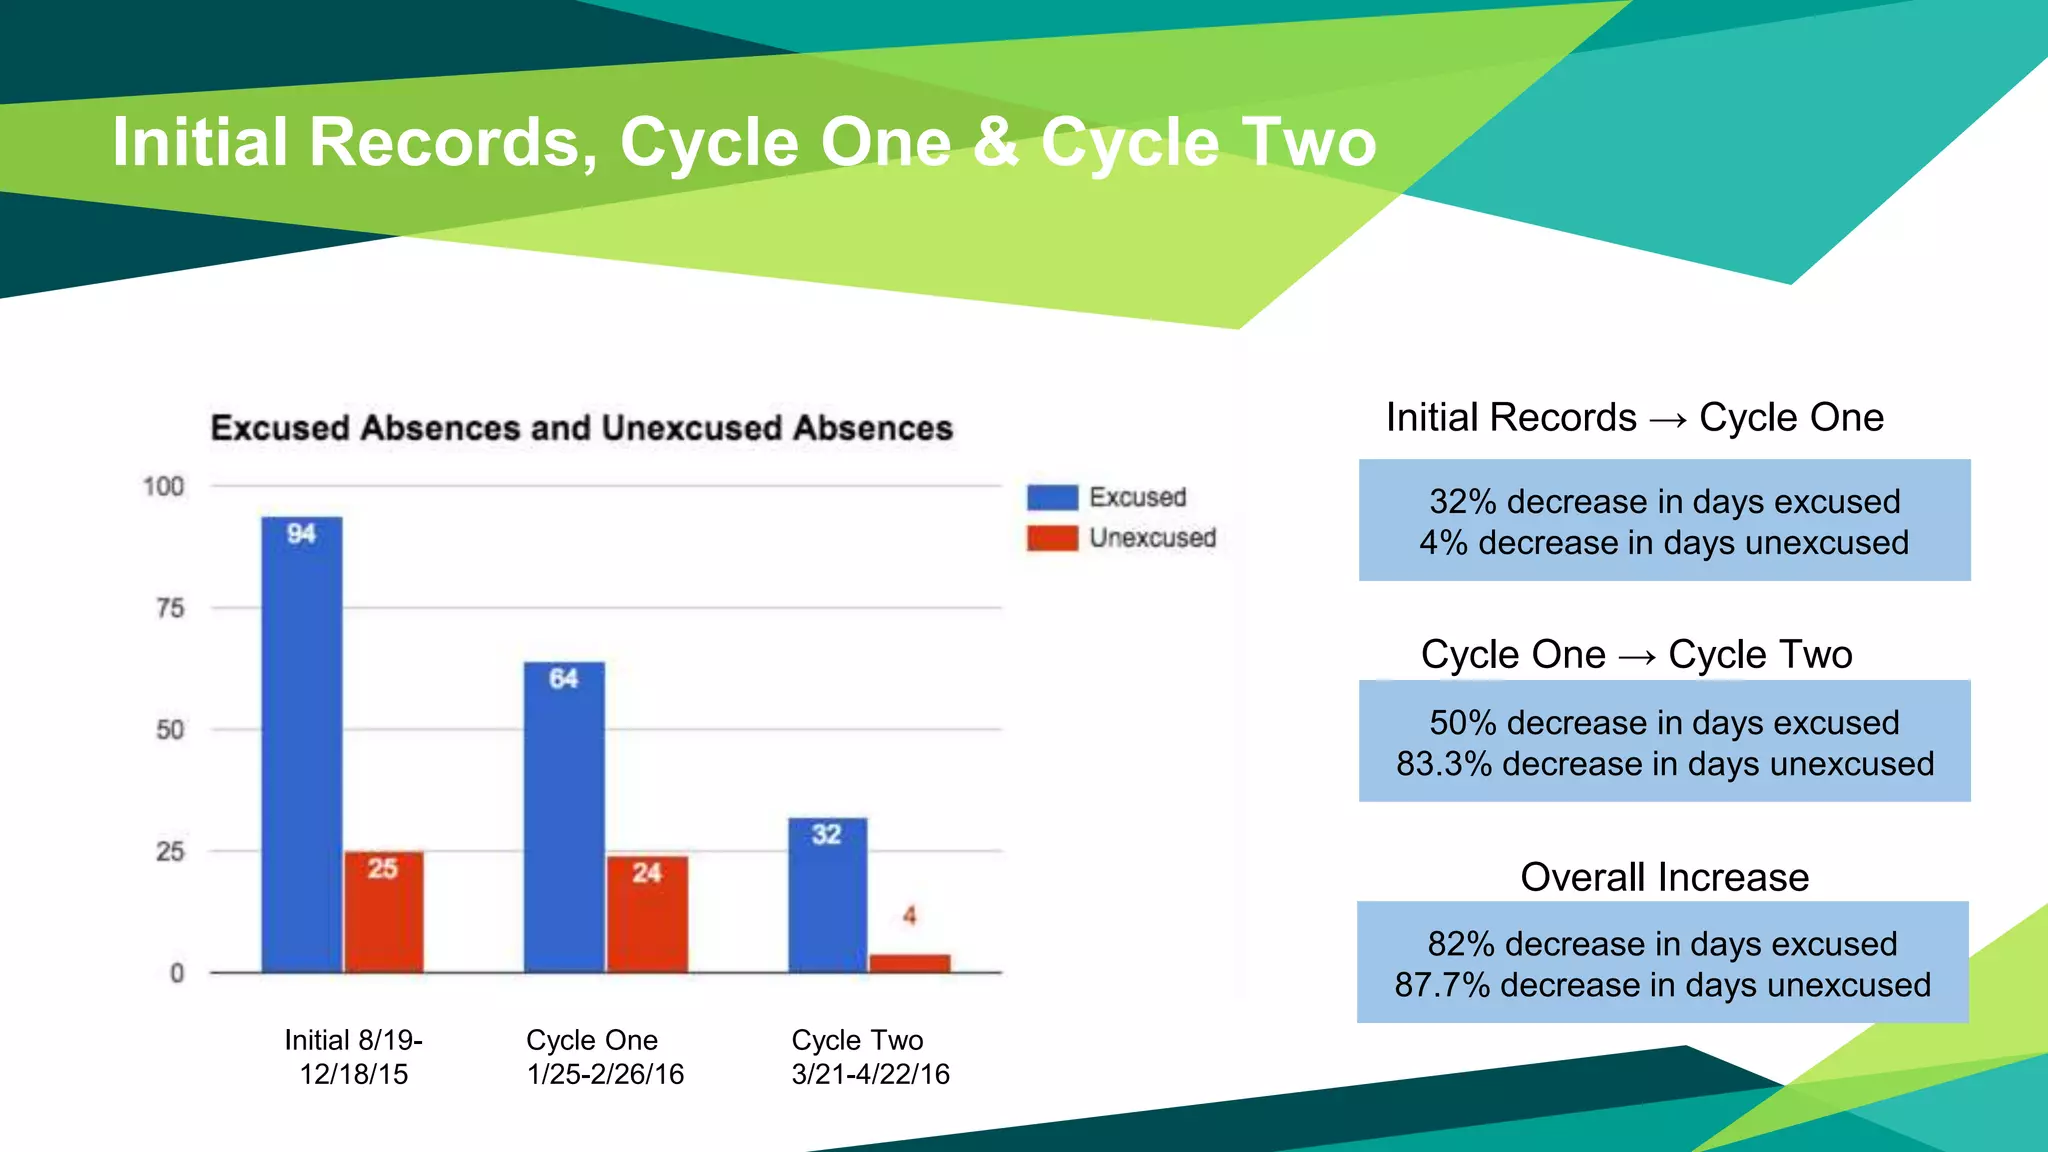
Attendance: Using
Attendance Records
to Drive Interventions
Allyson Christine Wilkins
M.A. Candidate in School Counseling
The University of San Diego
Tell me about Midland Elementary
 Poway Unified School District
 Serves K-5
 35% of the population qualify for
free/reduced lunches and Title I support
 Population: 850 students
 50% Caucasian, 32% Hispanic, 7%
Asian, 4% Filipino, 3% African-
American, 3% Other
 35% of student population are English
Language Learners
What were my concerns?
 Midland Interview
 Grand Central Station
 Attendance History
 Setting the Expectations
Will attendance percentages of the class
with the lowest attendance rates on
campus be improved with interventions
implemented by the school counseling
intern?
Research Question
Review of Literature
“The costs and impact of chronic truancy are
significant, with both short- and long-term
implications for the truant youth as well as for
the family, school, and community”
(Maynard, B. R., McCrea, K. T., Pigott, T.
D., Kelly, M. S., & Campbell, C., 2012, p. 5)
“Student absenteeism has a direct
association with poor academic
performance”
(Weismuller, Grasska, Alexander,
White, & Kramer, 2007, p. 111-118).
An estimated 5 to 7.5 million
students miss 18 or more
days of school each year, or
nearly an entire month or more
of school, which puts them at
significant risk of falling behind
academically and failing to
graduate from high school.
(U.S. Department of Education,
2016)
A past Action Research project
conducted at USD studied
interventions to combat
absenteeism through discussing
“the importance of school and
the students” and it was found
at the end of the program that
students were motivated to
come to school by
incentives, they enjoyed
check-ins because they made
them feel special and proud
and lastly they enjoyed the
program because of it’s positive
effects on their academics
simply by their increased
presence
(Cole, J. F., 2011, p. 62-70).
Why Action Research?
Reflect:
What can
I do for a
bigger
increase
?
Plan:
Modify for
cycle two
Observe:
Watch
records
over 4
weeks
Plan:
Assess
Attendance
Records→
narrow
down
Action:
One
Classroom
Guidance
Lesson
Observe:
Attendance
Records
over 4
weeks
Reflect:
What
worked?
What
would I do
different?
Action:
4
Lunchtime
Lessons
Overview of this Process
Action/Intervention: Cycle One
Cycle One:
One classroom guidance lesson on
the importance of attendance
 4th grade class
 32 students involved (20 boys, 12 girls)
 Challenged them to increase their
attendance for the next 30 days
(1/25/2016-2/26/2016) to receive a class
appointed incentive
Quantitative
Attendance Records for January 25-February
26, 2016
Cycle One Results
Overall
Attendance
increased
from 94.8% to
95%
4%
decreases in
days
unexcused
Initial
8/19-12/18/15
Cycle One
1/25-2/26/16
32%
decrease
in days
excused
Interpretations & Modifications
Bigger improvement
More hands-on with students
Reflect on past research
Action/Intervention: Cycle Two
Cycle Two:
Four optional lunchtime lessons on various attendance
related topics
 Attendance Review (Pizza)
 How to Stay Healthy (Popsicles)
 What You Miss When You Miss a Day of School (Popcorn)
 Valid & Invalid Reasons for Missing School (Nachos)
Quantitative
Assessed attendance records March 21-April 22, 2016
Sign-in sheets to track numbers of students in attendance for
each lunchtime lesson
Qualitative
Exit Cards following each lesson
“Going on a vacation
and not coming to
school
is an absence“
-Robby
“That
touching your
eyes, mouth
and nose
will get you
sick”
-Louise
“That staying
home for no
reason is not okay”
-Maryam
“Wash my hands for 30
sec”
- Cylus
“I learned that if I was
absent it would count
on my permanent
record
and how many days I
missed”
-Cassie
“You miss a
lot when you
are absent”
-Amanda “Go to school and
wait for summer
or break”
-Thomas
 Class overall attendance
increased from 95% to
98.5%
 Greater awareness of
attendance related topics
 Over 50% class attended
for each optional lesson
 Majority of students
underestimated the total
number of days they had
missed throughout the
year
Cycle Two Results Today I learned….
What do the numbers show?
Initial Records, Cycle One & Cycle Two
Initial 8/19-
12/18/15
Cycle One
1/25-2/26/16
Cycle Two
3/21-4/22/16
32% decrease in days excused
4% decrease in days unexcused
50% decrease in days excused
83.3% decrease in days unexcused
Initial Records → Cycle One
Cycle One → Cycle Two
Overall Increase
82% decrease in days excused
87.7% decrease in days unexcused
0.2% increase
In the first cycle
3.5% increase
In the second cycle
3.7% increase
overall in just 3 months!
Lunchtime Lessons
were more powerful!
Legitimacy of Knowledge Claims
 Collected Quantitative data (Attendance Records)
 Descriptive Statistics (Exit Cards)
 Prolonged Engagement
 Data gathered through:
 Poway Unified School District’s Synergy program
 Student report (Exit Cards)
 National Center for Education Statistics
 Ensures data integrity and accuracy
 Data collection survey and training for staff
Lincoln & Guba, 1985
Significance & Implications
Role of Evidence-Based Research
 No research for Attendance Interventions that are
Evidence-Based
 Research about causes → minimal research on
how to combat them
 Specific to school community
What does the future hold?
● Per Pupil
Loss=$211.20/Student/Day (SD
County)
● School of 800 students who are
currently at 95% attendance
(760/800 attending each day)
● Missing out on $8,448 per day
○ What could these results mean
for a school’s budget? Test
scores? Overall achievement?
Limitations & Recommendations
 New researcher
 Language barriers with
parents
 Administrative approval
 Multi-language Flyers
 Communicating with
teachers
 Scheduling
 More hands-on Cycle One
 Replication Cycle Two +
additional topics
 Parent Involvement
 Parent Night
 Sending home
information
 Resources
 Conduct research to assess and enhance
your counseling program in an appropriate
way
 Stay up-to-date with local resources
 Knowledgeable regarding community data and
statistics
 Embracing the unknown!
 Flexible with scheduling, challenges, needs of
the population etc.
 Much bigger than just working with
students on a daily basis!
What have I learned and how can I apply this?
“In conclusion, attendance percentages of the
class with the lowest attendance rates on
campus were improved with interventions
implemented by the school counseling intern!
REFERENCES
Adelman, H. & Taylor, L.(2006a). The school leader’s guide to student learning supports: New Directions for addressing
barriers to learning. Thousand Oaks, CA: Corwin Press.
Chapter 1: The Economic Impact. (n.d.). Retrieved May 09, 2016, from https://oag.ca.gov/truancy/2013/ch1
Cole, J. F. (2011). Interventions to Combat the Many Facets of Absenteeism: Action Research.
Georgia School Counselors Association Journal, 18(1), 62-70.
Hoffman, L. M. (n.d.). Section Three: Protecting the Privacy of Individuals during the Data Collection Process. Retrieved
May 01, 2016, from https://nces.ed.gov/pubs97/p97527/Sec3_txt.asp
Lincoln and Guba's Evaluative Criteria. (n.d.). Retrieved May 01, 2016, from http://www.qualres.org/HomeLinc-3684.html
Maynard, B. R., McCrea, K. T., Pigott, T. D., Kelly, M. S., & Campbell, C. (2012). Indicated
Truancy Interventions: Effects on School Attendance among Chronic Truant Students.
Campbell Systematic Reviews. 2012:10.Campbell Collaboration,
U.S. Department of Education, Institute of Education Sciences, What Works Clearinghouse. (2014, September). WWC
review of the report: Meeting the challenge of combating chronic absenteeism: Impact of the NYC Mayor’s
Interagency Task Force on chronic absenteeism and school attendance and its implications for other cities.
Retrieved from http://whatworks.ed.gov
Weismuller, P., Grasska, M., Alexander, M., White, C., & Kramer, P. (2007). Elementary school
Thank you for
your time today!
Any questions?

Ar (4)

  • 1.
    Attendance: Using Attendance Records toDrive Interventions Allyson Christine Wilkins M.A. Candidate in School Counseling The University of San Diego
  • 2.
    Tell me aboutMidland Elementary  Poway Unified School District  Serves K-5  35% of the population qualify for free/reduced lunches and Title I support  Population: 850 students  50% Caucasian, 32% Hispanic, 7% Asian, 4% Filipino, 3% African- American, 3% Other  35% of student population are English Language Learners
  • 3.
    What were myconcerns?  Midland Interview  Grand Central Station  Attendance History  Setting the Expectations
  • 4.
    Will attendance percentagesof the class with the lowest attendance rates on campus be improved with interventions implemented by the school counseling intern? Research Question
  • 5.
    Review of Literature “Thecosts and impact of chronic truancy are significant, with both short- and long-term implications for the truant youth as well as for the family, school, and community” (Maynard, B. R., McCrea, K. T., Pigott, T. D., Kelly, M. S., & Campbell, C., 2012, p. 5) “Student absenteeism has a direct association with poor academic performance” (Weismuller, Grasska, Alexander, White, & Kramer, 2007, p. 111-118). An estimated 5 to 7.5 million students miss 18 or more days of school each year, or nearly an entire month or more of school, which puts them at significant risk of falling behind academically and failing to graduate from high school. (U.S. Department of Education, 2016) A past Action Research project conducted at USD studied interventions to combat absenteeism through discussing “the importance of school and the students” and it was found at the end of the program that students were motivated to come to school by incentives, they enjoyed check-ins because they made them feel special and proud and lastly they enjoyed the program because of it’s positive effects on their academics simply by their increased presence (Cole, J. F., 2011, p. 62-70).
  • 6.
    Why Action Research? Reflect: Whatcan I do for a bigger increase ? Plan: Modify for cycle two Observe: Watch records over 4 weeks Plan: Assess Attendance Records→ narrow down Action: One Classroom Guidance Lesson Observe: Attendance Records over 4 weeks Reflect: What worked? What would I do different? Action: 4 Lunchtime Lessons
  • 7.
  • 8.
    Action/Intervention: Cycle One CycleOne: One classroom guidance lesson on the importance of attendance  4th grade class  32 students involved (20 boys, 12 girls)  Challenged them to increase their attendance for the next 30 days (1/25/2016-2/26/2016) to receive a class appointed incentive Quantitative Attendance Records for January 25-February 26, 2016
  • 9.
    Cycle One Results Overall Attendance increased from94.8% to 95% 4% decreases in days unexcused Initial 8/19-12/18/15 Cycle One 1/25-2/26/16 32% decrease in days excused
  • 10.
    Interpretations & Modifications Biggerimprovement More hands-on with students Reflect on past research
  • 11.
    Action/Intervention: Cycle Two CycleTwo: Four optional lunchtime lessons on various attendance related topics  Attendance Review (Pizza)  How to Stay Healthy (Popsicles)  What You Miss When You Miss a Day of School (Popcorn)  Valid & Invalid Reasons for Missing School (Nachos) Quantitative Assessed attendance records March 21-April 22, 2016 Sign-in sheets to track numbers of students in attendance for each lunchtime lesson Qualitative Exit Cards following each lesson
  • 12.
    “Going on avacation and not coming to school is an absence“ -Robby “That touching your eyes, mouth and nose will get you sick” -Louise “That staying home for no reason is not okay” -Maryam “Wash my hands for 30 sec” - Cylus “I learned that if I was absent it would count on my permanent record and how many days I missed” -Cassie “You miss a lot when you are absent” -Amanda “Go to school and wait for summer or break” -Thomas  Class overall attendance increased from 95% to 98.5%  Greater awareness of attendance related topics  Over 50% class attended for each optional lesson  Majority of students underestimated the total number of days they had missed throughout the year Cycle Two Results Today I learned….
  • 13.
    What do thenumbers show?
  • 14.
    Initial Records, CycleOne & Cycle Two Initial 8/19- 12/18/15 Cycle One 1/25-2/26/16 Cycle Two 3/21-4/22/16 32% decrease in days excused 4% decrease in days unexcused 50% decrease in days excused 83.3% decrease in days unexcused Initial Records → Cycle One Cycle One → Cycle Two Overall Increase 82% decrease in days excused 87.7% decrease in days unexcused
  • 15.
    0.2% increase In thefirst cycle 3.5% increase In the second cycle 3.7% increase overall in just 3 months! Lunchtime Lessons were more powerful!
  • 16.
    Legitimacy of KnowledgeClaims  Collected Quantitative data (Attendance Records)  Descriptive Statistics (Exit Cards)  Prolonged Engagement  Data gathered through:  Poway Unified School District’s Synergy program  Student report (Exit Cards)  National Center for Education Statistics  Ensures data integrity and accuracy  Data collection survey and training for staff Lincoln & Guba, 1985
  • 17.
  • 18.
    Role of Evidence-BasedResearch  No research for Attendance Interventions that are Evidence-Based  Research about causes → minimal research on how to combat them  Specific to school community What does the future hold? ● Per Pupil Loss=$211.20/Student/Day (SD County) ● School of 800 students who are currently at 95% attendance (760/800 attending each day) ● Missing out on $8,448 per day ○ What could these results mean for a school’s budget? Test scores? Overall achievement?
  • 19.
    Limitations & Recommendations New researcher  Language barriers with parents  Administrative approval  Multi-language Flyers  Communicating with teachers  Scheduling  More hands-on Cycle One  Replication Cycle Two + additional topics  Parent Involvement  Parent Night  Sending home information  Resources
  • 20.
     Conduct researchto assess and enhance your counseling program in an appropriate way  Stay up-to-date with local resources  Knowledgeable regarding community data and statistics  Embracing the unknown!  Flexible with scheduling, challenges, needs of the population etc.  Much bigger than just working with students on a daily basis! What have I learned and how can I apply this?
  • 21.
    “In conclusion, attendancepercentages of the class with the lowest attendance rates on campus were improved with interventions implemented by the school counseling intern!
  • 22.
    REFERENCES Adelman, H. &Taylor, L.(2006a). The school leader’s guide to student learning supports: New Directions for addressing barriers to learning. Thousand Oaks, CA: Corwin Press. Chapter 1: The Economic Impact. (n.d.). Retrieved May 09, 2016, from https://oag.ca.gov/truancy/2013/ch1 Cole, J. F. (2011). Interventions to Combat the Many Facets of Absenteeism: Action Research. Georgia School Counselors Association Journal, 18(1), 62-70. Hoffman, L. M. (n.d.). Section Three: Protecting the Privacy of Individuals during the Data Collection Process. Retrieved May 01, 2016, from https://nces.ed.gov/pubs97/p97527/Sec3_txt.asp Lincoln and Guba's Evaluative Criteria. (n.d.). Retrieved May 01, 2016, from http://www.qualres.org/HomeLinc-3684.html Maynard, B. R., McCrea, K. T., Pigott, T. D., Kelly, M. S., & Campbell, C. (2012). Indicated Truancy Interventions: Effects on School Attendance among Chronic Truant Students. Campbell Systematic Reviews. 2012:10.Campbell Collaboration, U.S. Department of Education, Institute of Education Sciences, What Works Clearinghouse. (2014, September). WWC review of the report: Meeting the challenge of combating chronic absenteeism: Impact of the NYC Mayor’s Interagency Task Force on chronic absenteeism and school attendance and its implications for other cities. Retrieved from http://whatworks.ed.gov Weismuller, P., Grasska, M., Alexander, M., White, C., & Kramer, P. (2007). Elementary school
  • 23.
    Thank you for yourtime today! Any questions?

Editor's Notes

  • #2 Say name!
  • #4 Break it down
  • #6  “Current absentee policy is mainly reactive. Proactive policy is necessary to expand efforts for prevention and for intervening as early as feasible after attendance problems are noted. The levels of intervention are designed to • promote healthy development and prevent problems • intervene early to address problems as soon after onset as is feasible • assist with chronic and severe problems. Each level represents a subsystem. The three subsystems overlap. All three are conceived as an interconnected system that strives to weave together school and community resources” (Adelman & Taylor, 2006a, b, 2015; Center for Mental Health in Schools, 2008a, b).
  • #7 Make this personalized to this project
  • #12 Relate back to Research: check-ins made students feel special
  • #13 MEntion today I learned…
  • #17 Mostly quanitative with Descriptive statistics (tallying exit cards) STUDY EXPLAINING RELIABILITY AND VALIDITY WITH ATTENDANCE RECORDS Lincoln and guba D. Ensuring Data Integrity and Accuracy Data collectors may promote data integrity and accuracy through two efforts: Making sure data providers understand the importance of the data Designing the data collection activity and training survey staff to respect the dignity of the respondents An important consideration in choosing data elements and the procedures to collect data is the quality of the data that will be received. Data integrity means that the information provided is complete and unchanging; data accuracy means that the information is correct. Two issues are important in ensuring data integrity and accuracy. The first is the degree to which the data provider (usually the student or parent) supports the data collection. It is important for students and their parents to know if the data being requested are required by law or for the purposes of ensuring that certain services can be received by the child. They need to understand when failure to provide accurate and complete data may result in the denial of benefits (e.g., immunization records required to enroll a child in school). For most data elements or data collection forms, you should inform students or their parents about why the data are important and how they will and will not be used. Written assurances of data confidentiality often alleviate concerns and elicit more cooperation, but not in all cases. You should be prepared to respond openly and thoroughly to hard questions raised by parents and privacy advocates. A second issue that can affect data integrity and accuracy is the design of the data collection activity and the training provided to data collectors. Training is important for all staff who might be involved in collecting student information, regardless of the purposes. Such staff may include teachers, school secretaries, school nurses, guidance counselors, principals, and evaluators. Areas that should be included in staff training are: The distinction between collecting data that are mandatory and those that are voluntary; and the options of the student or parent regarding provision of the data (e.g., what services might be missed, such as free meals) The ethical and legal responsibilities of staff to prevent unauthorized use or disclosure of data The ways staff can obtain explanations or other help while collecting the data The training should focus on how the questions or requests for information may be stated by the staff person to ensure that the request is clear and the data can be collected consistently from all individuals. For instance, it is important for data collection procedures to ensure that parents and students have the opportunity to provide accurate answers regardless of their language, cultural, or educational backgrounds. Staff should be sensitive to and respectful of respondents' privacy and their possible reluctance to answer a question. The information belongs to the individual; you are just "borrowing" it.
  • #18 Justify data for each one
  • #19 Most trusted through randomized testing Research fueled toward increasing attendance, but no e.b. Presearch surround attendance YET