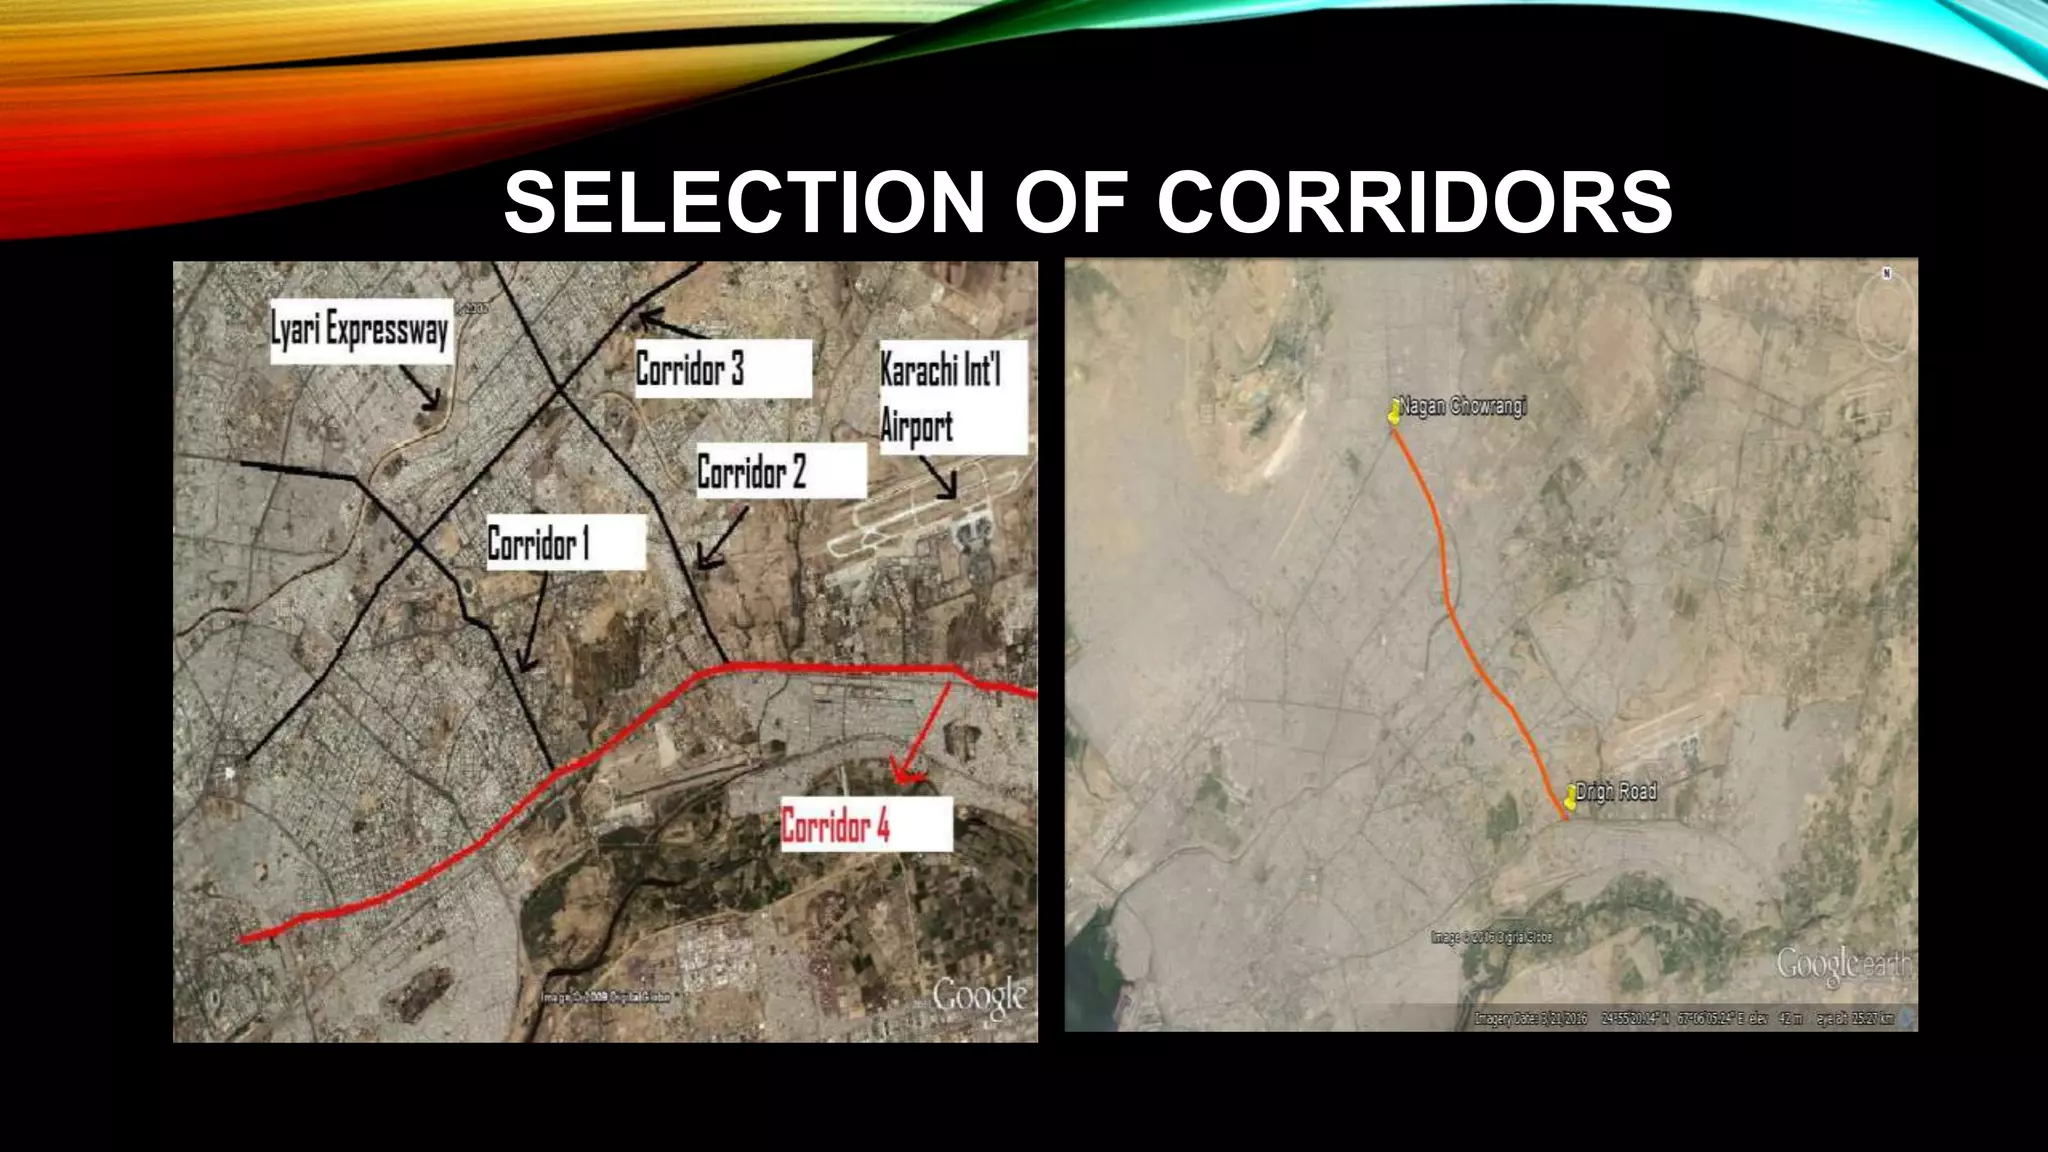
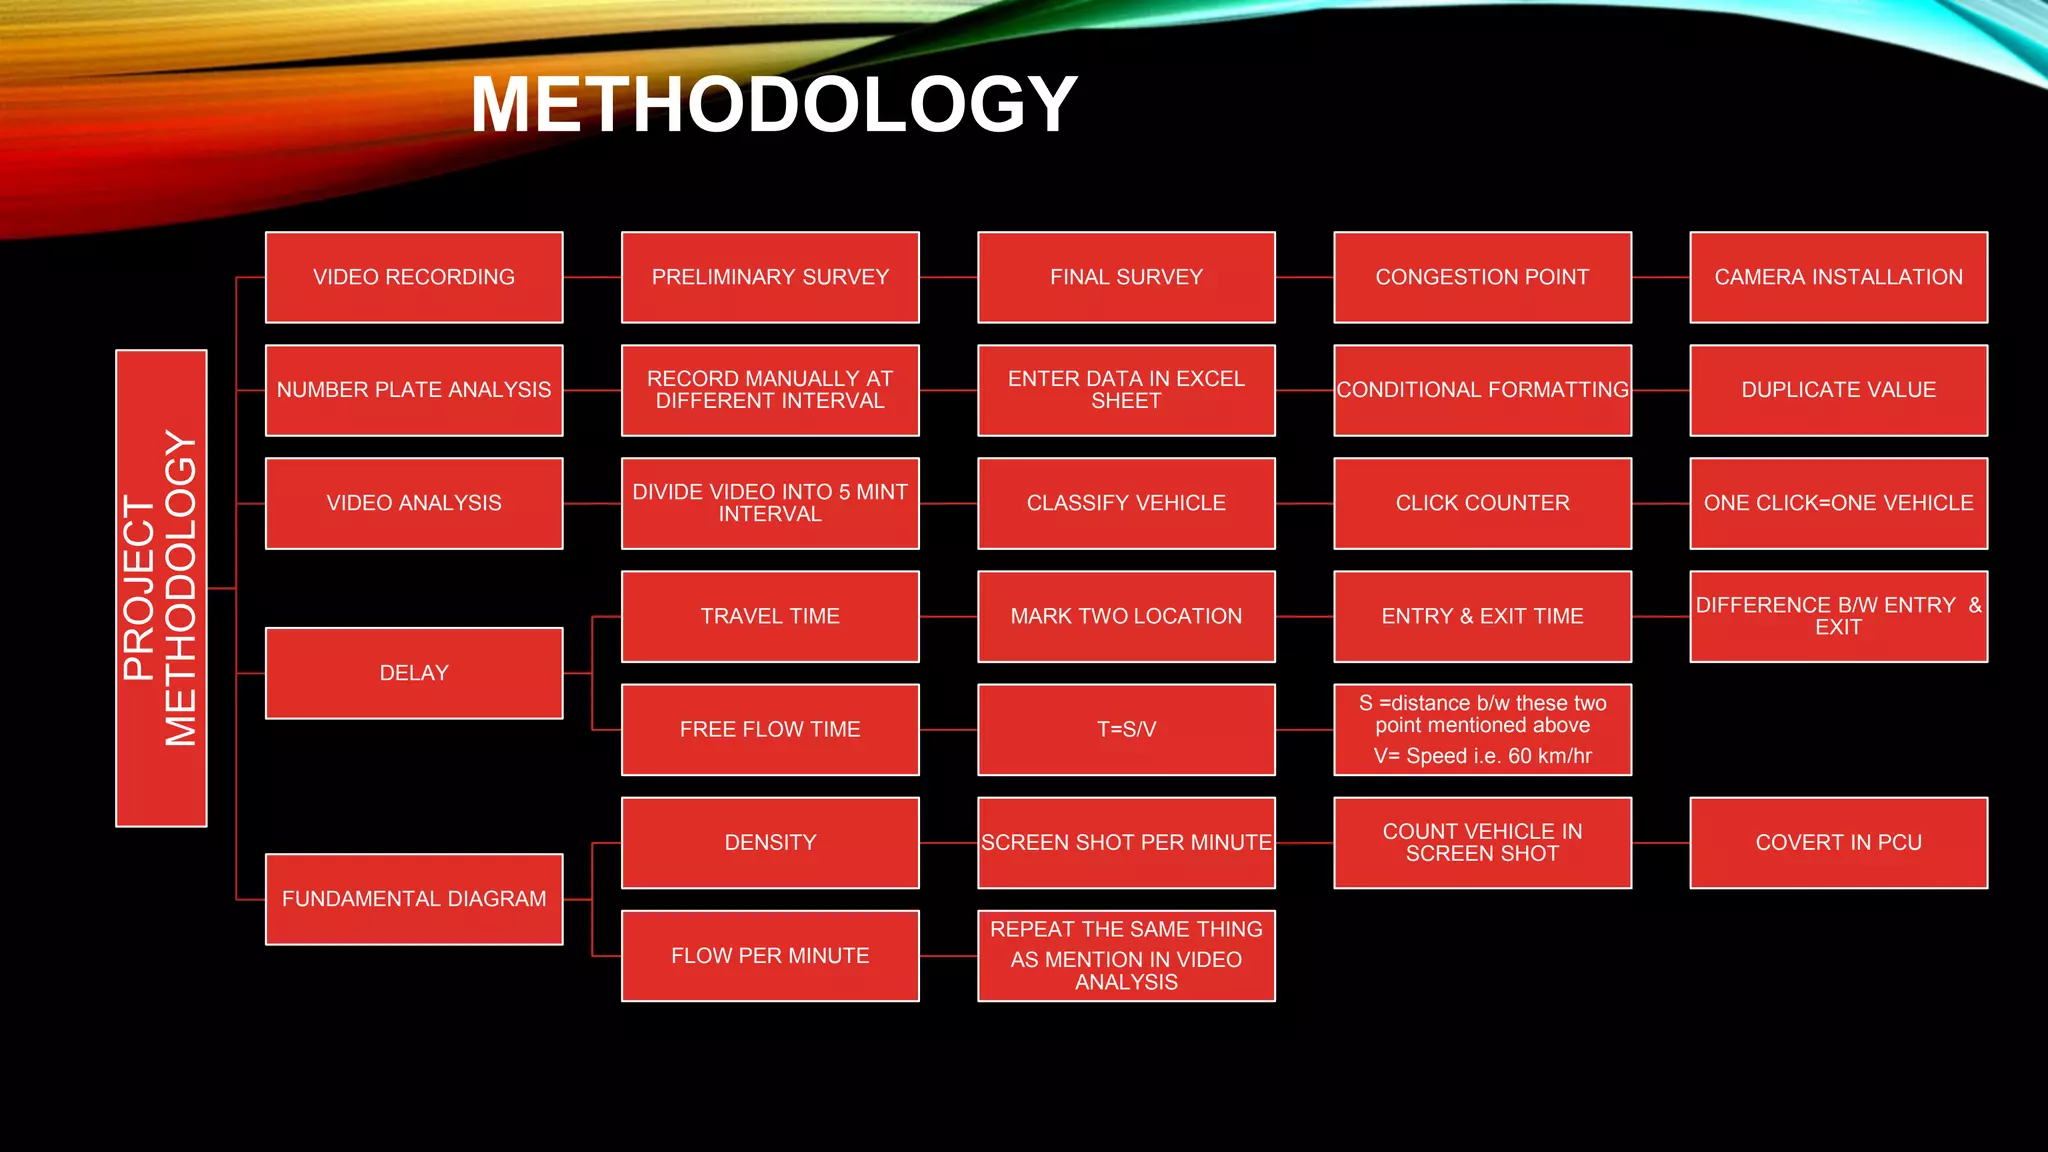
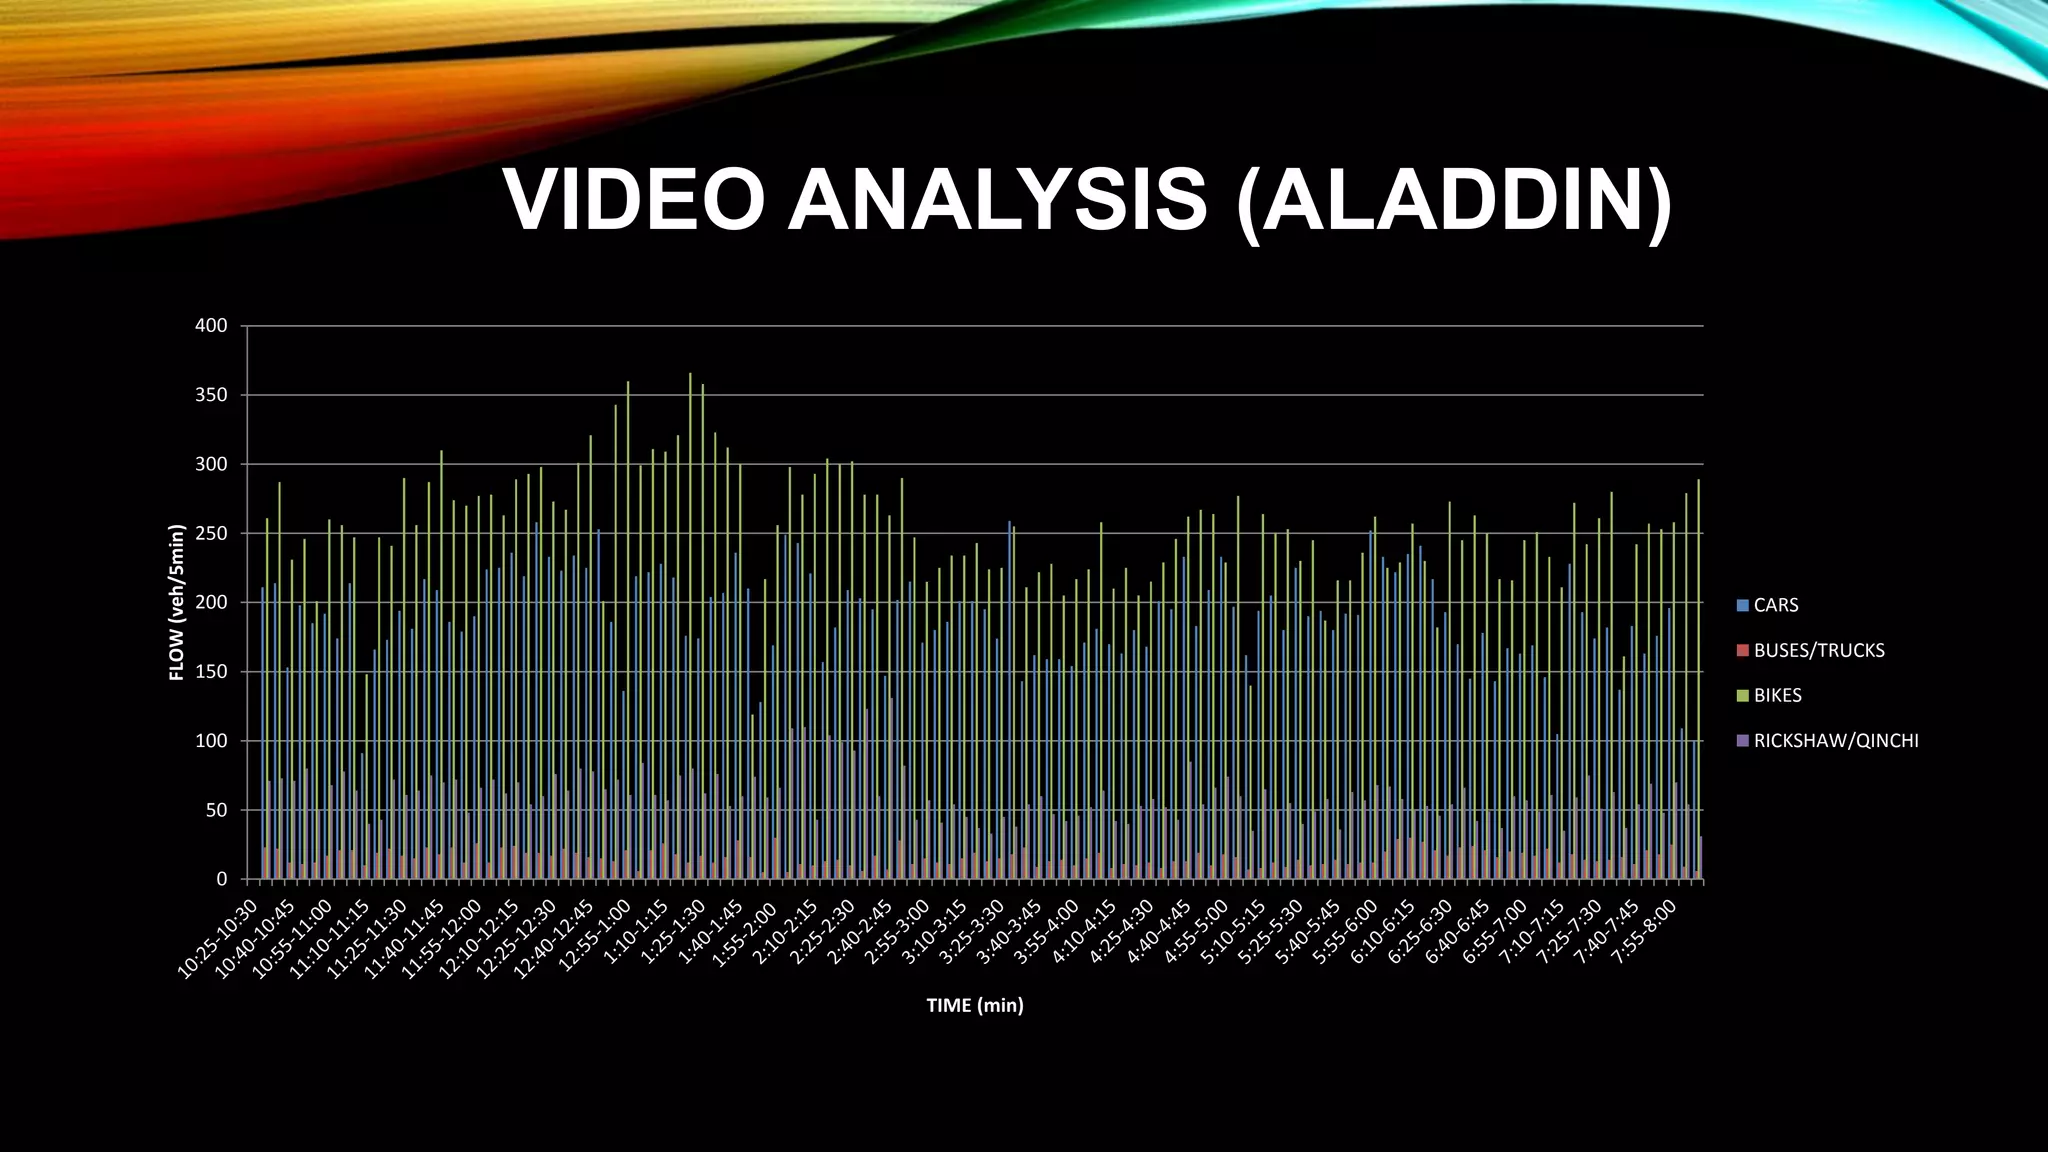
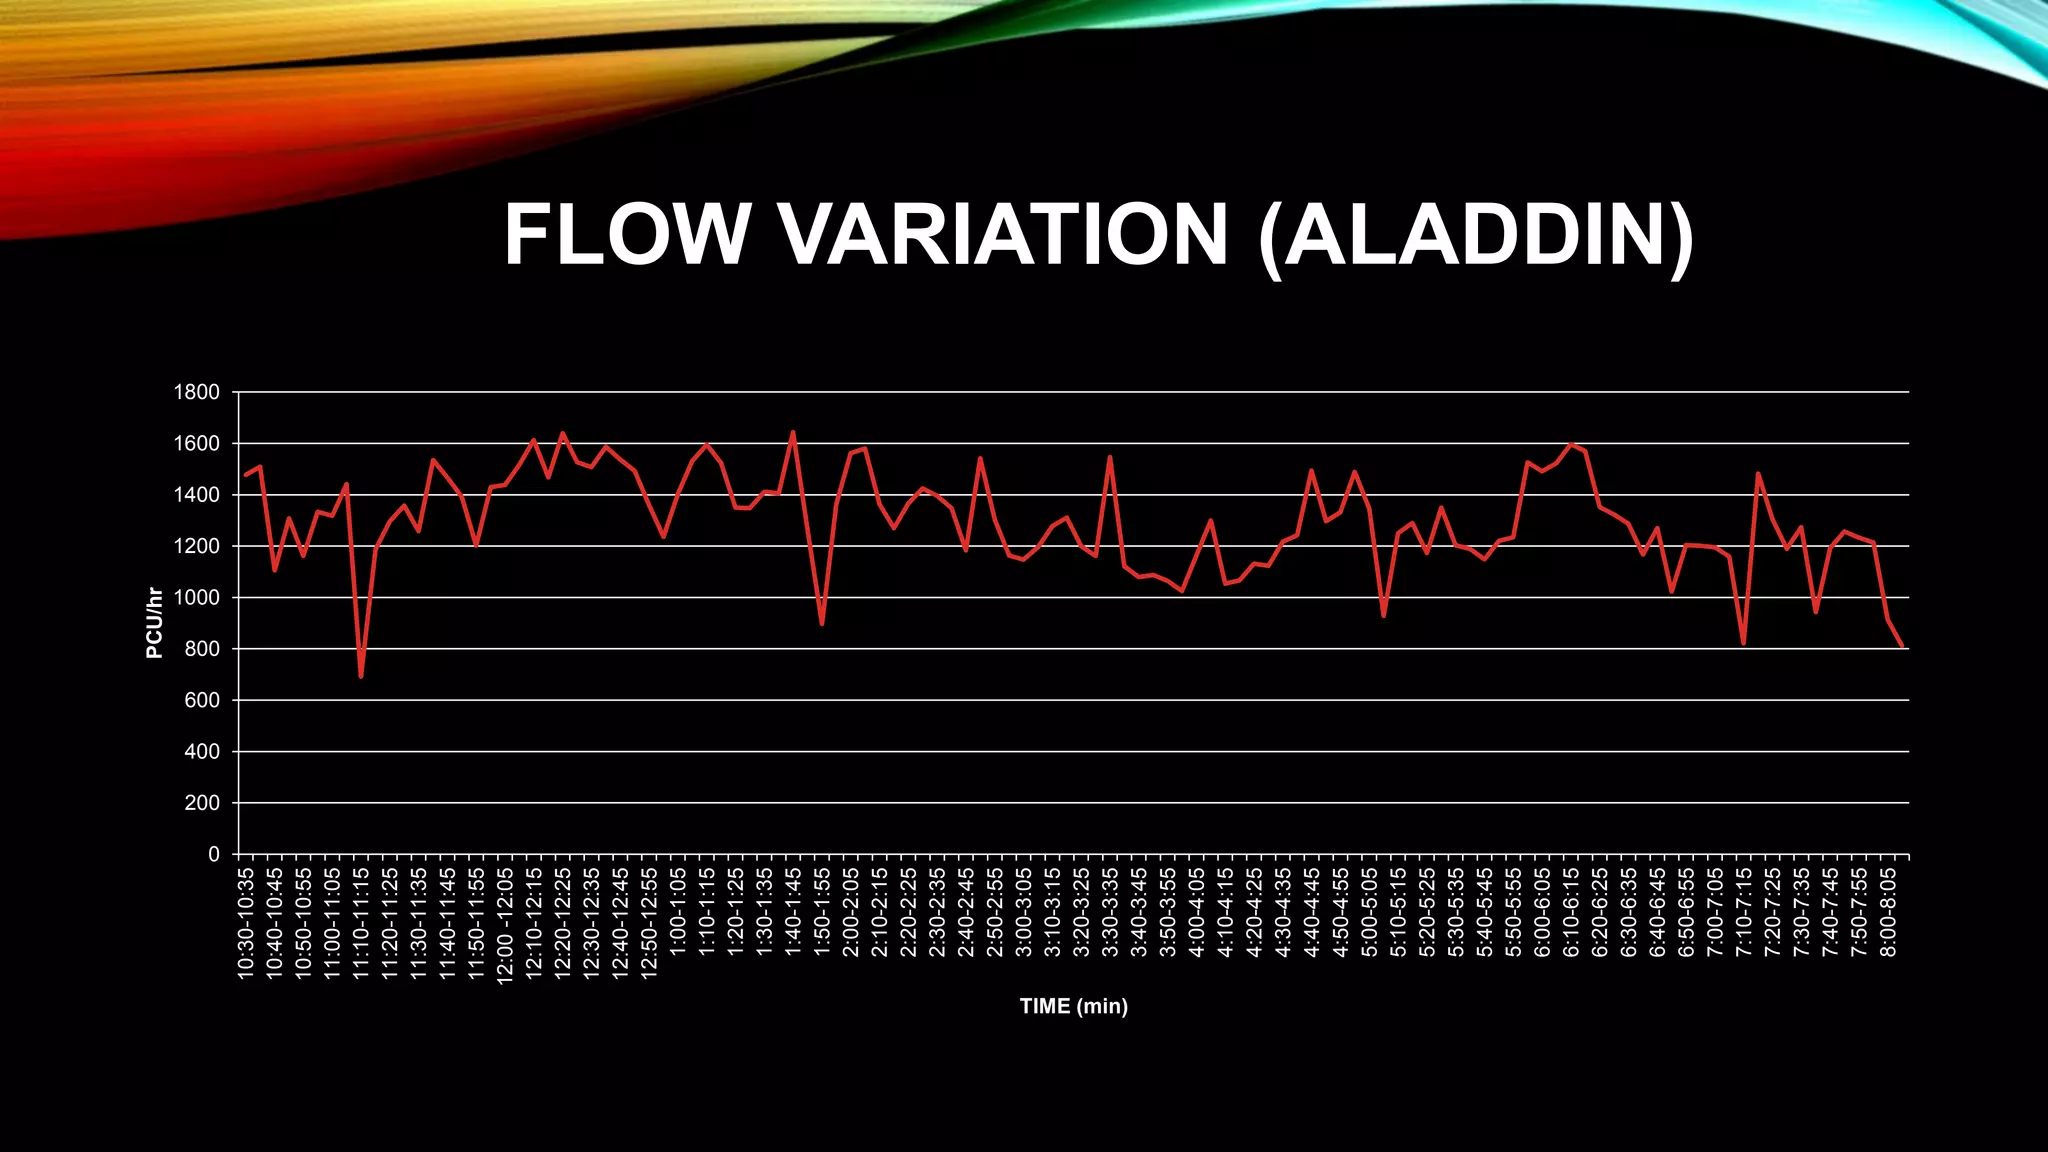
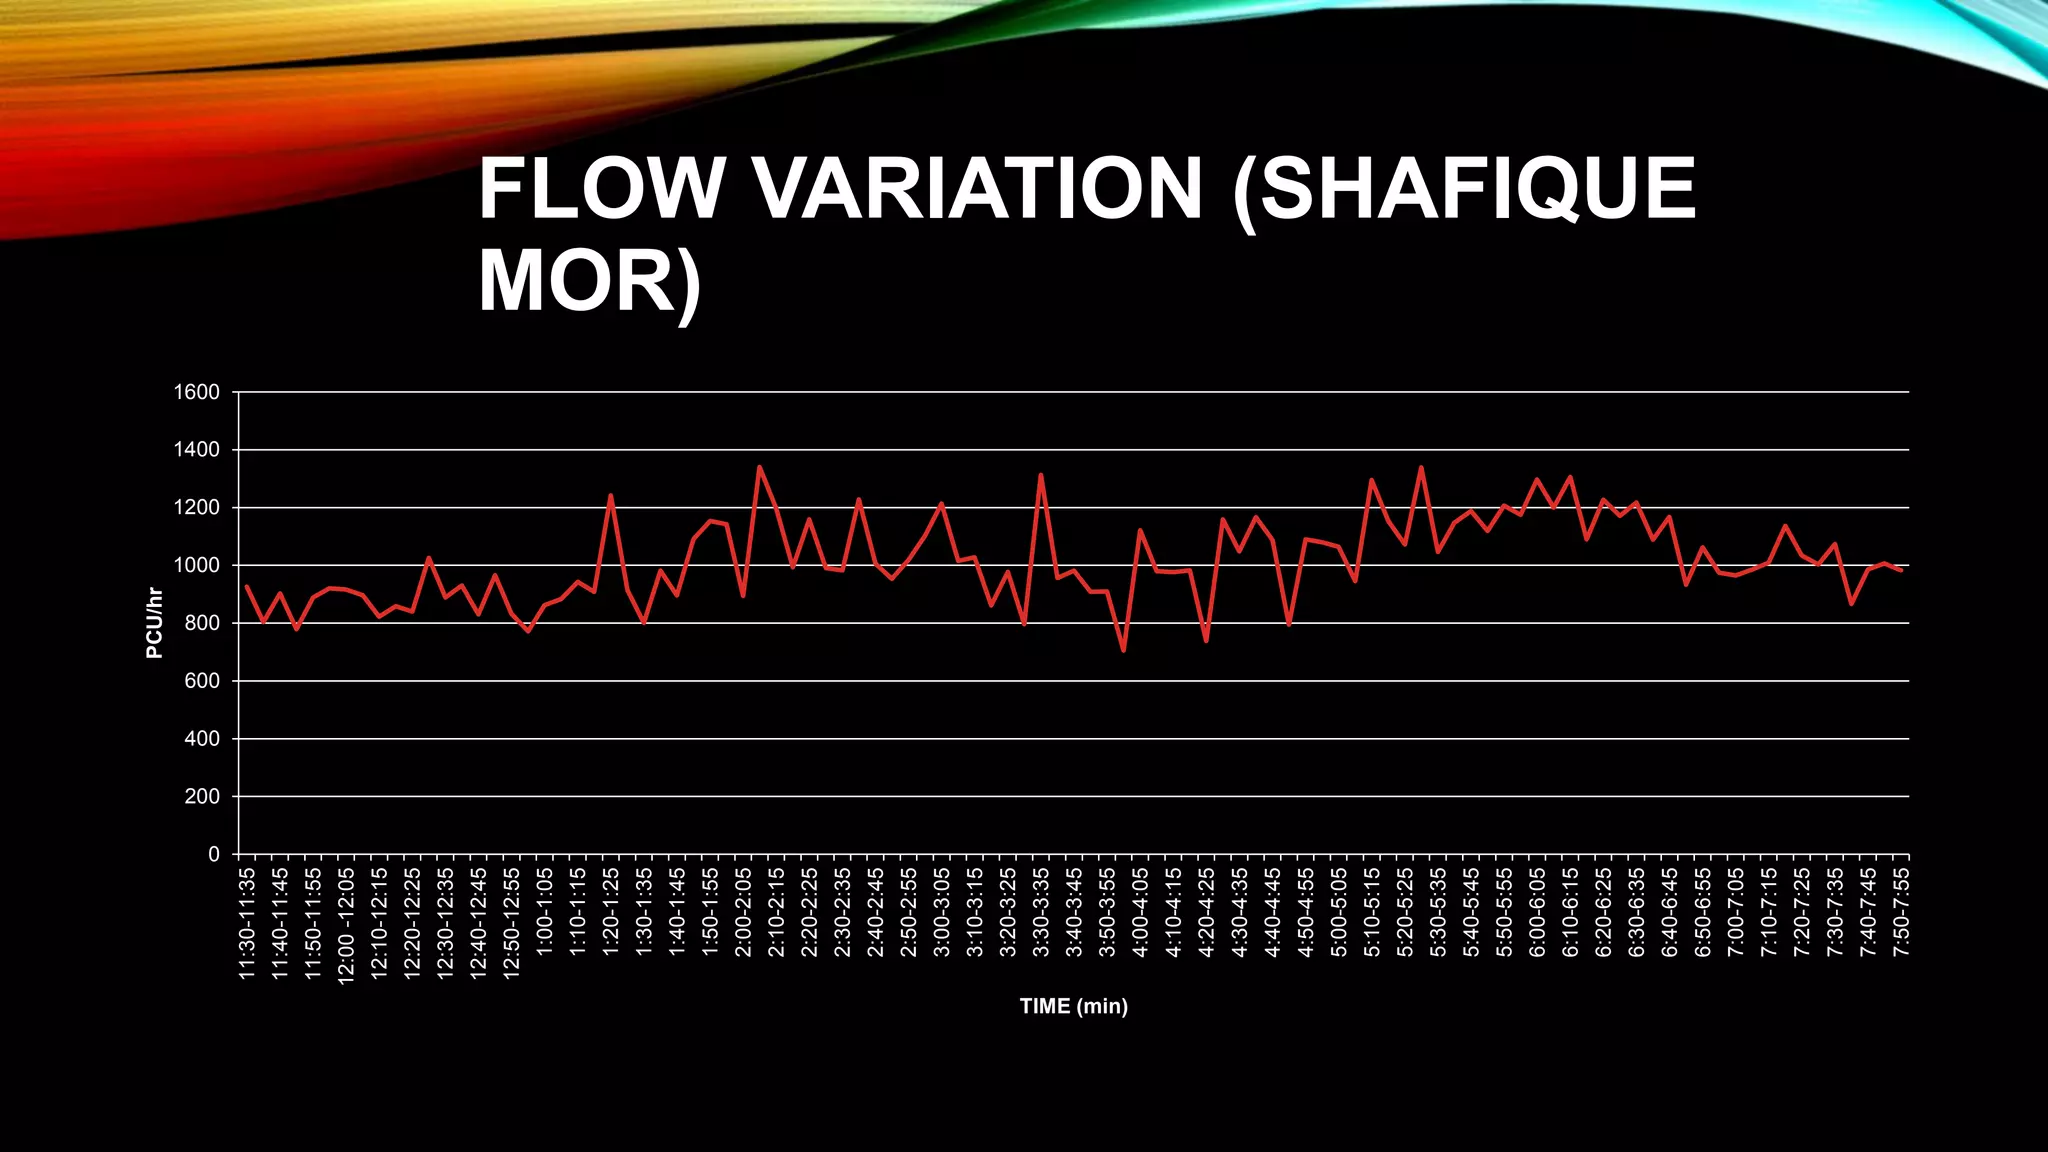
OPERATIONAL
CAPACITY OF ROAD
SEGMENT CONTAINING
U-TURN AT SIGNAL
FREE CORRIDOR
PROJECT SUPERVISOR AND
GROUP MEMBERS
PROJECT SUPERVISOR
Dr. Afzal Ahmed
GROUP MEMBERS
1. Daraullah Mahar UE-12002
2. Irfan Gul UE-12003
3. Junaid Jilbani UE-12007
4. Kapil Kilani UE-12015
5. Azeem Uddin Shams UE-12039
6. Syed Tayyab Shah UE-12045
PRESENTATION OUTLINE• Background
• Objectives
• Scope and Limitation
• Selection of Corridor
• Literature Review
• Methodology
• Number Plate Analysis
• Video Analysis
• Operational Capacity
• Flow Variation
• Delay Variation
• Fundamental Diagram
• Improvement in Existing U-turn
• Designing & Analysis of Signalized Intersection
• Comparison of Improvement with Existing U-turn
• Result & Recommendation
• References
BACKGROUND
• Signal Free corridors is introduced in KARACHI in order
to reduce the travel time.
• Signalized intersection were replaced by U-turns in order
to make the signal free corridor.
• Congestion is observed at U-turn.
• The impact of turning vehicle on the straight movement.
OBJECTIVES
• To find the capacity of U-turns at Signal Free Corridor.
• To suggest alternate to improve capacity.
• Comparison of proposed improvement with existing U-
turn.
SCOPE AND LIMITATION
• Scope of this study is limited to the selected corridor.
• Chosen U-turns will be a downtown U-turn.
• Survey will be conducted at three different U-turns for 8-
10 hours including the peak hours.
SELECTION OF CORRIDORS
LITERATURE REVIEW
• Turning of a vehicle in a U-shaped course so as to
face in the opposite directionU-turn
• Design Capacity
• Operational Capacity
Capacity
• U-turn at signalized intersections.
• U-turn at a median opening in advance of a signalized intersection.
• U-turn at a median opening after a signalized intersection
Location of U-turn
• Bimodal Distribution Method
• Selected Maxima Method
• Fundamental Diagram Method
Method of Estimation for
Operational Capacity
LITERATURE REVIEW
• Pre-timed Signal
• Semi Actuated Signal
• Fully Actuated Signal
Types of Signal
Operation
• Cycle
• Cycle length
• Interval (Change/Yellow Interval, All-Red/ Clearance interval, Green Interval &
Red Interval
• Phases
Component of
Signal Operation
• Uniform Delay
• Incremental Delay
• Initial Queue Delay
Delay on Signalized
Intersection
METHODOLOGYPROJECT
METHODOLOGY
VIDEO RECORDING PRELIMINARY SURVEY FINAL SURVEY CONGESTION POINT CAMERA INSTALLATION
NUMBER PLATE ANALYSIS
RECORD MANUALLY AT
DIFFERENT INTERVAL
ENTER DATA IN EXCEL
SHEET
CONDITIONAL FORMATTING DUPLICATE VALUE
VIDEO ANALYSIS
DIVIDE VIDEO INTO 5 MINT
INTERVAL
CLASSIFY VEHICLE CLICK COUNTER ONE CLICK=ONE VEHICLE
DELAY
TRAVEL TIME MARK TWO LOCATION ENTRY & EXIT TIME
DIFFERENCE B/W ENTRY &
EXIT
FREE FLOW TIME T=S/V
S =distance b/w these two
point mentioned above
V= Speed i.e. 60 km/hr
FUNDAMENTAL DIAGRAM
DENSITY SCREEN SHOT PER MINUTE
COUNT VEHICLE IN
SCREEN SHOT
COVERT IN PCU
FLOW PER MINUTE
REPEAT THE SAME THING
AS MENTION IN VIDEO
ANALYSIS
VIDEO RECORDING
Traffic Video Collection Survey
S.No
Survey
Location/
Road Stretch Duration
1 Aladdin 7.5 hours
2
Gulshan-e-
Iqbal 8 hours
3 Shafique Mor 7.5 hours
NUMBER PLATE ANALYSIS
S.NO MATCHED
NUMBER
PLATE
ENTRY
TIMING
ALADDIN
ENTRY
TIMING
GUSLHAN-E-
IQBAL
ENTRY
TIMING
SHAFIQUE
MOR
TRAVEL
TIME(min)
1 D-0750 12:49 --- 01:15 26
2 AMR-617 02:02 --- 02:30 28
3 KFC-944 04:40 --- 05:22 42
4 CRE6785 5:40 --- 6:20 40
5 AMR-256 --- 05:59 05:37 22
VIDEO ANALYSIS (ALADDIN)
0
50
100
150
200
250
300
350
400
FLOW(veh/5min)
TIME (min)
CARS
BUSES/TRUCKS
BIKES
RICKSHAW/QINCHI
VIDEO ANALYSIS (GULSHAN-E-IQBAL)
0
50
100
150
200
250
300
350
400
10:50-10:55
11:00-11:05
11:10-11:15
11:20-11:25
11:30-11:35
11:40-11:45
11:50-11:55
12:00-12:05
12:10-12:15
12:20-12:25
12:30-12:35
12:40-12:45
12:50-12:55
1:00-1:05
1:10-1:15
1:20-1:25
1:30-1:35
1:40-1:45
1:50-1:55
2:00-2:05
2:10-2:15
2:20-2:25
2:30-2:35
2:40-2:45
2:50-2:55
3:00-3:05
3:10-3:15
3:20-3:25
3:30-3:35
3:40-3:45
3:50-3:55
4:00-4:05
4:10-4:15
4:20-4:25
4:30-4:35
4:40-4:45
4:50-4:55
5:00-5:05
5:10-5:15
5:20-5:25
5:30-5:35
5:40-5:45
5:50-5:55
6:00-6:05
6:10-6:15
6:20-6:25
6:30-6:35
FLOW(veh/5min)
TIME (min)
CARS
BUSES/TRUCKS
BIKES
RICKSHAW/QINCHI
VIDEO ANALYSIS (SHAFIQUE
MOR)
0
50
100
150
200
250
300
350
400
450
11:25-11:30
11:35-11:40
11:45-11:50
11:55-12:00
12:05-12:10
12:15-12:20
12:25-12:30
12:35-12:40
12:45-12:50
12:55-1:00
1:05-1:10
1:15-1:20
1:25-1:30
1:35-1:40
1:45-1:50
1:55-2:00
2:05-2:10
2:15-2:20
2:25-2:30
2:35-2:40
2:45-2:50
2:55-3:00
3:05-3:10
3:15-3:20
3:25-3:30
3:35-3:40
3:45-3:50
3:55-4:00
4:05-4:10
4:15-4:20
4:25-4:30
4:35-4:40
4:45-4:50
4:55-5:00
5:05-5:10
5:15-5:20
5:25-5:30
5:35-5:40
5:45-5:50
5:55-6:00
6:05-6:10
6:15-6:20
6:25-6:30
6:35-6:40
6:45-6:50
6:55-7:00
7:05-7:10
7:15-7:20
7:25-7:30
7:35-7:40
7:45-7:50
FLOW(ve/5min)
TIME (min)
CARS
BUSES/TRUCKS
BIKES
RICKSHAW/QINCHI
OPERATIONAL CAPACITY
LOCATION
MAXIMUM FLOW
RATE
CAPACITY
(vehicle/hr/lane)
CAPACITY
(pcphpl)
Aladdin 661(veh/5min/3lane) 2644 1709
Gulshan-e-
Iqbal 693(veh/5min/4lane) 2079 1308
Shafique Mor 619(veh/5min/3lane) 2476 1440
FLOW VARIATION (GULSHAN-E-
IQBAL)
0
200
400
600
800
1000
1200
1400
1600
1800
PCU/hr
TIME (min)
FLOW VARIATION (ALADDIN)
0
200
400
600
800
1000
1200
1400
1600
1800
10:30-10:35
10:40-10:45
10:50-10:55
11:00-11:05
11:10-11:15
11:20-11:25
11:30-11:35
11:40-11:45
11:50-11:55
12:00-12:05
12:10-12:15
12:20-12:25
12:30-12:35
12:40-12:45
12:50-12:55
1:00-1:05
1:10-1:15
1:20-1:25
1:30-1:35
1:40-1:45
1:50-1:55
2:00-2:05
2:10-2:15
2:20-2:25
2:30-2:35
2:40-2:45
2:50-2:55
3:00-3:05
3:10-3:15
3:20-3:25
3:30-3:35
3:40-3:45
3:50-3:55
4:00-4:05
4:10-4:15
4:20-4:25
4:30-4:35
4:40-4:45
4:50-4:55
5:00-5:05
5:10-5:15
5:20-5:25
5:30-5:35
5:40-5:45
5:50-5:55
6:00-6:05
6:10-6:15
6:20-6:25
6:30-6:35
6:40-6:45
6:50-6:55
7:00-7:05
7:10-7:15
7:20-7:25
7:30-7:35
7:40-7:45
7:50-7:55
8:00-8:05
PCU/hr
TIME (min)
FLOW VARIATION (SHAFIQUE
MOR)
0
200
400
600
800
1000
1200
1400
1600
11:30-11:35
11:40-11:45
11:50-11:55
12:00-12:05
12:10-12:15
12:20-12:25
12:30-12:35
12:40-12:45
12:50-12:55
1:00-1:05
1:10-1:15
1:20-1:25
1:30-1:35
1:40-1:45
1:50-1:55
2:00-2:05
2:10-2:15
2:20-2:25
2:30-2:35
2:40-2:45
2:50-2:55
3:00-3:05
3:10-3:15
3:20-3:25
3:30-3:35
3:40-3:45
3:50-3:55
4:00-4:05
4:10-4:15
4:20-4:25
4:30-4:35
4:40-4:45
4:50-4:55
5:00-5:05
5:10-5:15
5:20-5:25
5:30-5:35
5:40-5:45
5:50-5:55
6:00-6:05
6:10-6:15
6:20-6:25
6:30-6:35
6:40-6:45
6:50-6:55
7:00-7:05
7:10-7:15
7:20-7:25
7:30-7:35
7:40-7:45
7:50-7:55
PCU/hr
TIME (min)
DELAY VARIATION
0:00
0:14
0:28
0:43
0:57
1:12
1:26
1:20:00 2:32:00 3:44:00 4:56:00 6:08:00
DELAY(minute:second)
TIME (hour:minute:second)
FUNDAMENTAL DIAGRAM (GULSHAN-E-
IQBAL)
0
200
400
600
800
1000
1200
1400
0 100 200 300 400 500 600 700
FLOW(vehicle/hour)
DENSITY (vehicle/kilometer)
FUNDAMENTAL DIAGRAM (ALADDIN)
0
200
400
600
800
1000
1200
1400
1600
0 50 100 150 200 250 300 350 400 450 500
FLOW(vehicle/hour)
DENSITY(vehicle/kilometer)
FUNDAMENTAL DIAGRAM (SHAFIQUE
MOR)
0
200
400
600
800
1000
1200
1400
0 50 100 150 200 250 300 350 400
FLOW(vehicle/hour)
DENSITY(vehicle/kilometer)
IMPROVEMENT IN EXISTING U-TURN
• Locating the U-turn at far distance.
• Alternation to Existing Infrastructure.
• Controlling by means of Signalized Intersection.
DESIGNIG & ANALYSIS OF SIGNALIZED
INTERSECTION
Cross Section Element (Practical Center to Maskan)
CROSS SECTION ELEMENT LENGTH
Median width ---
No of Lane in each direction 02
Lane Width 10 ft.
Right of Way 100 ft.
Flyover width 44 ft.
Cross Section Element (Fazil Mill to Nipa)
CROSS SECTION ELEMENT LENGTH
Median width 12 ft.
No of Lane in each direction 04
Lane Width 12 ft.
Right of Way 165 ft.
DESIGNIG & ANALYSIS OF
SIGNALIZED INTERSECTION
• PHASE DIAGRAM
• CRITICAL LANE VOLUME
Phase I Phase II
1022.2 pcphpl 927 pcphpl
DESIGNIG & ANALYSIS OF
SIGNALIZED INTERSECTION
Cycle length 106 second
Yellow Interval 2.5 second
All-Red Interval 3 second
Lost Time Per Phase 5.5 second
Effective Green Time 95 second
Phase I Phase II
Allocating of Green Time 60 second 30 second
Uniform Delay 14.61 vehicle/second 29.31vehicle/second
Incremental Delay 0.93 vehicle/second 0.92 vehicle/second
Initial Queue Delay 0 0
Total Delay 15.42 vehicle/second 30.23 vehicle/second
COMPARISON OF IMPROVEMENT WITH
EXISTING U-TURN
• Compare by means of Delay.
• Average delay on U-turn during the peak hour was found to be 55
vehicle/seconds.
• Total delay on Phase I was found to be 15.54 vehicle/seconds.
• On comparing these delay; it was found out that U-turn has more
delay as compared to signalized intersection.
RESULTS
• Operational Capacity was largely depend upon the dynamics of location.
• Conflicting movement of Aladdin and Shafique Mor segment is more as
compared to Gulshan-e-Iqbal segment.
• Delay on U-turn is more to be compared with signalized intersection.
• During the peak timing, the travel time between Aladdin and Shafique Mor is
more as compared to normal travel time.
• Ultimately it may cause larger Environmental and Economic impact.
• The policy on Signal Free Corridor should be revised. U-turn is not the proper
alternative to remove the Signalized intersection to convert a corridor in so called
“Signal Free Corridor”.
• Traffic signals are useful in managing traffic demand for downstream links in a traffic
network.
• If providing U-turn is necessary to avoid intersection, they should be provided at
adequate distance to provide gradual change of direction for turning traffic.
• Illegal parking also affects capacity of road segments; therefore, it should be
ensured that vehicles are not parked along roads.
• It is recommended to improve capacity of segment containing U-turn near Gulshan
along Rashid Minhas Road by providing a signalized intersection which properly
controls existing movements at the intersection.
RECOMMENDATION
REFERENCES
• Adams, J.C. and Hummer, J.E. (1993). Effects of U-turns on Left-turn Saturation Flow Rates.
Transportation Research Record 1398. TRB, National Research Council, Washington, D.C.
• Adnan, M. (2014). Passenger car equivalent factors in heterogeneous traffic environment-
are we using the right numbers? Procardia engineering, 77, 106-113.
• Al-Masaeid, H. R. (June 1999). Capacity of U-turn at Median Opening. ITE Journal, June 28-
34.
• American Association of State Highway and Transportation Officials, (2001). A Policy on
Geometric Design of Highways and Streets, Washington, DC.
• Florida Department of Transportation, (1997). Median Handbook, Tallahassee, FL, 1997.
• Roger P. Roess and William R. McShane (2009). Basic Principles of Intersection
Signalization, Traffic Engineering, (pp.471-496) Pearson.
• Transportation Research Board, National Research Council, (2010). Highway Capacity
Manual, Washington, D.C.
• Tsao, S. and Chu, S (1996) A Study of Adjustment Factor for U-turns in Left Turn Lanes at
Signalized Intersection. Journal of Advanced Transportation, Vol.29, No.9, pp.183-192.

Final Project Presentation