The internship summary involves the following:
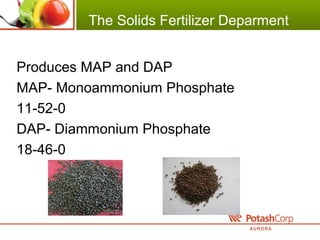
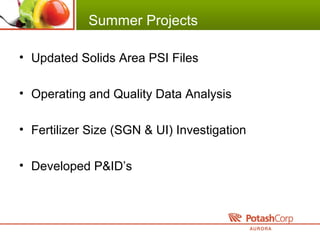
1. The intern worked for the Solids Fertilizer Department at a fertilizer plant, updating process files and analyzing operating data.
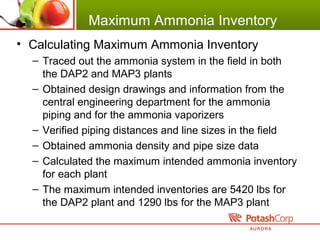
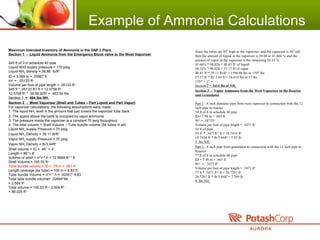
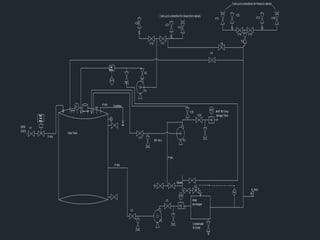
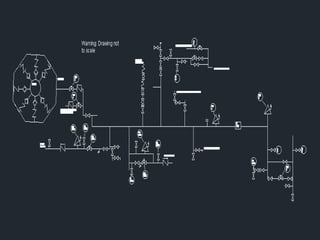
2. Projects included calculating ammonia inventories, developing piping and instrument diagrams, and investigating fertilizer size properties.
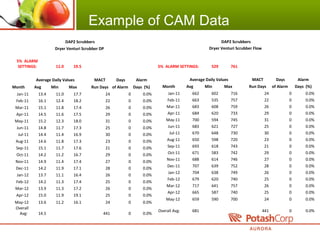
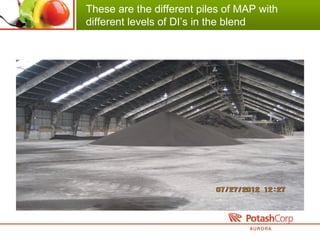
3. The intern analyzed historical operating and quality data, documented environmental limits, and identified differences in fertilizer testing methods.
Monitoring and control of pump and treat systems in gasoline stationsJennifer Maclachlan
Presented at the American Chemical Society National Meeting in San Francisco August 2014 on the Environmental Chemistry Track.
One of the most serious contamination problems in LA in the early 2000's was leaking from underground gasoline storage tanks. At high levels of VOC's (thousands of ppm), the pump and treat effluent can simply be flared. At about 1,000 ppm, it requires too much auxiliary fuel to burn the effluent. A new collection system such as a carbon bed is required. Continuous monitoring is required to determine when breakthrough of the VOC's occurs. Then, the carbon bed should be changed.
The most popular technique for carbon bed monitoring is photoionization and the 112 instrument includes a programmable setpoint that shuts down the pump allowing the carbon bed to be changed. The application of continuous monitoring instrumentation to soil vapor extraction (SVE) is described as one of the few innovative technologies that has gained wide use for cleaning up contaminated sights.
Measuring Nitrous Oxide & Methane from Feedyard Surfaces - the NFT-NSS Chambe...LPE Learning Center
Full proceedings at: http://www.extension.org/72909 Accurate estimation of greenhouse gas emissions, including nitrous oxide and methane, from open beef cattle feedlots is an increasing concern given the current and potential future reporting requirements for GHG emissions. Research measuring emission fluxes of GHGs from open beef cattle feedlots, however, has been very limited. Soil and environmental scientists have long used various chamber based techniques, particularly non-flow-through - non-steady-state (NFT-NSS) chambers for measuring soil fluxes. Adaptation of this technique to feedyards presents a series of challenges, including spatial variability, presence of animals, chamber base installation issues, gas sample collection and storage, concentration analysis range, and flux calculations.
A study of the importance of gas composition and calibration and their effects on flow meter accuracy.
Errors associated with the calibration of flow meters for natural gas service can be costly but can also be mitigated using an advanced flow meter design that allows field-adjustment of the natural gas composition without loss of accuracy.
Automatic carbon dioxide methane gas sensor based on the solubility of gases ...Sherry Huang
Biogas methane content is a relevant variable in anaerobic digestion processing where knowledge of process kinetics or an early indicator of digester failure is needed.
Landfill Compliance Monitoring: Achieving Long Term EfficiencyHydroTerra Pty Ltd
Richard Campbell presentation from the 2017 Institute of Public Works Engineering Australasia (IPWEA) leadership workshop. Richard covers the changing face of landfill environmental compliance reporitng through automated monitoring technology.
Diamond Systems Landtec GEM5000 Complete PackageMadison Miller
The GEMTM5000 is designed specifically for use on landfills to monitor Landfill Gas (LFG) Collection & Control Systems. The GEMTM5000 samples and analyzes the methane, carbon dioxide and oxygen content of landfill gas with options for additional analysis.
SAS Global Coal-Fired Power Diagnostic Testing and Combustion TuningJustin Bennett
Due to recent strict EPA regulations, more stringent burdens will continue to fall upon our industry. Coupled with increasing competition, fossil fueled power plants are struggling to comply with government regulations and
competing in a turbulent market. SAS Global Power is the only firm that has the experience to accurately assess
your current operating conditions and provide the technology for you to effectively and efficiently produce power without exceeding emissions standards.
The SAS Global Performance Testing and Combustion Tuning Group specializes in the reliable examination of your fuel flows to the boiler, backpass emission mapping, visual flame conditions inside boiler, fly ash and coal analysis. Utilizing the collected data, a comprehensive report detailing current operating assessment will be provided. The report will include recommendations designed to improve combustion stoichiometry, while enhancing auxiliary efficiencies and reducing emissions.
The scope of the test report will depend upon your predetermined goals and system imbalances, which will be
determined from your own custom test program.
Our service is unique to the specific requirements of each plant, price quotes are prepared on a location-by-location
basis. Please contact us for a custom tailored proposal that meets all of your specific needs.
Fired heaters and its auxiliaries are an essential component in the Chemical Process Industries (CPI). Fired heaters are primarily used to heat hydrocarbons. They are one of the major consumers of energy and hence, it is indispensable for such systems to have efficient operation.
Furnace Improvements Services has a specialist CFD team for modelling fired heater systems. We have developed best practices for each of the above cases and have successfully implemented various recommendations from CFD simulations.
David Gergens Dental Sleep PresentationDavid Gergen
This presentation outlines oral appliances for the treatment of sleep disorders. David Gergen is a lecturer and promotor of dental sleep disorders therapy
XRF Based &Multi-Metals & Continuous Water Analyzer Xact920European Tech Serv
Process monitoring – feedback for water treatment may improve the efficiency of the treatment process – use fewer chemicals to achieve require effluent emission limits
Measurement of Se, As for compliance with Steam Electric Generating Effluent Guidelines
Monitoring of treatment of wastewater by biological based treatment systems
Measurement of Corrosion Products (e.g. Fe, Ni, Cr and Mn) to improve operating efficiency
Measurement of Elements in Nuclear Power Plant Applications (e.g. Pb, Cu, Fe)
Reduce laboratory analysis costs
3 Tips on How to Simplify VOC Monitoring and Set Up a Successful Network.
What will you learn from the Webinar?
1. Mistakes when setting up a calibration system.
2. Using communications with the GC monitors.
3. GC pre-concentrator management maintenance and functions.
Whether your monitoring requirements to meet VOC emissions standards from the EPA are simply for BTEX, a C6 - C12 range, or even a full range, discover how American Ecotech can provide a complete solution that will give you consistent, precise, and reliable results to meet any specific VOC requirements.
Plenary talk at ISPAC conference on the use of polycyclic aromatic hydrocarbons (PAHs) in environmental forensics. Covers basics of what enviromental forensics investigations (EFIs) are and how PAHs can be used to help determine sources of releases (creosote, railway ties), oil sands development and oil spill releases (Macondo oil spill, gulf oil spill).
PA DEP Proposal to Study Radiation Levels Associated with Shale DrillingMarcellus Drilling News
A proposal submitted to and accepted by the PA Dept. of Environmental Protection from Perma-Fix Environmental Services to conduct a 12-14 month in-depth study of naturally occurring radioactivity levels in drilling wastewater, drill cuttings, and the equipment used to transport, store and dispose of drilling wastes.
Recently, a new technique was introduced the allows the automated supercritical extraction and SFC analysis of samples with minimal sample preparation and handling requirements to save analyst time and sample preparation expenses. This presentation demonstrates how automated SFE-SFC can be a quick way to screen up to 48 soil samples for explosives in a variety of soil types with minimal sample prep. For more information, go to http://www.ssi.shimadzu.com/industry/industrypage.cfm?market_id=4. Thanks for viewing.
PIOGA/MSC Observations/Questions on PA DEP Radiation in Shale Drilling StudyMarcellus Drilling News
A document produced in August 2013 jointly by the Marcellus Shale Coalition (MSC) and the Pennsylvania Independent Oil and Gas Association (PIOGA) questioning some of the criteria and scope of a proposed study now under way and being conducted by the PA Dept. of Environmental Protection (DEP). The DEP is studying the extent and scope of radiation in shale drilling waste, and whether or not they need to establish regulatory standards to control it.
Similar to Final Presentation first internship (20)
2. Who I Worked for:
• Al Hart - Production Engineer for Solids
• David Harmon - Superintendent
SPA/Fertilizer
3. The Solids Fertilizer Deparment
Produces MAP and DAP
MAP- Monoammonium Phosphate
11-52-0
DAP- Diammonium Phosphate
18-46-0
4. Summer Projects
• Updated Solids Area PSI Files
• Operating and Quality Data Analysis
• Fertilizer Size (SGN & UI) Investigation
• Developed P&ID’s
5. Solids Area PSI Files
• Updated Solids Area PSI Files
– Calculated the maximum intended ammonia inventory
for both the MAP3 and DAP2 plants
– Organized critical equipment data for both the MAP3
and DAP2 plants
6. Maximum Ammonia Inventory
• Calculating Maximum Ammonia Inventory
– Traced out the ammonia system in the field in both
the DAP2 and MAP3 plants
– Obtained design drawings and information from the
central engineering department for the ammonia
piping and for the ammonia vaporizers
– Verified piping distances and line sizes in the field
– Obtained ammonia density and pipe size data
– Calculated the maximum intended ammonia inventory
for each plant
– The maximum intended inventories are 5420 lbs for
the DAP2 plant and 1290 lbs for the MAP3 plant
7. Example of Ammonia Calculations
Maximum Intended Inventory of Ammonia in the DAP 2 Plant.
Section 1 - Liquid Ammonia from the Emergency Block valve to the West Vaporizer
245 ft of 3 in schedule 40 pipe
Liquid NH3 supply pressure = 170 psig
Liquid NH3
density = 36.86 lb/ft3
ID = 3.068 in = .25567 ft
πr2
= .05133 ft2
Volume per foot of pipe length = .05133 ft3
245 ft * .05133 ft3
/ ft = 12.5758 ft3
12.5758 ft3
* 36.86 lb/ft3
= 463.54 lbs
Section 1 = 464 lbs NH3
Section 2 - West Vaporizer (Shell and Tubes – Part Liquid and Part Vapor)
For vaporizer calculations, the following assumptions were made:
1. The liquid NH3
level is the amount that just covers the vaporizer tube bank.
2. The space above the bank is occupied by vapor ammonia
3. The pressure inside the vaporizer is a constant 70 psig throughout.
4. The total volume = Shell Volume – Tube bundle volume (94 tubes in all)
Liquid NH3
supply Pressure = 70 psig
Liquid NH3
Density = 39.11 lb/ft3
Vapor NH3
supply Pressure = 70 psig
Vapor NH3
Density = lb/3.44ft3
Shell volume = ID = 48’’ = 4’
Length = 96’’= 8’
Volume of shell = π*r2
* h = 12.5664 ft2
* 8
Shell Volume = 100.53 ft3
Tube bundle volume = ID = .75 in = .061 ft
Length (average per tube) = 106 in = 8.83 ft
Tube bundle Volume = π*r2
* h = .00301* 8.83
Total tube bundle volume= .02664*94
= 2.504 ft3
Total volume = 100.53 ft3-
- 2.504 ft3
= 98.026 ft3
Since the tubes are 20’’ high in the vaporizer, and the vaporizer is 48” tall,
then the amount of liquid in the vaporizer is 20/48 or 41.666 % and the
amount of vapor in the vaporizer is the remaining 58.33 %.
41.66% * 98.026 = 40.83 ft3
of liquid
58.33% * 98.026 = 57.17 ft3
of vapor
40.83 ft3
* 39.11 lb/ft3
= 1596.86 lbs or 1597 lbs
57.17 ft3
* lb/ 3.44 ft3
= 16.619 lbs or 17 lbs
1597 + 17 =
Section 2 = 1614 lbs of NH3
Section 3 - Vapor Ammonia from the West Vaporizer to the Reactor
and Granulator
Part 1 - 8 inch diameter pipe from west vaporizer to connection with the 12
inch pipe to reactor
54 ft of 8 in schedule 40 pipe
ID= 7.98 in = .665 ft
πr2
= .3471ft2
Volume per foot of pipe length = .3471 ft3
54 ft of pipe
54 ft * .3471ft3
/ ft = 18.7434 ft3
18.7434 ft3
* lb/3.44ft3
= 5.45 lb
5 lbs NH3
Part 2 - 8 inch pipe from granulator to connection with the 12 inch pipe to
Reactor
77 ft of 8 in schedule 40 pipe
ID = 7.98 in = .665 ft
πr2
= .3471 ft2
Volume per foot of pipe length = .3471 ft3
77 ft * .3471 ft3
/ ft = 26.7267 ft3
26.7267 ft3
* lb/3.44ft3
= 7.769 lb
8 lbs NH3
9. PSI Files - Equipment Data Sheets
• For every piece of critical equipment in the DAP2 and
MAP3 plant there are data sheets which give design
and operating information
• My job was to review the current information, collect
additional data if needed, and improve the organization
of this data in the files
• Searched through equipment files in both the
operations and maintenance offices
• Took information found from both locations and joined
information to create more efficient PSI files
• This will allow people to more easily locate equipment
data when needed
13. Data Analysis
• Operating and Quality Data Analysis
– Documented the color difference in the final MAP
product due to acid blend changes
14. These are the different piles of MAP with
different levels of DI’s in the blend
15. Data Analysis
• Operating and Quality Data Analysis
– Tracked the TPA and APA values for MAP produced in
the #2 plant.
– Developed baseline operating information for ammonia
and acid usage when producing MAP in the #2 plant
– Tracked quality information for barge and rail
shipments in the Solids area
– Documented daily MACT environmental data for Solids
16. Fertilizer Size Quality Data
• Fertilizer Size (SGN & UI) Investigation
– SGN = Size Guide Number
– UI = Uniformity Index
– Analyzed historical data to determine if differences exist in
SGN testing results between the DAP2 plant and the lab
– We did find differences ranging from 9 to 15 points which
sometimes can lead to quality warnings for product
– This lead us to perform “round-robin” size testing on
fertilizer samples in each of the fertilizer plants, the rail
yard scale house, and the tech services lab
17. Round Robin Testing
• Testing samples
– All samples were taken from #2 plant
– Total of ten samples taken: four MAP and six DAP
– Testing of the each sample was carried out at each
location in the fertilizer area and at the lab.
– Lab tests were done using the CPA and test screens
– Analysis of results
18.
19.
20. Conclusions of Tests, and Suggestions for
More Consistent Results
• Conclusions
– SGN test data from the DAP2 plant is higher than the either the
Lab CPA or the Lab screens. This difference is more
pronounced at higher SGN values
– The MAP3 test screens and the Lab screens were very close
– There is a difference between the Lab CPA values and the Lab
screen values
• Suggestions
– Order new test screens for the DAP2 plant and check the results
– Possibly check the correlation curve in the Lab CPA
– The Lab and Fertilizer areas should continue work to resolve any
differences in testing
21. Solids Area P&ID’s
• P&ID’s
– Created a P&ID for the Urea unloading and storage
system
– 150# steam supply to the DAP2 plant
– DPW water and #2 Pond Water to the DAP2 plant
22.
23.
24. What I learned
• Safety hazards and PPE usage
• PSI requirements for a chemical plant
• Gained knowledge of how an industrial
manufacturing site functions
• Learned the process of making solid fertilizer
• Equipment design and operation
• P&ID’s and AutoCAD
25. Special Thanks
• Al Hart
• David Harmon
• Alex Hunt
• Bill McClung
• Eric Askew
• Chris Toppin
• Julie Potter
• Mark Johnson
• Steve Beckel
Hello my name is Isaac Hardison. I interned this summer in the Solids Fertilizer department. I will be starting my sophomore year this fall at NC State. I am majoring in Civil Engineering.
This summer my mentor was Mr. Al Hart, he is a Chemical engineer from North Carolina State University, and he is the production engineer of solids fertilizer. The superintendent of the area I worked in is Mr. David Harmon.
There are two solid fertilizer plants, MAP3 and DAP2. Both plants produce solid fertilizer grades by reacting ammonia with phosphoric acid. The different grades are produced by varying the reaction amounts of acid and ammonia. MAP or monoammonium phosphate is an 11-52-0 grade, which means it contains 11 percent nitrogen and 52 percent phosphate. DAP or diammonium phosphate is an 18-46-0 grade which contains 18 percent nitrogen and 46 percent nitrogen. Pictures are shown of each granular fertilizer. DAP is usually darker in color, but both products are produced with the same targets for size and uniformity.
These are the main Projects I focused on this summer, I will discuss them in further detail later in this presentation.
PSI stands for Process Safety Information. PSI record-keeping is one component in our PSM program for this site. PSM stands for Process Safety Management. This program is required by OSHA for all facilities that handle hazardous chemicals. In the case of the Fertilizer area, ammonia is the chemical which causes us to be a PSM area. Ammonia is used by both fertilizer plants to produce MAP and DAP. The PSI files contain information about the process and the materials and equipment used in the plant. Process chemistry, MSDS sheets, equipment design data, and P&IDs are just a few of the items contained in these files. One of my jobs this summer was to update some of the information in these files. Specifically, I developed more detailed data to document our maximum intended ammonia inventory calculations, and I improved the organization of equipment data sheets.
For calculating ammonia inventory the steps shown where taken. The way the system was broken into sections was determined by separating the liquid and vapor ammonia pipes, the areas where the pipe size changed, and the vaporizers. The calculations on the vaporizers was the most complicated part of the calculation. The vaporizers have tube bundles in them that take away usable space, and assumptions on the amount of liquid vs. vapor ammonia in them was needed.
Here are some examples of the sections discussed earlier. (point out some things)
These are some pictures on the vaporizers in the plant. Before ammonia reached the vaporizers it was in the liquid state, and afterwards it was vapor. The two on the left are the west and east vaporizers of the #2 plant, both have exact same design. The photo on the right is the Map#3 vaporizer, as you can see its design is different being vertical, so its tube bundle arrangement is different.
Another requirement of PSI files is to keep information on the critical equipment. These files are suppose to contain a summary of the purpose and design specs on the pieces of equipment. The current ones were very large and had information that was not necessary, so steps to make these files more efficient was needed. I looked for where drawings that gave a good understanding of the equipment. The places where the information was found was in the office building I was in, and in the maintenance shop behind the tank farm. The information in the office was found in large Mechanical Volumes. These volumes had the information that was needed, but a lot of the information stored in these volumes where unusable as far as purpose and summaries go. In the end the papers and drawings usable from these volumes was only about two to three pages per equipment vs. the rest of the info stored being about two to three hundred. The information in maintenance was just as clustered. Most of the information in their files where on work orders and failure reports, very few usable drawings where found. In the end, I took all the information I found from both areas and organized better equipment data sheets.
These are several of the DATA analysis I took over the internship. The first listed was used
MACT (Maximum Achievable Control Technology )
CAM (Compliance Assurance Monitoring)
TPA and APA
MACT (Maximum Achievable Control Technology )
CAM (Compliance Assurance Monitoring)
TPA and APA
Here is a look at the different blend piles of MAP3, the purpose of me taking these types of photos was to help with sales. Most of the time customers expect MAP and DAP to look a certain way, but because of the different blends used for making solid fertilizer. The product often looks different. The confusion often causes complaints. This photo takes look at MAP with different levels of DI’s in the blend. DI’s are Hard acid from the filter presses in the Poly plant. The blends pumped into the solids fertilizer are from tanks that always measure a total of 20’. Each individual part of the blend is also measured in feet. The blends are constantly changing due to the different types of Feed acid coming from different areas of the plant. The three piles you see before you in order are; the 4 ft DI blend in the center, 5 ft DI blend in the left, and the 3ft DI blend in the back.
These are several of the DATA analysis I took over the internship. The first listed was used
MACT (Maximum Achievable Control Technology )
CAM (Compliance Assurance Monitoring)
TPA and APA
Over the course of my internship I constantly kept track of the SGN and UI information of the product from the solids plants. The chart at the bottom of the slide shows the average difference the plants had from the lab over a 2 and a half month period. The constant difference in SGN readings caused for an investigation of the testing process and equipment of the areas.
(has similar information on previous slide)
I made four P&ID’s from scratch this summer. One was a drawing of the Urea System in the rail yard. The other three where drawings of the 150# steam, DPW, and Pond Water systems in the DAP2 plant.
The one you see before you is the Urea system. The Urea system is used to help out the Nitrogen level in the MAP plant when it gets low. It might be hard to see, but all the pumps and valves on the lines are labeled, and the direction the pipes are pumped is shown. While doing all these drawings I first made hand drawings that I traced multiple times to make sure I didn’t miss anything. If I had a question on a particular piece of piping, valve, or indicator I would take a picture and then show it to a local engineer to find out what it was, and what its symbol was suppose to be.
This is the 150# steam system in the DAP2 plant. This system had the most to trace, most indicators, and most different types of valves. The steam system is connected to the Vaporizers, Granulator, Coating oil tank, RGC scrubber, and reactor.
During all these projects and other things I learned a lot from this internship. For starters, I learned that I have a lot to learn, I also learned about the proper safety equipment that is required to work in certain areas of the plant. I learned how pieces of equipment where designed and worked (scrubbers, granulator, vaporizers, different valves etc.). I learned a little about how the chemicals are mixed to make the products sold here. How to read P&ID’s (very important), and even how to draw them using AutoCAD. How to troubleshoot. What kind of information is necessary to keep track of in plants. Finally what it takes to make all this happen. (from engineers to operators to maintenance to shipping) it’s a team effort, not one skill set can make everything happen, and its ok to ask questions , it’s how you learn.
Special thanks to all these people for all your help, teaching, and patience.