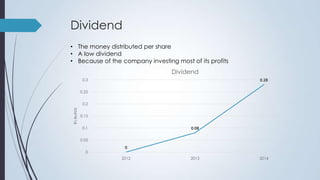
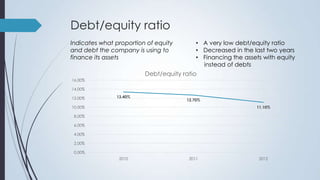
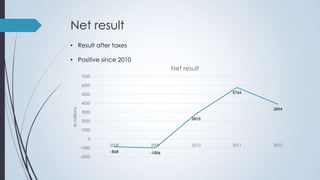
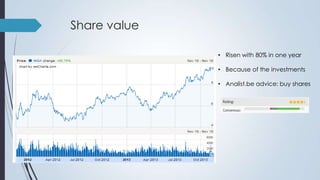
2. Table of contents
Dividend
Debt/equity ratio
Net result
Share value
Durability
Conclusion
Sources
3. Dividend
• The money distributed per share
• A low dividend
• Because of the company investing most of its profits
Dividend
0.3
0.28
0.25
In euros
0.2
0.15
0.1
0.08
0.05
0
0
2012
2013
2014
4. Debt/equity ratio
Indicates what proportion of equity
and debt the company is using to
finance its assets
• A very low debt/equity ratio
• Decreased in the last two years
• Financing the assets with equity
instead of debts
Debt/equity ratio
16.00%
14.00%
12.00%
13.40%
12.70%
10.00%
11.10%
8.00%
6.00%
4.00%
2.00%
0.00%
2010
2011
2012
5. Net result
• Result after taxes
• Positive since 2010
Net result
7000
6000
5766
5000
In millions
4000
3894
3000
2810
2000
1000
0
-1000
-2000
2008
2009
-868
-1006
2010
2011
2012
6. Share value
• Risen with 80% in one year
• Because of the investments
• Analist.be advice: buy shares
7. Durability
In 2006 the ING Group invested near €200 billion in durability projects.
The ING Group refuses to invest in company’s which are involved in the
production of controversial weapons.
In the same year the ING Group achieved a score of 73,5 for durability in
it’s sector. The average score for that sector is 47,4.
8. Conclusion
Good investment:
Investing the profits to get a higher share value
A low debt/equity ratio
A positive net result
An increase of the share value with more than 80%
Investing in durability