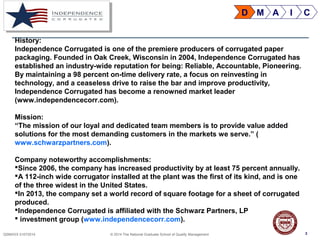
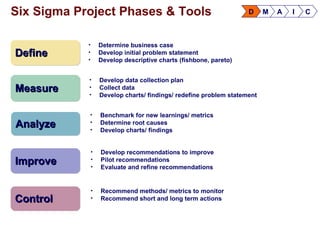
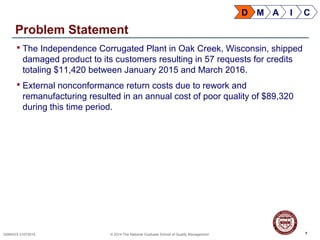
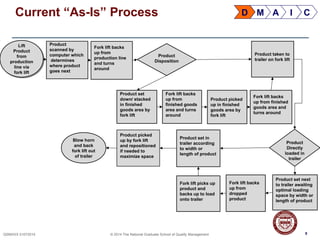
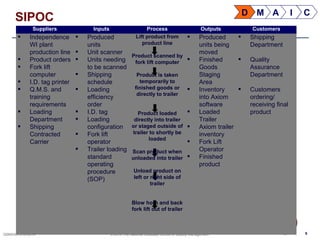
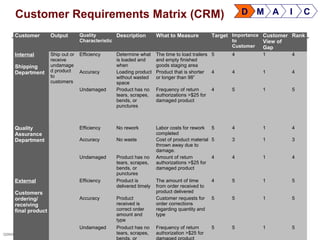
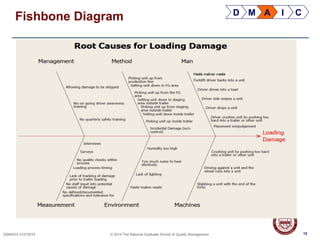
SlideShare a Scribd company logo
1 of 36
1© 2014 The National Graduate School of Quality Management 1
EDU QSM 566(O); Cohort 116
Master Business Project; Team Independence
1/27/17
2QSMXXX 01072014 © 2014 The National Graduate School of Quality Management
Team Independence - Corrugated
Product Loading Damage Project
2
D M A I C
Team Members:
Louis Poggenburg
Manager, Quality Assurance
Independence Corrugated
Oak Creek, WI
Kistler D. Fletcher Sr.
Senior Advisor, Logistics Automation
Project Manager/T3P
DynCorp International, LLC
Kabul, Afghanistan
Yvonne Rutherford, BS, CQPA
Administrative Officer, Community-
based Outpatient Clinics
Primary Care, Veterans Affairs
Dublin, GA
3QSMXXX 01072014 © 2014 The National Graduate School of Quality Management 3
History:
Independence Corrugated is one of the premiere producers of corrugated paper
packaging. Founded in Oak Creek, Wisconsin in 2004, Independence Corrugated has
established an industry-wide reputation for being: Reliable, Accountable, Pioneering.
By maintaining a 98 percent on-time delivery rate, a focus on reinvesting in
technology, and a ceaseless drive to raise the bar and improve productivity,
Independence Corrugated has become a renowned market leader
(www.independencecorr.com).
Mission:
“The mission of our loyal and dedicated team members is to provide value added
solutions for the most demanding customers in the markets we serve.” (
www.schwarzpartners.com).
Company noteworthy accomplishments:
Since 2006, the company has increased productivity by at least 75 percent annually.
A 112-inch wide corrugator installed at the plant was the first of its kind, and is one
of the three widest in the United States.
In 2013, the company set a world record of square footage for a sheet of corrugated
produced.
Independence Corrugated is affiliated with the Schwarz Partners, LP
 investment group (www.independencecorr.com).
D M A I C
4QSMXXX 01072014 © 2014 The National Graduate School of Quality Management
Independence Corrugated
Champion and Guiding Coalition
 Champion
Chad Gillenwater
The Plant Manager has complete responsibility for the overall leadership, commitment,
implementation, and adherence to Independence Corrugated Production & Quality
System.
 Day-to-Day Champions
Joe Sexton
Production Superintendent; responsible for the day to day control of manufacturing
processes, equipment, maintenance and adherence to the Quality System.
Jacob Brandt
Accounts Receivable; gathers and collects data, maintains financial spreadsheets.
John Luznicky
Production Coordinator and Safe Trainer; assists with quality as needed.
4
D M A I C
5QSMXXX 01072014 © 2014 The National Graduate School of Quality Management
Guiding Coalition – cont’d
Erik Piorkowski
QC Technician
Jon Snelson
Shipping Manager
Develops the shipping functions for all 12 plants.
Shipping Supervisors
Will be informed of any process changes made.
Jeff Floyd
1st Shift Supervisor
Jim Sindric
2nd
Shift Supervisor
Glen Zandi
3rd
Shift Supervisor
5
D M A I C
AnalyzeAnalyzeAnalyzeAnalyze
MeasureMeasureMeasureMeasure
DefineDefineDefineDefine
ControlControlControlControl
ImproveImproveImproveImprove
D M A I C
• Determine business case
• Develop initial problem statement
• Develop descriptive charts (fishbone, pareto)
• Develop data collection plan
• Collect data
• Develop charts/ findings/ redefine problem statement
• Benchmark for new learnings/ metrics
• Determine root causes
• Develop charts/ findings
• Develop recommendations to improve
• Pilot recommendations
• Evaluate and refine recommendations
• Recommend methods/ metrics to monitor
• Recommend short and long term actions
Six Sigma Project Phases & Tools
7QSMXXX 01072014 © 2014 The National Graduate School of Quality Management
Problem Statement
 The Independence Corrugated Plant in Oak Creek, Wisconsin, shipped
damaged product to its customers resulting in 57 requests for credits
totaling $11,420 between January 2015 and March 2016.
 External nonconformance return costs due to rework and
remanufacturing resulted in an annual cost of poor quality of $89,320
during this time period.
7
D M A I C
8QSMXXX 01072014 © 2014 The National Graduate School of Quality Management 8
Lift
Product
from
production
line via
fork lift
Lift
Product
from
production
line via
fork lift
Product
Disposition
Product
scanned by
computer which
determines
where product
goes next
Product set
down/ stacked
in finished
goods area by
fork lift
Product picked
up in finished
goods area by
fork lift
Product set in
trailer according
to width or
length of product
Fork lift backs
up from
production line
and turns
around
Fork lift backs
up from
finished goods
area and turns
around
Fork lift backs
up from finished
goods area and
turns around
Product picked
up by fork lift
and repositioned
if needed to
maximize space
Product
Directly
loaded in
trailer
Product taken to
trailer on fork lift
Product set next
to trailer awaiting
optimal loading
space by width or
length of product
Fork lift backs
up from
dropped
product
Fork lift picks up
product and
backs up to load
onto trailer
Blow horn
and back
fork lift out
of trailer
D M A I CCurrent “As-Is” Process
9QSMXXX 01072014 © 2014 The National Graduate School of Quality Management
SIPOC
9
Suppliers Inputs Process Outputs Customers
 Independence
WI plant
production line
 Product orders
 Fork lift
computer
 I.D. tag printer
 Q.M.S. and
training
requirements
 Loading
Department
 Shipping
Contracted
Carrier
 Produced
units
 Unit scanner
 Units needing
to be scanned
 Shipping
schedule
 Loading
efficiency
order
 I.D. tag
 Loading
configuration
 Fork lift
operator
 Trailer loading
standard
operating
procedure
(SOP)
Lift product from
product line
Product scanned by
fork lift computer
Product is taken
temporarily to
finished goods or
directly to trailer
Product loaded
directly into trailer
or staged outside of
trailer to shortly be
loaded
Scan product when
unloaded into trailer
Unload product on
left or right side of
trailer
Blow horn and back
fork lift out of trailer
 Produced
units being
moved
 Finished
Goods
Staging
Area
 Inventory
into Axiom
software
 Loaded
Trailer
 Axiom trailer
inventory
 Fork Lift
Operator
 Finished
product
 Shipping
Department
 Quality
Assurance
Department
 Customers
ordering/
receiving final
product
D M A I C
10QSMXXX 01072014 © 2014 The National Graduate School of Quality Management
Customer Requirements Matrix (CRM)
10
Customer Output Quality
Characteristic
Description What to Measure Target Importance
to
Customer
Customer
View of
Gap
Rank
Internal
Shipping
Department
Ship out or
receive
undamage
d product
to
customers
Efficiency Determine what
is loaded and
when
The time to load trailers
and empty finished
goods staging area
5 4 1 4
Accuracy Loading product
without wasted
space
Product that is shorter
or longer than 98”
4 4 1 4
Undamaged Product has no
tears, scrapes,
bends, or
punctures
Frequency of return
authorizations >$25 for
damaged product
4 5 1 5
Quality
Assurance
Department
Efficiency No rework Labor costs for rework
completed
5 4 1 4
Accuracy No waste Cost of product material
thrown away due to
damage.
5 3 1 3
Undamaged Product has no
tears, scrapes,
bends, or
punctures
Amount of return
authorizations >$25 for
damaged product
4 4 1 4
External
Customers
ordering/
receiving
final product
Efficiency Product is
delivered timely
The amount of time
from order received to
product delivered
4 5 1 5
Accuracy Product
received is
correct order
amount and
type
Customer requests for
order corrections
regarding quantity and
type
5 5 1 5
Undamaged Product has no
tears, scrapes,
bends, or
Frequency of return
authorization >$25 for
damaged product
5 5 1 5
D M A I C
11QSMXXX 01072014 © 2014 The National Graduate School of Quality Management 11
Data Collection Plan
Data to
collect
Stratification
Grouping
Op.
Def.?
Sample Size Source &
Location
Collection
Period
Responsible MBP
Member
QVR
Report
(Cost)
By customer
and cost
Yes Monthly
12 months
100% QVRs
Customer
Service
Department
Oct 2015 to
September
2016 (last day
of each month)
Louis Poggenburg
(Collection)
Yvonne Rutherford
(Analysis)
Process
Damage
Detection
Monitor
By shift (1st
,
2nd
, 3rd
)
Yes 60 days
Mon – Fri
Every 4 hours;
3 Shifts
Observational
Product
Inspection
July 25 to Sept
25, 2016
Louis Poggenburg
(Collection)
Yvonne Rutherford
(Analysis)
Surveys Forklift Drivers;
Quality Tech;
Prod. Coord.
No 12 drivers
(100%)
1 QT
1 PC
In-person and
while loading
from floor each
shift
July 25, 2016 to
August 5, 2016
Louis Poggenburg
(Collection)
Yvonne Rutherford
(Analysis)
Loading
Process
Time
Average By
Shift and by
step
No 10 random
loads per shift
Shipping Floor Aug 15, 2016 to
Sept 10, 2016
Louis Poggenburg
(Collection)
Yvonne Rutherford
(Analysis)
Employee
Training
Records
By employee
as a group of
Drivers
Yes 12 records
12 months
Shipping
Supervisors
October 2015 to
September
2016
Louis Poggenburg
(Collection and
Analysis)
D M A I C
12QSMXXX 01072014 © 2014 The National Graduate School of Quality Management
Fishbone Diagram
12
D M A I C
13QSMXXX 01072014 © 2014 The National Graduate School of Quality Management
13
Operational Definitions / Acronyms
 QVR – Quality Variance Report contains detailed damage data based on customer
credit requests.
 Lead Time – The elapsed time from time of order entry by the Independence CSR and
the production of finished units that arrive to the customer receiving dock.
 Damage – Although customers are more lenient, the depth of an indentation or tear
that is at least a .5” for corrugated sheets with no scores and at least .75” for
corrugated sheets with scores, as decided by Independence.
 Loading Process Time – time when product is picked up to when dropped off at
staged area and/or trailer.
 Pre-loading Damage – damage detected prior to product being picked up by a fork lift
 In-Process Damage Detection Monitor – A monitor documenting product damage
discovered prior to trailer being closed and moving from the loading dock.
 Scores – Dimensionally set line impressions in a corrugated sheet that allows the
sheet to bend without it cracking when being formed into a finished customer’s
product.
D M A I C
14QSMXXX 01072014 © 2014 The National Graduate School of Quality Management
Force Field Analysis
14
Reduce
loading
damaged
product and
customer
credit
requests.
Supportive
Forces
Restraining Forces
Increase Customer Satisfaction
(5)
Reduced Redundancy (4)
Decreased Rework Time (4)
Reduced Processing and
Shipping Time (4)
Cost reduction for rework and
materials (3)
Supporting Forces
Weight: 20
Training time (1)
Resistance to Change by Front
line and Supervisory Staff (5)
Sense of Urgency/ creating
short-cuts (4)
Increased monitoring (2)
The ability to ensure change is
implemented accurately (3)
Communication between all 3
shifts (2)
Restraining Forces
Weight: 17
D M A I C
15QSMXXX 01072014 © 2014 The National Graduate School of Quality Management
Mitigation of the Restraining Forces
15
Restraining Forces
Training time (1)
Resistance to Change by Front
line and Supervisory Staff (5)
Sense of Urgency/ creating
short-cuts (4)
Increased monitoring (2)
The ability to ensure change is
implemented accurately (3)
Communication between all 3
shifts (2)
Restraining Forces
Weight: 17
Training time will be entered into Outlook as a recurring
appointment
Change will be supported by the Champion
Standardized work will alleviate shortcutting by placing
emphasis on following the process via further defined
processes
Process audits will be the representative monitoring effort
and are fully supported by the Champion
Corrective actions will ensure that change is
implemented accurately
Inter-shift communication will be supported by
management, supervisors and leads
Mitigation Actions
D M A I C
16QSMXXX 01072014 © 2014 The National Graduate School of Quality Management
Forklift Driver Survey
16
Pinpointing Damage Location and How Often
Answer from a scale 1 to 5 if damage is likely to occur
5 – highly likely (strongly agree)
4 – most likely (agree)
3 – somewhat likely (somewhat agree)
2 – not very likely (disagree)
1 – not likely at all (strongly disagree)
Location: Damage occurs within the Loading Process: 1 2 3 4 5
1) when unit is picked up from production line 1 2 3 4 5
2) when unit is set down in FG area 1 2 3 4 5
3) when picking up unit from FG area 1 2 3 4 5
4) when setting unit down in staging outside trailer 1 2 3 4 5
5) when picking unit up in staging area outside trailer 1 2 3 4 5
6) when setting unit down inside trailer 1 2 3 4 5
7) picking unit up from inside trailer 1 2 3 4 5
Possible Causes of Damage: Happens what % out of 100
1) Incidental Damage caused by bumping while unit is sitting in FG or Staging area
2) Pushing unit too hard with forklift
3) Lack of training and/or skill of driver
4) Misjudgment of space or product size
5) Rubbing forklift tires against unit
6) Stabbing unit with fork lift
7) Forklift backs into unit
8) Forklift side swipes unit
9) Unit is dropped heavily or too fast
Open Suggestions of Causes by Driver
Driver Name
D M A I C
17QSMXXX 01072014 © 2014 The National Graduate School of Quality Management
Survey Data
17
D M A I C
18QSMXXX 01072014 © 2014 The National Graduate School of Quality Management
Loading Damage by Shift
18
D M A I C
8
0
%
19QSMXXX 01072014 © 2014 The National Graduate School of Quality Management
Loading Damage by Customer Claim
19
D M A I C
8
0
%
20QSMXXX 01072014 © 2014 The National Graduate School of Quality Management 20
D M A I C
21QSMXXX 01072014 © 2014 The National Graduate School of Quality Management 21
“Concentration” Diagram; Unit Damage Locations
D M A I C
22QSMXXX 01072014 © 2014 The National Graduate School of Quality Management
Damage Audit Sheet
22
D M A I C
6 Week Period; 7/25 – 9/15
Product was monitored in:
•Temporary Finished Goods
locations,
•All staging locations outside
of each trailer entrance,
•Inside each trailer, as trailers
were loaded.
•If product is damaged, it is
sorted and dispositioned and
the order is reduced by the
quantity damaged, if
approved, or the missing
sheets are remade at the
customer’s request.
While all three shifts
conducted two audits per
shift, the entire 6 week
monitor/measure phase
prevented any QVRs from
being generated by customers
for loading damage received.
23QSMXXX 01072014 © 2014 The National Graduate School of Quality Management
Cost Analysis/ COPQ
23
D M A I C
Tasks
Average
hours per
Task Hourly Rate
Cost of
Element
Material
Costs
External
Failure $
Internal
Failure $
Total
Failure
Cost
1. Customer Service
receives complaint
0.20 $25.00 $5.00 N/A $5.00 N/A $5.00
2. Forwards info to QA
and Production
0.10 $50.00 $5.00 N/A $5.00 N/A $5.00
3. Production
Superintendent
investigates problem
0.50 $50.00 $25.00 N/A $25.00 N/A $25.00
4. Cost of part N/A N/A N/A $776.27 $776.27 N/A $776.27
5. Production / QA
investigates the problem
4.00 $50.00 $200.00 N/A N/A N/A $200.00
6. Response and
requested credit is
provided to customer
0.75 $50.00 $37.50 776.00 $813.77 N/A $776.27
Total - - - - - -
$1,011/ ea.
Avg. Monthly Avg. Labor Avg. Material Avg. Total
Total
Damage $
Total
Failure
Annual annualized Failures = 52
# QVRs $ per QVR $ per QVR $ per QVR per year per year
4.4 $49.55 $776.27 $825.82 $42,943 $52,586.04
(50% reduction ) = $26,293.02
24QSMXXX 01072014 © 2014 The National Graduate School of Quality Management
Prevention Recommendations
24
Root Cause Recommendation Rationale Responsible/
Timeframe
Internal damage
occurred within the
loading process prior to
being loaded onto truck
trailer.
Internal Damage Audits Internal damage data was not being collected; routine
but random audits were implemented during the
measure phase and logged per shift by supervisors for
tracking and trending. Identifying internal damage before
loading onto trailer will minimize customer credit
requests. The scrutiny has already improved damage
occurrences. This practice will continue.
QA Manager
Implemented July
25, 2016 and On-
going for 1st
Shift
There is no current
standardized practices or
procedures for loading
and moving product
during the loading
process.
Develop a Standard
Operation Procedure
(SOP)
Developing a written procedure for the loading process
will standardize the process which is a practice of highly
reliable organizations and a best practice.
QA Manager/
Shipping Manager
Implemented by
February 15, 2017
There is no current fork
lift driver process training
or competency skill
verification.
Forklift Driver Training
with competency
qualification
Drivers will have a standardized method of loading and
moving product, training on methods, methodology, and
best practices will give the drivers the skills and
competency to load and move product with less
damage. The driver’s understanding of the training will
be assessed using competency skill validation.
QA Manager
Implemented
February 16, 2017
to March 10, 2017
Interviews revealed
drivers do not think
damage is likely to occur
at any stage of the
loading process. There is
no communication to the
drivers regarding actual
damage reported or
related cost.
A communication plan
with verbal and visual
techniques will be
implemented to ensure
routine briefs and visual
cues informing drivers of
current performance
measures status.
Communicating cost and frequency of damage with
expected goals between leadership and drivers will
encourage personal investment and result driven
behavior. Weekly routine communication will include the
drivers in the process improvement aspect encouraging
buy-in.
QA Manager/
Shipping Manager
Implemented March
13, 2017 and on-
going
D M A I C
25QSMXXX 01072014 © 2014 The National Graduate School of Quality Management
Failure Analysis Recommendations
25
Root Cause Recommendation Rationale Person
Responsible/
Timeframe
1st shift had only 6% of
total damage reported by
customers.
Identify 1st Shift Best
Practices
Examining the process and environment on 1st shift
will help guide improvement efforts on 2nd and 3rd
shift. This results in focused improvement efforts for
root causes. This information will assist in writing the
SOP and training modules.
QA Manager
Implemented
February 1 – 15,
2017
Independence has not
collaborated with other
companies in the field and
has not conducted their
own studies on loading
damage.
Consult w/ Rite Hite
Corp for Best Practices
Independence will benefit from other company's
lessons learned and research results regarding
loading damage. Implementing best and proven
practices will minimize damage frequency internally
prior to shipment. This effort may impact the SOP
and training aspects.
QA Manager
Implemented by
May 1, 2017
There are missed
opportunities to expand
the uses of the corrugated
product made by
Independence, Inc.
Pursue benchmark
venture w/ Ecologic
bottles
Working with an innovative company and expanding
the uses of the product will increase business
opportunities for the company. This process may take
months to establish a business contact and
relationship. This is reflected in the timeline.
QA Manager
Implemented by
April 1, 2017
There is no monitor of
loading process or end
result within the trailer.
Damage as a result of
loading is currently
unknown.
Add cameras facing
inside of loading trailers
Using video footage to review loading practices and
the end results of product loads can be used for
lessons learned and investigating shipping damage.
This step will likely cost the most and logistical
research is needed therefore will occur once drivers
are trained.
QA Manager
Implemented by
April 30, 2017
D M A I C
26QSMXXX 01072014 © 2014 The National Graduate School of Quality Management 26
Lift
Product
from
production
line via
fork lift
Lift
Product
from
production
line via
fork lift
Product
Disposition
Product
scanned by
computer which
determines
where product
goes next
Product set
down/ stacked
in finished
goods area by
fork lift
Product picked
up in finished
goods area by
fork lift
Product set in
trailer according
to width or
length of product
Fork lift backs
up from
production line
and turns
around
Fork lift backs
up from
finished goods
area and turns
around
Fork lift backs
up from finished
goods area and
turns around
Product picked
up by fork lift
and repositioned
if needed to
maximize space
Product
Directly
loaded in
trailer
Product taken to
trailer on fork lift
Product set next
to trailer awaiting
optimal loading
space by width or
length of product
Fork lift backs
up from
dropped
product
Fork lift picks up
product and
backs up to load
onto trailer
Blow horn
and back
fork lift out
of trailer
Future Process
Damage
Detection
Audit
Completed by
QA/ Shift
Supervisor
Damaged
Product
Removed
D M A I C
27QSMXXX 01072014 © 2014 The National Graduate School of Quality Management
Secondary Benchmark Research
In the article “Stop Load Damage”, William Atkinson discusses research results that
focus on loading freight and cargo practices that minimize product damage prior to and
during transit (2006).
Topics discussed in this article are:
1.Handling Practices
2.Loading Practices
3.Load Configuration
4.From Principles to Practice (pp. 2-3).
In the article “Liquids in Cardboard Containers”, Julie Corbett, founder and chief executive
(Ecologic Brands), said the bottles generate 59 percent less plastic waste, 37 percent fewer
carbon dioxide emissions and consume 48 percent less energy than equivalent plastic bottles
(2013).
Topics discussed in this article are:
1.Corrugated board recycling is big business right now
2.Converting 1 million pounds of discarded boxes each month
3.Produce 6 million bottles per year, from those discarded cardboard boxes for house-brand
products now, to potentially 60 million bottles per year in the future
4.Ecologic’s fiberboard bottles -- which have a plastic liner -- are an earth-friendly replacement
for plastic bottles
5.Other manufacturing applications now connect into the recycling world
28QSMXXX 01072014 © 2014 The National Graduate School of Quality Management
Implementation Strategy
28
D M A I C
29QSMXXX 01072014 © 2014 The National Graduate School of Quality Management
Implementation Cost
29
D M A I C
Prevention Plan Costs
Root Cause Description
Corrective Action Rationale
Annual Hours
Needed $/hr. Rate Total $
1. Lack of SOP Write SOP
Standardize the
process
2.0 $50 $100
2. Lack of Training (3rd)
Train & qualify 3rd
shift
Standardize the
process
10.0 $50 $500
3. Visual Management
Implement Visual
Management /
Metrics
Raise Departmental
Awareness
12.0 $50 $600
Total Total $1,200
Failure Reduction Analysis
Root Cause Description
Corrective Action Rationale
Annual Hours
Needed $/hr. Rate Total $
1st shift had 6% total damage reported
Implement Visual
Management /
Metrics
Improvements to be
added to SOP
4.0 $50 $200
Independence has not conducted a
benchmark study to date
Consult w/ Rite Hite
Corp for Best
Practices
Utilize lessons learned to
further reduce damage
4.0 $250/hr. $1,000
Missed opportunities to expand business
opportunities in this direction
Pursue benchmark
venture w/ Ecologic
bottles
Expanding market share TBD TBD TBD
No real time monitoring of trailer damage
inside trailer
Add cameras facing
inside of loading
trailers
to obtain additional
information for root
cause analysis
2.0 + 12.0
$35/hr; $3000
Equip.
$3,490
Total Total $5,890
30QSMXXX 01072014 © 2014 The National Graduate School of Quality Management
Return on Investment (ROI)
30
ROI
Achievable failure reduction (50%) $26,293
Prevention dollars = $1,200 = 21.91
Benefit / cost ROI = 21.9 : 1
D M A I C
ROI with Failure Reduction
Analysis
Achievable failure reduction (50%) $26,293
Prevention dollars = $5,890 = 4.46
Benefit / cost ROI = 4.46 : 1
31QSMXXX 01072014 © 2014 The National Graduate School of Quality Management
Payback Time
31
Prevention investment $1,200
Achievable savings
=
$26,293
=
0.05years
Payback
= 18days
D M A I C
Payback with Failure
Reduction Analysis
Prevention investment $5,890
Achievable savings = $26,293 = 0.22years
Payback = 80days
32QSMXXX 01072014 © 2014 The National Graduate School of Quality Management
Monitoring and Control Plan
32
Issue Date: 18-Oct-16
Approved by :
Team
Independence
NGS
Project Name: Loading Damage Reduction
Approval date: R1 10/19/2016 Cohort #116
Process Flow
Manufacturing
/ Machine
Characteristics Methods
Evaluation &
Measuring
Technique
Reactions if Out-of-
Control Conditions are
Encountered
Sequence
Number
Process
Description
Process Step Product
Target
Specification /
Tolerance
Sample Size
Sample
Frequency
Controlling
Owner
10A
Step 1
Production
Forklift
Lift product
from line
Step 1 damage free
(zero other defects)
0.0 +/- .050
without scores
0.0 +/- .
075 with
scores
Every Unit
Every
Set-up
Every Piece
as
needed
Forklift Driver
Tape Measure Quarantine unit and
notify shipping
20A Step 2 FG Forklift
Product
relocated in FG Step 1 damage free
(zero other defects)
0.0 +/- .050
without scores
0.0 +/- .
075 with
scores
Every Unit
Every
Set-up
All units
within
observed
reach of
audit
QA Dept.
Tape Measure
Quarantine unit and
notify shipping,
scheduling, and
production
30A Step 3 FG Forklift
Product picked
up from FG Step 1 damage free
(zero other defects)
0.0 +/- .050
without scores
0.0 +/- .
075 with
scores
Every Unit
Every
Set-up
Every Piece
as
needed
Forklift Driver
Tape Measure Quarantine unit and
notify shipping
40A Step 4 Stage Forklift
Product
relocated next to
trailer
Step 1 damage free
(zero other defects)
0.0 +/- .050
without scores
0.0 +/- .
075 with
scores
Every Unit
Every
Set-up
All units
within
observed
reach of
audit
QA Dept.
Tape Measure
Quarantine unit and
notify shipping,
scheduling, and
production
50A Step 5 Stage Forklift
Product picked
up next to trailer Step 1 damage free
(zero other defects)
0.0 +/- .050
without scores
0.0 +/- .
075 with
scores
Every Unit
Every
Set-up
Every Piece
as
needed
Forklift Driver
Tape Measure Quarantine unit and
notify shipping
60A Step 6 Trailer Forklift
Product
relocated left or
right side into
trailer
Step 1 damage free
(zero other defects)
0.0 +/- .050
without scores
0.0 +/- .
075 with
scores
Every Unit
Every
Set-up
All units
within
observed
reach of
audit
QA Dept.
Tape Measure
Quarantine unit and
notify shipping,
scheduling, and
production
70A Step 7 Trailer Forklift
Product
relocated within
trailer
Step 1 damage free
(zero other defects)
0.0 +/- .050
without scores
0.0 +/- .
075 with
scores
Every Unit
Every
Set-up
Every Piece
as
needed
Forklift Driver
Tape Measure Quarantine unit and
notify shipping
D M A I C
33QSMXXX 01072014 © 2014 The National Graduate School of Quality Management
Results
 Loading damage (forklifts) has shown a natural oscillation above and below the mean over the last three
years, derived from customer returns. However, as show below, rises in returns are approximately semi-
annual, during peak winter and summer months. SPC represents in and out of control conditions as they
happen.
 Although 1st
shift has been monitored before the measurement phase and continues to be monitored semi-
routinely, the only time in three years that this metric ever hit zero damage, was specifically when all three
shifts were being monitored. Therefore, a detectable difference exists when monitoring all three shifts.
 Wertheimer should be given more care during handling, due to this customer’s elevated sensitivity to damage
details and due to their large purchase volume; see customer Pareto diagram.
33
34QSMXXX 01072014 © 2014 The National Graduate School of Quality Management
Champion Review
 Well thought out
 Reasonable expectations for change
 Excellent understanding of our process
 Professional attitudes
 Open to ideas and perspective
34
35QSMXXX 01072014 © 2014 The National Graduate School of Quality Management
Lessons Learned
35
 The voice of customer (VOC) is necessary for problem solving.
 While data was collected and shared, collected data should be briefed to the team on a
scheduled basis to encourage understanding and team buy-in; perhaps weekly or bi-
weekly.
 Due to the fast-paced manufacturing environment and high demand for on-time delivery, it
is challenging to communicate as a group between employees and shifts.
 The establishment and conformity of communications plans and ground rules are critical
components of team development. Interpersonal skills are paramount to project success.
 It is essential to identify internal weaknesses in an effort to exploit and fortify them.
Identify and capitalize on internal/personal strengths in an effort to optimize productivity
and overall project objectives.
 Never rule out any thoughts from brainstorming/group activity when creating Cause &
Effect diagrams.
 Pareto charts are an excellent tool to use when pinpointing where your main problems are
occurring.
 Statistical Process Control (SPC) is a key element and rigorous approach for deciding
when a process has changed or needs intervention.
36QSMXXX 01072014 © 2014 The National Graduate School of Quality Management
This material is protected by United States copyright laws. You must treat this publication like any other proprietary material. No part of this material may
be copied, photocopied, reproduced, translated, or reduced to any electronic medium by individuals or organizations outside of The National Graduate
School of Quality Management without prior written consent from the National Graduate School of Quality Management. For information, please call
800.838.2580 or visit www.ngs.edu. © 2014 The National Graduate School of Quality Management.
363636
Celebrating 20 YEARS of Quality Education

More Related Content

What's hot

Company profile pt rigspek perkasa
Company profile   pt rigspek perkasaCompany profile   pt rigspek perkasa
Company profile pt rigspek perkasaRony Simeon
 
VDA6.3-Certificate_Adrian_ROSIAN
VDA6.3-Certificate_Adrian_ROSIANVDA6.3-Certificate_Adrian_ROSIAN
VDA6.3-Certificate_Adrian_ROSIANRosian Adrian
 
ResumeNewJobs_Maintenance_SupervisorI_Aug_2015
ResumeNewJobs_Maintenance_SupervisorI_Aug_2015ResumeNewJobs_Maintenance_SupervisorI_Aug_2015
ResumeNewJobs_Maintenance_SupervisorI_Aug_2015Donald Hall
 
Lubrication Program-Work Term Technical Report-APSC 310
Lubrication Program-Work Term Technical Report-APSC 310Lubrication Program-Work Term Technical Report-APSC 310
Lubrication Program-Work Term Technical Report-APSC 310JP Faucher
 
Qual 108 Delivering Quality Excellence for Operators
Qual 108 Delivering Quality Excellence for OperatorsQual 108 Delivering Quality Excellence for Operators
Qual 108 Delivering Quality Excellence for OperatorsOscar Garcia Gomez
 
Resume_Arun_Kothari_29_November_2015
Resume_Arun_Kothari_29_November_2015Resume_Arun_Kothari_29_November_2015
Resume_Arun_Kothari_29_November_2015Arun Kumar Kothari
 
Reverse Osmosis System by Metcon Water Systems Private Limited, Pune
Reverse Osmosis System by Metcon Water Systems Private Limited, PuneReverse Osmosis System by Metcon Water Systems Private Limited, Pune
Reverse Osmosis System by Metcon Water Systems Private Limited, PuneIndiaMART InterMESH Limited
 
Phoenix Quality armored vehicle inspections
Phoenix Quality   armored vehicle inspections Phoenix Quality   armored vehicle inspections
Phoenix Quality armored vehicle inspections Florin S. Fleseriu
 
Regal marine case study
Regal marine case studyRegal marine case study
Regal marine case studyMuhammad Sher
 
Qualitas Laboratory
Qualitas LaboratoryQualitas Laboratory
Qualitas LaboratoryVivin Vijay
 

What's hot (19)

Company profile pt rigspek perkasa
Company profile   pt rigspek perkasaCompany profile   pt rigspek perkasa
Company profile pt rigspek perkasa
 
CV Czech
CV CzechCV Czech
CV Czech
 
VDA6.3-Certificate_Adrian_ROSIAN
VDA6.3-Certificate_Adrian_ROSIANVDA6.3-Certificate_Adrian_ROSIAN
VDA6.3-Certificate_Adrian_ROSIAN
 
ResumeNewJobs_Maintenance_SupervisorI_Aug_2015
ResumeNewJobs_Maintenance_SupervisorI_Aug_2015ResumeNewJobs_Maintenance_SupervisorI_Aug_2015
ResumeNewJobs_Maintenance_SupervisorI_Aug_2015
 
Regal marine
Regal marineRegal marine
Regal marine
 
Lubrication Program-Work Term Technical Report-APSC 310
Lubrication Program-Work Term Technical Report-APSC 310Lubrication Program-Work Term Technical Report-APSC 310
Lubrication Program-Work Term Technical Report-APSC 310
 
3253127_KhalidAbdullah1
3253127_KhalidAbdullah13253127_KhalidAbdullah1
3253127_KhalidAbdullah1
 
Qual 108 Delivering Quality Excellence for Operators
Qual 108 Delivering Quality Excellence for OperatorsQual 108 Delivering Quality Excellence for Operators
Qual 108 Delivering Quality Excellence for Operators
 
Walker Derrick
Walker DerrickWalker Derrick
Walker Derrick
 
Resume_Arun_Kothari_29_November_2015
Resume_Arun_Kothari_29_November_2015Resume_Arun_Kothari_29_November_2015
Resume_Arun_Kothari_29_November_2015
 
Reverse Osmosis System by Metcon Water Systems Private Limited, Pune
Reverse Osmosis System by Metcon Water Systems Private Limited, PuneReverse Osmosis System by Metcon Water Systems Private Limited, Pune
Reverse Osmosis System by Metcon Water Systems Private Limited, Pune
 
Phoenix Quality armored vehicle inspections
Phoenix Quality   armored vehicle inspections Phoenix Quality   armored vehicle inspections
Phoenix Quality armored vehicle inspections
 
Regal marine case study
Regal marine case studyRegal marine case study
Regal marine case study
 
Qualitas Laboratory
Qualitas LaboratoryQualitas Laboratory
Qualitas Laboratory
 
Ted Bouchier - CV
Ted Bouchier - CVTed Bouchier - CV
Ted Bouchier - CV
 
CWI Certified Welding Inspector course
CWI Certified Welding Inspector courseCWI Certified Welding Inspector course
CWI Certified Welding Inspector course
 
CLS-12A091
CLS-12A091CLS-12A091
CLS-12A091
 
RESUME SOUMYADIP
RESUME SOUMYADIPRESUME SOUMYADIP
RESUME SOUMYADIP
 
Company Brochures
Company BrochuresCompany Brochures
Company Brochures
 

Viewers also liked

Suominen Corporation's Financial Statement Release 2016
Suominen Corporation's Financial Statement Release 2016Suominen Corporation's Financial Statement Release 2016
Suominen Corporation's Financial Statement Release 2016Suominen Corporation
 
Catalogo generale Melform 2017
Catalogo generale Melform 2017Catalogo generale Melform 2017
Catalogo generale Melform 2017Monica Lazzari
 
Darwin Newsletter_English_as of 13June 2016
Darwin Newsletter_English_as of 13June 2016Darwin Newsletter_English_as of 13June 2016
Darwin Newsletter_English_as of 13June 2016Margarita Lavides
 
OIA schooltrips catalogue (SchooltripsAsia)
OIA schooltrips catalogue (SchooltripsAsia)OIA schooltrips catalogue (SchooltripsAsia)
OIA schooltrips catalogue (SchooltripsAsia)Ludovic Odier
 
Unidad 2 repaso - ees 8
Unidad 2   repaso - ees 8Unidad 2   repaso - ees 8
Unidad 2 repaso - ees 8tatalin
 

Viewers also liked (8)

Suominen Corporation's Financial Statement Release 2016
Suominen Corporation's Financial Statement Release 2016Suominen Corporation's Financial Statement Release 2016
Suominen Corporation's Financial Statement Release 2016
 
IDCC 2264 Avenant 26 cmp vf
IDCC 2264 Avenant 26 cmp   vfIDCC 2264 Avenant 26 cmp   vf
IDCC 2264 Avenant 26 cmp vf
 
Catalogo generale Melform 2017
Catalogo generale Melform 2017Catalogo generale Melform 2017
Catalogo generale Melform 2017
 
Darwin Newsletter_English_as of 13June 2016
Darwin Newsletter_English_as of 13June 2016Darwin Newsletter_English_as of 13June 2016
Darwin Newsletter_English_as of 13June 2016
 
OIA schooltrips catalogue (SchooltripsAsia)
OIA schooltrips catalogue (SchooltripsAsia)OIA schooltrips catalogue (SchooltripsAsia)
OIA schooltrips catalogue (SchooltripsAsia)
 
res- electromech
res- electromechres- electromech
res- electromech
 
Unidad 2 repaso - ees 8
Unidad 2   repaso - ees 8Unidad 2   repaso - ees 8
Unidad 2 repaso - ees 8
 
Elena
ElenaElena
Elena
 

Similar to Final MBP Presenatation 1-27-17

Robert Ginn Resume - 2015
Robert Ginn Resume - 2015Robert Ginn Resume - 2015
Robert Ginn Resume - 2015Robert Ginn
 
Design of a Prevention, Appraisal and Failure Cost Model
Design of a Prevention, Appraisal and Failure Cost ModelDesign of a Prevention, Appraisal and Failure Cost Model
Design of a Prevention, Appraisal and Failure Cost ModelTennelli Industries (Pty) Ltd
 
Exploratory Testing on Agile Projects: Combining SBTM and TBTM
Exploratory Testing on Agile Projects: Combining SBTM and TBTMExploratory Testing on Agile Projects: Combining SBTM and TBTM
Exploratory Testing on Agile Projects: Combining SBTM and TBTMTechWell
 
2018-11-141Project ManagementClass – 10Project Q
2018-11-141Project ManagementClass – 10Project Q2018-11-141Project ManagementClass – 10Project Q
2018-11-141Project ManagementClass – 10Project Qcargillfilberto
 
COPQ & ROI Presentation 572 [10-18-16]
COPQ & ROI Presentation 572  [10-18-16]COPQ & ROI Presentation 572  [10-18-16]
COPQ & ROI Presentation 572 [10-18-16]Louis Poggenburg
 
Basics of quality and seven qc tools
Basics of quality and seven qc toolsBasics of quality and seven qc tools
Basics of quality and seven qc toolsPrashant Alekar
 
Anant shah asc-2017
Anant shah  asc-2017Anant shah  asc-2017
Anant shah asc-2017Anant Shah
 
PerformanceAppraisal 2015
PerformanceAppraisal 2015PerformanceAppraisal 2015
PerformanceAppraisal 2015Stephen Martin
 
J H Scott Resume
J H Scott ResumeJ H Scott Resume
J H Scott Resumejames scott
 
JYanez Resume 2015
JYanez Resume 2015JYanez Resume 2015
JYanez Resume 2015Jaime Yanez
 
John Gwozdz - resume 8-10-16
John Gwozdz - resume  8-10-16John Gwozdz - resume  8-10-16
John Gwozdz - resume 8-10-16John Gwozdz
 
TMEI Services and Case Studies-References 01232010
TMEI  Services and  Case Studies-References 01232010TMEI  Services and  Case Studies-References 01232010
TMEI Services and Case Studies-References 01232010Ralph W Peters
 
Calabro Enzo_Resume
Calabro Enzo_Resume Calabro Enzo_Resume
Calabro Enzo_Resume Enzo Calabro
 
SS_New_Resume_200816
SS_New_Resume_200816SS_New_Resume_200816
SS_New_Resume_200816Shanmu S
 

Similar to Final MBP Presenatation 1-27-17 (20)

COPQ Presentation 2
COPQ Presentation  2COPQ Presentation  2
COPQ Presentation 2
 
Robert Ginn Resume - 2015
Robert Ginn Resume - 2015Robert Ginn Resume - 2015
Robert Ginn Resume - 2015
 
Design of a Prevention, Appraisal and Failure Cost Model
Design of a Prevention, Appraisal and Failure Cost ModelDesign of a Prevention, Appraisal and Failure Cost Model
Design of a Prevention, Appraisal and Failure Cost Model
 
Exploratory Testing on Agile Projects: Combining SBTM and TBTM
Exploratory Testing on Agile Projects: Combining SBTM and TBTMExploratory Testing on Agile Projects: Combining SBTM and TBTM
Exploratory Testing on Agile Projects: Combining SBTM and TBTM
 
DOUGLAS D 2
DOUGLAS D 2DOUGLAS D 2
DOUGLAS D 2
 
525 EWB-ND
525 EWB-ND525 EWB-ND
525 EWB-ND
 
2018-11-141Project ManagementClass – 10Project Q
2018-11-141Project ManagementClass – 10Project Q2018-11-141Project ManagementClass – 10Project Q
2018-11-141Project ManagementClass – 10Project Q
 
COPQ & ROI Presentation 572 [10-18-16]
COPQ & ROI Presentation 572  [10-18-16]COPQ & ROI Presentation 572  [10-18-16]
COPQ & ROI Presentation 572 [10-18-16]
 
Basics of quality and seven qc tools
Basics of quality and seven qc toolsBasics of quality and seven qc tools
Basics of quality and seven qc tools
 
scottsresume1116
scottsresume1116scottsresume1116
scottsresume1116
 
Anant shah asc-2017
Anant shah  asc-2017Anant shah  asc-2017
Anant shah asc-2017
 
PerformanceAppraisal 2015
PerformanceAppraisal 2015PerformanceAppraisal 2015
PerformanceAppraisal 2015
 
J H Scott Resume
J H Scott ResumeJ H Scott Resume
J H Scott Resume
 
JYanez Resume 2015
JYanez Resume 2015JYanez Resume 2015
JYanez Resume 2015
 
John Gwozdz - resume 8-10-16
John Gwozdz - resume  8-10-16John Gwozdz - resume  8-10-16
John Gwozdz - resume 8-10-16
 
Van Resume June 2016
Van Resume June 2016Van Resume June 2016
Van Resume June 2016
 
TMEI Services and Case Studies-References 01232010
TMEI  Services and  Case Studies-References 01232010TMEI  Services and  Case Studies-References 01232010
TMEI Services and Case Studies-References 01232010
 
ChrisGiroux
ChrisGirouxChrisGiroux
ChrisGiroux
 
Calabro Enzo_Resume
Calabro Enzo_Resume Calabro Enzo_Resume
Calabro Enzo_Resume
 
SS_New_Resume_200816
SS_New_Resume_200816SS_New_Resume_200816
SS_New_Resume_200816
 

Final MBP Presenatation 1-27-17

  • 1. 1© 2014 The National Graduate School of Quality Management 1 EDU QSM 566(O); Cohort 116 Master Business Project; Team Independence 1/27/17
  • 2. 2QSMXXX 01072014 © 2014 The National Graduate School of Quality Management Team Independence - Corrugated Product Loading Damage Project 2 D M A I C Team Members: Louis Poggenburg Manager, Quality Assurance Independence Corrugated Oak Creek, WI Kistler D. Fletcher Sr. Senior Advisor, Logistics Automation Project Manager/T3P DynCorp International, LLC Kabul, Afghanistan Yvonne Rutherford, BS, CQPA Administrative Officer, Community- based Outpatient Clinics Primary Care, Veterans Affairs Dublin, GA
  • 3. 3QSMXXX 01072014 © 2014 The National Graduate School of Quality Management 3 History: Independence Corrugated is one of the premiere producers of corrugated paper packaging. Founded in Oak Creek, Wisconsin in 2004, Independence Corrugated has established an industry-wide reputation for being: Reliable, Accountable, Pioneering. By maintaining a 98 percent on-time delivery rate, a focus on reinvesting in technology, and a ceaseless drive to raise the bar and improve productivity, Independence Corrugated has become a renowned market leader (www.independencecorr.com). Mission: “The mission of our loyal and dedicated team members is to provide value added solutions for the most demanding customers in the markets we serve.” ( www.schwarzpartners.com). Company noteworthy accomplishments: Since 2006, the company has increased productivity by at least 75 percent annually. A 112-inch wide corrugator installed at the plant was the first of its kind, and is one of the three widest in the United States. In 2013, the company set a world record of square footage for a sheet of corrugated produced. Independence Corrugated is affiliated with the Schwarz Partners, LP  investment group (www.independencecorr.com). D M A I C
  • 4. 4QSMXXX 01072014 © 2014 The National Graduate School of Quality Management Independence Corrugated Champion and Guiding Coalition  Champion Chad Gillenwater The Plant Manager has complete responsibility for the overall leadership, commitment, implementation, and adherence to Independence Corrugated Production & Quality System.  Day-to-Day Champions Joe Sexton Production Superintendent; responsible for the day to day control of manufacturing processes, equipment, maintenance and adherence to the Quality System. Jacob Brandt Accounts Receivable; gathers and collects data, maintains financial spreadsheets. John Luznicky Production Coordinator and Safe Trainer; assists with quality as needed. 4 D M A I C
  • 5. 5QSMXXX 01072014 © 2014 The National Graduate School of Quality Management Guiding Coalition – cont’d Erik Piorkowski QC Technician Jon Snelson Shipping Manager Develops the shipping functions for all 12 plants. Shipping Supervisors Will be informed of any process changes made. Jeff Floyd 1st Shift Supervisor Jim Sindric 2nd Shift Supervisor Glen Zandi 3rd Shift Supervisor 5 D M A I C
  • 6. AnalyzeAnalyzeAnalyzeAnalyze MeasureMeasureMeasureMeasure DefineDefineDefineDefine ControlControlControlControl ImproveImproveImproveImprove D M A I C • Determine business case • Develop initial problem statement • Develop descriptive charts (fishbone, pareto) • Develop data collection plan • Collect data • Develop charts/ findings/ redefine problem statement • Benchmark for new learnings/ metrics • Determine root causes • Develop charts/ findings • Develop recommendations to improve • Pilot recommendations • Evaluate and refine recommendations • Recommend methods/ metrics to monitor • Recommend short and long term actions Six Sigma Project Phases & Tools
  • 7. 7QSMXXX 01072014 © 2014 The National Graduate School of Quality Management Problem Statement  The Independence Corrugated Plant in Oak Creek, Wisconsin, shipped damaged product to its customers resulting in 57 requests for credits totaling $11,420 between January 2015 and March 2016.  External nonconformance return costs due to rework and remanufacturing resulted in an annual cost of poor quality of $89,320 during this time period. 7 D M A I C
  • 8. 8QSMXXX 01072014 © 2014 The National Graduate School of Quality Management 8 Lift Product from production line via fork lift Lift Product from production line via fork lift Product Disposition Product scanned by computer which determines where product goes next Product set down/ stacked in finished goods area by fork lift Product picked up in finished goods area by fork lift Product set in trailer according to width or length of product Fork lift backs up from production line and turns around Fork lift backs up from finished goods area and turns around Fork lift backs up from finished goods area and turns around Product picked up by fork lift and repositioned if needed to maximize space Product Directly loaded in trailer Product taken to trailer on fork lift Product set next to trailer awaiting optimal loading space by width or length of product Fork lift backs up from dropped product Fork lift picks up product and backs up to load onto trailer Blow horn and back fork lift out of trailer D M A I CCurrent “As-Is” Process
  • 9. 9QSMXXX 01072014 © 2014 The National Graduate School of Quality Management SIPOC 9 Suppliers Inputs Process Outputs Customers  Independence WI plant production line  Product orders  Fork lift computer  I.D. tag printer  Q.M.S. and training requirements  Loading Department  Shipping Contracted Carrier  Produced units  Unit scanner  Units needing to be scanned  Shipping schedule  Loading efficiency order  I.D. tag  Loading configuration  Fork lift operator  Trailer loading standard operating procedure (SOP) Lift product from product line Product scanned by fork lift computer Product is taken temporarily to finished goods or directly to trailer Product loaded directly into trailer or staged outside of trailer to shortly be loaded Scan product when unloaded into trailer Unload product on left or right side of trailer Blow horn and back fork lift out of trailer  Produced units being moved  Finished Goods Staging Area  Inventory into Axiom software  Loaded Trailer  Axiom trailer inventory  Fork Lift Operator  Finished product  Shipping Department  Quality Assurance Department  Customers ordering/ receiving final product D M A I C
  • 10. 10QSMXXX 01072014 © 2014 The National Graduate School of Quality Management Customer Requirements Matrix (CRM) 10 Customer Output Quality Characteristic Description What to Measure Target Importance to Customer Customer View of Gap Rank Internal Shipping Department Ship out or receive undamage d product to customers Efficiency Determine what is loaded and when The time to load trailers and empty finished goods staging area 5 4 1 4 Accuracy Loading product without wasted space Product that is shorter or longer than 98” 4 4 1 4 Undamaged Product has no tears, scrapes, bends, or punctures Frequency of return authorizations >$25 for damaged product 4 5 1 5 Quality Assurance Department Efficiency No rework Labor costs for rework completed 5 4 1 4 Accuracy No waste Cost of product material thrown away due to damage. 5 3 1 3 Undamaged Product has no tears, scrapes, bends, or punctures Amount of return authorizations >$25 for damaged product 4 4 1 4 External Customers ordering/ receiving final product Efficiency Product is delivered timely The amount of time from order received to product delivered 4 5 1 5 Accuracy Product received is correct order amount and type Customer requests for order corrections regarding quantity and type 5 5 1 5 Undamaged Product has no tears, scrapes, bends, or Frequency of return authorization >$25 for damaged product 5 5 1 5 D M A I C
  • 11. 11QSMXXX 01072014 © 2014 The National Graduate School of Quality Management 11 Data Collection Plan Data to collect Stratification Grouping Op. Def.? Sample Size Source & Location Collection Period Responsible MBP Member QVR Report (Cost) By customer and cost Yes Monthly 12 months 100% QVRs Customer Service Department Oct 2015 to September 2016 (last day of each month) Louis Poggenburg (Collection) Yvonne Rutherford (Analysis) Process Damage Detection Monitor By shift (1st , 2nd , 3rd ) Yes 60 days Mon – Fri Every 4 hours; 3 Shifts Observational Product Inspection July 25 to Sept 25, 2016 Louis Poggenburg (Collection) Yvonne Rutherford (Analysis) Surveys Forklift Drivers; Quality Tech; Prod. Coord. No 12 drivers (100%) 1 QT 1 PC In-person and while loading from floor each shift July 25, 2016 to August 5, 2016 Louis Poggenburg (Collection) Yvonne Rutherford (Analysis) Loading Process Time Average By Shift and by step No 10 random loads per shift Shipping Floor Aug 15, 2016 to Sept 10, 2016 Louis Poggenburg (Collection) Yvonne Rutherford (Analysis) Employee Training Records By employee as a group of Drivers Yes 12 records 12 months Shipping Supervisors October 2015 to September 2016 Louis Poggenburg (Collection and Analysis) D M A I C
  • 12. 12QSMXXX 01072014 © 2014 The National Graduate School of Quality Management Fishbone Diagram 12 D M A I C
  • 13. 13QSMXXX 01072014 © 2014 The National Graduate School of Quality Management 13 Operational Definitions / Acronyms  QVR – Quality Variance Report contains detailed damage data based on customer credit requests.  Lead Time – The elapsed time from time of order entry by the Independence CSR and the production of finished units that arrive to the customer receiving dock.  Damage – Although customers are more lenient, the depth of an indentation or tear that is at least a .5” for corrugated sheets with no scores and at least .75” for corrugated sheets with scores, as decided by Independence.  Loading Process Time – time when product is picked up to when dropped off at staged area and/or trailer.  Pre-loading Damage – damage detected prior to product being picked up by a fork lift  In-Process Damage Detection Monitor – A monitor documenting product damage discovered prior to trailer being closed and moving from the loading dock.  Scores – Dimensionally set line impressions in a corrugated sheet that allows the sheet to bend without it cracking when being formed into a finished customer’s product. D M A I C
  • 14. 14QSMXXX 01072014 © 2014 The National Graduate School of Quality Management Force Field Analysis 14 Reduce loading damaged product and customer credit requests. Supportive Forces Restraining Forces Increase Customer Satisfaction (5) Reduced Redundancy (4) Decreased Rework Time (4) Reduced Processing and Shipping Time (4) Cost reduction for rework and materials (3) Supporting Forces Weight: 20 Training time (1) Resistance to Change by Front line and Supervisory Staff (5) Sense of Urgency/ creating short-cuts (4) Increased monitoring (2) The ability to ensure change is implemented accurately (3) Communication between all 3 shifts (2) Restraining Forces Weight: 17 D M A I C
  • 15. 15QSMXXX 01072014 © 2014 The National Graduate School of Quality Management Mitigation of the Restraining Forces 15 Restraining Forces Training time (1) Resistance to Change by Front line and Supervisory Staff (5) Sense of Urgency/ creating short-cuts (4) Increased monitoring (2) The ability to ensure change is implemented accurately (3) Communication between all 3 shifts (2) Restraining Forces Weight: 17 Training time will be entered into Outlook as a recurring appointment Change will be supported by the Champion Standardized work will alleviate shortcutting by placing emphasis on following the process via further defined processes Process audits will be the representative monitoring effort and are fully supported by the Champion Corrective actions will ensure that change is implemented accurately Inter-shift communication will be supported by management, supervisors and leads Mitigation Actions D M A I C
  • 16. 16QSMXXX 01072014 © 2014 The National Graduate School of Quality Management Forklift Driver Survey 16 Pinpointing Damage Location and How Often Answer from a scale 1 to 5 if damage is likely to occur 5 – highly likely (strongly agree) 4 – most likely (agree) 3 – somewhat likely (somewhat agree) 2 – not very likely (disagree) 1 – not likely at all (strongly disagree) Location: Damage occurs within the Loading Process: 1 2 3 4 5 1) when unit is picked up from production line 1 2 3 4 5 2) when unit is set down in FG area 1 2 3 4 5 3) when picking up unit from FG area 1 2 3 4 5 4) when setting unit down in staging outside trailer 1 2 3 4 5 5) when picking unit up in staging area outside trailer 1 2 3 4 5 6) when setting unit down inside trailer 1 2 3 4 5 7) picking unit up from inside trailer 1 2 3 4 5 Possible Causes of Damage: Happens what % out of 100 1) Incidental Damage caused by bumping while unit is sitting in FG or Staging area 2) Pushing unit too hard with forklift 3) Lack of training and/or skill of driver 4) Misjudgment of space or product size 5) Rubbing forklift tires against unit 6) Stabbing unit with fork lift 7) Forklift backs into unit 8) Forklift side swipes unit 9) Unit is dropped heavily or too fast Open Suggestions of Causes by Driver Driver Name D M A I C
  • 17. 17QSMXXX 01072014 © 2014 The National Graduate School of Quality Management Survey Data 17 D M A I C
  • 18. 18QSMXXX 01072014 © 2014 The National Graduate School of Quality Management Loading Damage by Shift 18 D M A I C 8 0 %
  • 19. 19QSMXXX 01072014 © 2014 The National Graduate School of Quality Management Loading Damage by Customer Claim 19 D M A I C 8 0 %
  • 20. 20QSMXXX 01072014 © 2014 The National Graduate School of Quality Management 20 D M A I C
  • 21. 21QSMXXX 01072014 © 2014 The National Graduate School of Quality Management 21 “Concentration” Diagram; Unit Damage Locations D M A I C
  • 22. 22QSMXXX 01072014 © 2014 The National Graduate School of Quality Management Damage Audit Sheet 22 D M A I C 6 Week Period; 7/25 – 9/15 Product was monitored in: •Temporary Finished Goods locations, •All staging locations outside of each trailer entrance, •Inside each trailer, as trailers were loaded. •If product is damaged, it is sorted and dispositioned and the order is reduced by the quantity damaged, if approved, or the missing sheets are remade at the customer’s request. While all three shifts conducted two audits per shift, the entire 6 week monitor/measure phase prevented any QVRs from being generated by customers for loading damage received.
  • 23. 23QSMXXX 01072014 © 2014 The National Graduate School of Quality Management Cost Analysis/ COPQ 23 D M A I C Tasks Average hours per Task Hourly Rate Cost of Element Material Costs External Failure $ Internal Failure $ Total Failure Cost 1. Customer Service receives complaint 0.20 $25.00 $5.00 N/A $5.00 N/A $5.00 2. Forwards info to QA and Production 0.10 $50.00 $5.00 N/A $5.00 N/A $5.00 3. Production Superintendent investigates problem 0.50 $50.00 $25.00 N/A $25.00 N/A $25.00 4. Cost of part N/A N/A N/A $776.27 $776.27 N/A $776.27 5. Production / QA investigates the problem 4.00 $50.00 $200.00 N/A N/A N/A $200.00 6. Response and requested credit is provided to customer 0.75 $50.00 $37.50 776.00 $813.77 N/A $776.27 Total - - - - - - $1,011/ ea. Avg. Monthly Avg. Labor Avg. Material Avg. Total Total Damage $ Total Failure Annual annualized Failures = 52 # QVRs $ per QVR $ per QVR $ per QVR per year per year 4.4 $49.55 $776.27 $825.82 $42,943 $52,586.04 (50% reduction ) = $26,293.02
  • 24. 24QSMXXX 01072014 © 2014 The National Graduate School of Quality Management Prevention Recommendations 24 Root Cause Recommendation Rationale Responsible/ Timeframe Internal damage occurred within the loading process prior to being loaded onto truck trailer. Internal Damage Audits Internal damage data was not being collected; routine but random audits were implemented during the measure phase and logged per shift by supervisors for tracking and trending. Identifying internal damage before loading onto trailer will minimize customer credit requests. The scrutiny has already improved damage occurrences. This practice will continue. QA Manager Implemented July 25, 2016 and On- going for 1st Shift There is no current standardized practices or procedures for loading and moving product during the loading process. Develop a Standard Operation Procedure (SOP) Developing a written procedure for the loading process will standardize the process which is a practice of highly reliable organizations and a best practice. QA Manager/ Shipping Manager Implemented by February 15, 2017 There is no current fork lift driver process training or competency skill verification. Forklift Driver Training with competency qualification Drivers will have a standardized method of loading and moving product, training on methods, methodology, and best practices will give the drivers the skills and competency to load and move product with less damage. The driver’s understanding of the training will be assessed using competency skill validation. QA Manager Implemented February 16, 2017 to March 10, 2017 Interviews revealed drivers do not think damage is likely to occur at any stage of the loading process. There is no communication to the drivers regarding actual damage reported or related cost. A communication plan with verbal and visual techniques will be implemented to ensure routine briefs and visual cues informing drivers of current performance measures status. Communicating cost and frequency of damage with expected goals between leadership and drivers will encourage personal investment and result driven behavior. Weekly routine communication will include the drivers in the process improvement aspect encouraging buy-in. QA Manager/ Shipping Manager Implemented March 13, 2017 and on- going D M A I C
  • 25. 25QSMXXX 01072014 © 2014 The National Graduate School of Quality Management Failure Analysis Recommendations 25 Root Cause Recommendation Rationale Person Responsible/ Timeframe 1st shift had only 6% of total damage reported by customers. Identify 1st Shift Best Practices Examining the process and environment on 1st shift will help guide improvement efforts on 2nd and 3rd shift. This results in focused improvement efforts for root causes. This information will assist in writing the SOP and training modules. QA Manager Implemented February 1 – 15, 2017 Independence has not collaborated with other companies in the field and has not conducted their own studies on loading damage. Consult w/ Rite Hite Corp for Best Practices Independence will benefit from other company's lessons learned and research results regarding loading damage. Implementing best and proven practices will minimize damage frequency internally prior to shipment. This effort may impact the SOP and training aspects. QA Manager Implemented by May 1, 2017 There are missed opportunities to expand the uses of the corrugated product made by Independence, Inc. Pursue benchmark venture w/ Ecologic bottles Working with an innovative company and expanding the uses of the product will increase business opportunities for the company. This process may take months to establish a business contact and relationship. This is reflected in the timeline. QA Manager Implemented by April 1, 2017 There is no monitor of loading process or end result within the trailer. Damage as a result of loading is currently unknown. Add cameras facing inside of loading trailers Using video footage to review loading practices and the end results of product loads can be used for lessons learned and investigating shipping damage. This step will likely cost the most and logistical research is needed therefore will occur once drivers are trained. QA Manager Implemented by April 30, 2017 D M A I C
  • 26. 26QSMXXX 01072014 © 2014 The National Graduate School of Quality Management 26 Lift Product from production line via fork lift Lift Product from production line via fork lift Product Disposition Product scanned by computer which determines where product goes next Product set down/ stacked in finished goods area by fork lift Product picked up in finished goods area by fork lift Product set in trailer according to width or length of product Fork lift backs up from production line and turns around Fork lift backs up from finished goods area and turns around Fork lift backs up from finished goods area and turns around Product picked up by fork lift and repositioned if needed to maximize space Product Directly loaded in trailer Product taken to trailer on fork lift Product set next to trailer awaiting optimal loading space by width or length of product Fork lift backs up from dropped product Fork lift picks up product and backs up to load onto trailer Blow horn and back fork lift out of trailer Future Process Damage Detection Audit Completed by QA/ Shift Supervisor Damaged Product Removed D M A I C
  • 27. 27QSMXXX 01072014 © 2014 The National Graduate School of Quality Management Secondary Benchmark Research In the article “Stop Load Damage”, William Atkinson discusses research results that focus on loading freight and cargo practices that minimize product damage prior to and during transit (2006). Topics discussed in this article are: 1.Handling Practices 2.Loading Practices 3.Load Configuration 4.From Principles to Practice (pp. 2-3). In the article “Liquids in Cardboard Containers”, Julie Corbett, founder and chief executive (Ecologic Brands), said the bottles generate 59 percent less plastic waste, 37 percent fewer carbon dioxide emissions and consume 48 percent less energy than equivalent plastic bottles (2013). Topics discussed in this article are: 1.Corrugated board recycling is big business right now 2.Converting 1 million pounds of discarded boxes each month 3.Produce 6 million bottles per year, from those discarded cardboard boxes for house-brand products now, to potentially 60 million bottles per year in the future 4.Ecologic’s fiberboard bottles -- which have a plastic liner -- are an earth-friendly replacement for plastic bottles 5.Other manufacturing applications now connect into the recycling world
  • 28. 28QSMXXX 01072014 © 2014 The National Graduate School of Quality Management Implementation Strategy 28 D M A I C
  • 29. 29QSMXXX 01072014 © 2014 The National Graduate School of Quality Management Implementation Cost 29 D M A I C Prevention Plan Costs Root Cause Description Corrective Action Rationale Annual Hours Needed $/hr. Rate Total $ 1. Lack of SOP Write SOP Standardize the process 2.0 $50 $100 2. Lack of Training (3rd) Train & qualify 3rd shift Standardize the process 10.0 $50 $500 3. Visual Management Implement Visual Management / Metrics Raise Departmental Awareness 12.0 $50 $600 Total Total $1,200 Failure Reduction Analysis Root Cause Description Corrective Action Rationale Annual Hours Needed $/hr. Rate Total $ 1st shift had 6% total damage reported Implement Visual Management / Metrics Improvements to be added to SOP 4.0 $50 $200 Independence has not conducted a benchmark study to date Consult w/ Rite Hite Corp for Best Practices Utilize lessons learned to further reduce damage 4.0 $250/hr. $1,000 Missed opportunities to expand business opportunities in this direction Pursue benchmark venture w/ Ecologic bottles Expanding market share TBD TBD TBD No real time monitoring of trailer damage inside trailer Add cameras facing inside of loading trailers to obtain additional information for root cause analysis 2.0 + 12.0 $35/hr; $3000 Equip. $3,490 Total Total $5,890
  • 30. 30QSMXXX 01072014 © 2014 The National Graduate School of Quality Management Return on Investment (ROI) 30 ROI Achievable failure reduction (50%) $26,293 Prevention dollars = $1,200 = 21.91 Benefit / cost ROI = 21.9 : 1 D M A I C ROI with Failure Reduction Analysis Achievable failure reduction (50%) $26,293 Prevention dollars = $5,890 = 4.46 Benefit / cost ROI = 4.46 : 1
  • 31. 31QSMXXX 01072014 © 2014 The National Graduate School of Quality Management Payback Time 31 Prevention investment $1,200 Achievable savings = $26,293 = 0.05years Payback = 18days D M A I C Payback with Failure Reduction Analysis Prevention investment $5,890 Achievable savings = $26,293 = 0.22years Payback = 80days
  • 32. 32QSMXXX 01072014 © 2014 The National Graduate School of Quality Management Monitoring and Control Plan 32 Issue Date: 18-Oct-16 Approved by : Team Independence NGS Project Name: Loading Damage Reduction Approval date: R1 10/19/2016 Cohort #116 Process Flow Manufacturing / Machine Characteristics Methods Evaluation & Measuring Technique Reactions if Out-of- Control Conditions are Encountered Sequence Number Process Description Process Step Product Target Specification / Tolerance Sample Size Sample Frequency Controlling Owner 10A Step 1 Production Forklift Lift product from line Step 1 damage free (zero other defects) 0.0 +/- .050 without scores 0.0 +/- . 075 with scores Every Unit Every Set-up Every Piece as needed Forklift Driver Tape Measure Quarantine unit and notify shipping 20A Step 2 FG Forklift Product relocated in FG Step 1 damage free (zero other defects) 0.0 +/- .050 without scores 0.0 +/- . 075 with scores Every Unit Every Set-up All units within observed reach of audit QA Dept. Tape Measure Quarantine unit and notify shipping, scheduling, and production 30A Step 3 FG Forklift Product picked up from FG Step 1 damage free (zero other defects) 0.0 +/- .050 without scores 0.0 +/- . 075 with scores Every Unit Every Set-up Every Piece as needed Forklift Driver Tape Measure Quarantine unit and notify shipping 40A Step 4 Stage Forklift Product relocated next to trailer Step 1 damage free (zero other defects) 0.0 +/- .050 without scores 0.0 +/- . 075 with scores Every Unit Every Set-up All units within observed reach of audit QA Dept. Tape Measure Quarantine unit and notify shipping, scheduling, and production 50A Step 5 Stage Forklift Product picked up next to trailer Step 1 damage free (zero other defects) 0.0 +/- .050 without scores 0.0 +/- . 075 with scores Every Unit Every Set-up Every Piece as needed Forklift Driver Tape Measure Quarantine unit and notify shipping 60A Step 6 Trailer Forklift Product relocated left or right side into trailer Step 1 damage free (zero other defects) 0.0 +/- .050 without scores 0.0 +/- . 075 with scores Every Unit Every Set-up All units within observed reach of audit QA Dept. Tape Measure Quarantine unit and notify shipping, scheduling, and production 70A Step 7 Trailer Forklift Product relocated within trailer Step 1 damage free (zero other defects) 0.0 +/- .050 without scores 0.0 +/- . 075 with scores Every Unit Every Set-up Every Piece as needed Forklift Driver Tape Measure Quarantine unit and notify shipping D M A I C
  • 33. 33QSMXXX 01072014 © 2014 The National Graduate School of Quality Management Results  Loading damage (forklifts) has shown a natural oscillation above and below the mean over the last three years, derived from customer returns. However, as show below, rises in returns are approximately semi- annual, during peak winter and summer months. SPC represents in and out of control conditions as they happen.  Although 1st shift has been monitored before the measurement phase and continues to be monitored semi- routinely, the only time in three years that this metric ever hit zero damage, was specifically when all three shifts were being monitored. Therefore, a detectable difference exists when monitoring all three shifts.  Wertheimer should be given more care during handling, due to this customer’s elevated sensitivity to damage details and due to their large purchase volume; see customer Pareto diagram. 33
  • 34. 34QSMXXX 01072014 © 2014 The National Graduate School of Quality Management Champion Review  Well thought out  Reasonable expectations for change  Excellent understanding of our process  Professional attitudes  Open to ideas and perspective 34
  • 35. 35QSMXXX 01072014 © 2014 The National Graduate School of Quality Management Lessons Learned 35  The voice of customer (VOC) is necessary for problem solving.  While data was collected and shared, collected data should be briefed to the team on a scheduled basis to encourage understanding and team buy-in; perhaps weekly or bi- weekly.  Due to the fast-paced manufacturing environment and high demand for on-time delivery, it is challenging to communicate as a group between employees and shifts.  The establishment and conformity of communications plans and ground rules are critical components of team development. Interpersonal skills are paramount to project success.  It is essential to identify internal weaknesses in an effort to exploit and fortify them. Identify and capitalize on internal/personal strengths in an effort to optimize productivity and overall project objectives.  Never rule out any thoughts from brainstorming/group activity when creating Cause & Effect diagrams.  Pareto charts are an excellent tool to use when pinpointing where your main problems are occurring.  Statistical Process Control (SPC) is a key element and rigorous approach for deciding when a process has changed or needs intervention.
  • 36. 36QSMXXX 01072014 © 2014 The National Graduate School of Quality Management This material is protected by United States copyright laws. You must treat this publication like any other proprietary material. No part of this material may be copied, photocopied, reproduced, translated, or reduced to any electronic medium by individuals or organizations outside of The National Graduate School of Quality Management without prior written consent from the National Graduate School of Quality Management. For information, please call 800.838.2580 or visit www.ngs.edu. © 2014 The National Graduate School of Quality Management. 363636 Celebrating 20 YEARS of Quality Education

Editor's Notes

  1. Independence Corrugated serves hundreds of customers in several industries. Between 40 and 50 truckloads of corrugated go out each day to cities like Minneapolis, St. Paul, Milwaukee, Chippewa Falls, Cedar Rapids, Chicago, and more. Numerous companies within a 400-mile radius of our Oak Creek plant rely on us for their packaging needs.
  2. Yvonne’s position involves submitting reports & correspondence. She maintains program review & respective budgets, merit review submissions, procedural writing, and insures that grant applications & final report gets completed. Kistler’s position involves training, advising, and assisting advisors, leaders, and logisticians. This involves all facets of warehouse & inventory management, supply chain activities, process improvement, quality control, and logistics automation.   Louis’ position involves process development and quality assurance, and supports development for other plants & customer sites, as needed. He also conducts audits & assesses adherence to key performance indicators. All three team members are prior military and Louis continues to serve in Reserves.  
  3. Independence Corrugated was founded in Oak Creek, Wisconsin in 2004, Independence Corrugated has established an industry-wide reputation for being • Reliable • Accountable • Pioneering.
  4. Chad G. oversees manufacturing and operations at the plant level. Jacob B. provides us with return credits detail.
  5. Both Jon S. and Jeff F. will be involved at the training level, as well as the implementing of upcoming procedures to reduce loading damage.
  6. Six Sigma prescribes an improvement process known as DMAIC: define, measure, analyze, improve, control. Each phase has its own milestones to ensure the project is successfully moving forward and potential challenges or obstacles are identified before moving into the next phase. Many project tasks and activities may be in different phases at the same time or the project may fluidly move between two phases before clearing moving into a single phase. The define phase identifies what the problem is in its current state without solution. The measure phase measures the current process as it is and performance metrics are identified. The analyze phase looks at the data collected during the measure phase, problems and root causes are identified. The improve phase is when the project team will develop solutions to the problem using the analyzed data and develop a plan of action. The control phase is where the improved process is monitored to ensure performance metrics are met or process improvement is continued.
  7. The problem statement and scope of this project were maintained throughout the entire process. Internal loading damage related to customer credit requests remained the team’s focal point throughout the project. You will see each tool indirectly referring back to this statement. The January thru March data was information already collected by the company that helped us identify a loss of money and a potential for rework.
  8. In the define phase, the current “as-is” work flow established each step of the process as is currently exists. This detailed view helped the team understand the scope of the current process and to visualize data collection opportunities for the measure phase. The as-is work flow is used as the basis for the future recommended workflow.
  9. A SIPOC diagram was used by the team to identify all relevant elements of the project before work began. We started with the macro level current process and then identified the inputs and outputs for each of those steps. This enabled us to easily identify the external and internal suppliers and customers related to the process. The information gained from this exercise helped the team identify the specific customer groups for the Customer Requirement Matrix within the scope of the project directly related to customer credit requests.
  10. To develop our Customer Requirement Matrix, we used the identified customers from the SIPOC and focused on the output they had most in common which was shipping or receiving undamaged product which also tied directly into our problem statement and scope which is internal loading damage resulting in customer request credits. Utilizing the voice of the customer, we identified a ranking to outline the most important characteristics by priority. This information guided the project focus and is reflected in our final recommendations.
  11. During our measuring phase, we developed a data collection plan starting with the Quality Variance Report which could give us the number of customer credit requests in a given time period, the amount requested, the specific customer, and the specific date of the relevant order. This information was pertinent in identifying our problem statement in the beginning and drilling down to specific customer and shift trends later in the project. During our development of this plan we realized very little additional data was being collected and we would need to initiate internal data collection methods. This led to internal quality audits that occurred during all three shifts every 4 hours by the Quality Assurance Manager or designated supervisor. Data was collected from the end of July to the end of September to identify any trends. We found just by initiating these audits, damage frequency went down. Forklift Driver surveys were conducted for all forklift drivers (10 total) and the information analyzed for any trends regarding risk level by process step. This information resulted in different results than anticipated and will be discussed later in the presentation. The loading process time data collection was not completed as anticipated as this was a secondary concern and not part of the original problem statement. While time is important, the process is driven by the production line. Later in the project, load process time was used to establish takt time. It was discovered there were no employee training records available or maintained for the forklift drivers pertaining to their driving skills, knowledge, or competency. As you can see, our data collection plan was driven by the problem statement, the scope of the project, Customer Requirement Matrix, and current workflow.
  12. The fishbone diagram was used to brainstorm potential causes of loading damage using six main categories of causes. It helped the team identify controllable and non-controllable root causes and focus in on related issues. Knowledge, perception, training, and handling of product were identified focal points. Management; the most probable root here is that no SOP or remedial training has been documented to date. Method; the most probable root here is setting a unit down inside the trailer. Manpower; the most probable root is this category is drivers crushing units by pushing too hard into a unit while moving it into tight trailer spacing. Measurement; the most probable root here is that no metric is posted/advertised throughout the department/organization. Environment; the most probable root here is the false belief that haste does not make waste; process first and speed later. Machines; the most probable root here is stabbing a unit with the end of the forks.
  13. The main definition in this project that is important to remember is “damage” because for the purpose of the company and process, the depth of an indentation or tear of at least .5” for corrugated sheets with no scores and at least .75” for sheets with scores is considered damage. The indentation or tear must meet this criteria in order to be considered damage.
  14. The Force Field Analysis is basically a risk analysis to assist the team identify the supportive and restraining forces as related to the problem statement and scope of the project. After scoring the probability of each force, the results demonstrated the supporting forces were greater than our restraining forces leading us to believe this was a viable project.
  15. Our mitigating actions directly tie into our final recommendations.
  16. This Likert survey was actually given to the 10 fork lift drivers at Independence Corrugated, Inc. during the past month to determine where the staff who are actually doing the job think the probability lies within the process. The methodology behind this survey was to ask the front line staff what their perception of damage potential for each step within the process. The team would use this information to pinpoint a specific step or steps in the process that could be specifically addressed while not spending time on steps that had little to no damage. We were looking for root causes at the most basic level of the process. The survey was handed to each driver during their break by the Quality Assurance Manager and collected.
  17. This graph demonstrates the driver’s perception of the likelihood of damage occurrence during each step in the process. As you can see there is a slight trend of 3 individuals perceiving step 3 as having the potential for damage occurrence and 2 individuals perceiving steps 2 and/or 7 as having potential. The team concluded the most informative data gained from the survey was that most drivers felt there was little to no likelihood of damage occurrence during most of the 7 steps. This could be from a lack of information communicated in the current process regarding frequency of damage occurrence and total cost of damage resulting from customer credit requests, therefore they may not even be aware of much damage is occurring.
  18. The Pareto Principle 80/20 rule implies that 80% of the benefit comes from 20% of the causes. Similarly, 20% of a business causes 80% of the delay or in this case damage. Using the QVR data, it was determined most of the customer credit requests resulted from damage that occurred on the third and second shifts.
  19. It is recommended that Wertheimer be given more care during handling, due to this customer’s elevated sensitivity to damage details and due to their large purchase volume. Percentage of sales was determined for each customer in this finite set and weights were given. Then the quantity of QVRs (customer credit requests) were multiplied against their respective weights to obtain an adjusted weight. The Pareto effect then ranks them by adjusted weight %.
  20. In larger a scale for viewing, the length of the damage for each unit is identified as shown above. Of the 95 units identified with internal damage during the measurement phase, higher probabilities for damage on the unit are circled. Because trailers are loaded from the right side of each trailer (crowning of roads tilt to the right side) and then filled in from the left side thereafter, often the lower left corner of the unit is damaged as shown. Other lesser damaged frequencies are noted as shown with circles.
  21. In larger a scale for viewing, the length of the damage for each unit is identified as shown above. Of the 95 units identified with internal damage during the measurement phase, higher probabilities for damage on the unit are circled. Because trailers are loaded from the right side of each trailer (crowning of roads tilt to the right side) and then filled in from the left side thereafter, often the lower left corner of the unit is damaged as shown. Other lesser damaged frequencies are noted as shown with circles.
  22. The product audit involves inspecting for damage, determining if it is within acceptance specification, and sorting out the nonconforming sheets. The next step is to either reduce the total sheets shipped to the customer or remake the damaged sheets. Both decisions are directed by the customer.
  23. Million Square Feet (MSF) is used to determine direct materials and direct labor. There is a ratio of 94% to 6%, respectively. The average number of returns (QVRs) per month is 4.4 Average monthly materials = $776.27; (.94 * $825.82) Average monthly labor = $49.55; (.06 * $825.82) Total annual failure costs = $52568.04; (52 occurrences * $1011)
  24. Question for professor regarding cameras.
  25. Interestingly, most of the process has not changed, with the exception of two steps outlined above in red. Our recommendations focus more on personal buy-in, product auditing twice per shift, sorting of damaged product that results from those audit findings, and competency qualification of the fork lift drivers. Additional recommendations such as annual training and competency checks, regular communication of metric performance, and the frequency of damage to the drivers is new and will help the drivers make the connection between their position and company outcomes. This ensures less damage is shipped to the customer.
  26. The implications from Atkinson’s article are improving forklift driver education to include “a comprehensive lift truck operator training” (2006, p.2). He mentions Rite-Hite Corp, a company that has studied “causes of load damage for about ten years” which may be a fruitful benchmark partner to seek out. Causes include unstable trailer floors, uneven floor transitions, and push damage from vertical lift bars in which possible solutions are mentioned as options (p.2). Improperly loading cargo into the trailer causes instability and increases shifting potential, thus using appropriate dunnage to fill in all gaps and stabilizing the load prior to shipment (p.3). The article also mentions Kraft Foods NA and their effort to reduce product damage in 1999, another possible benchmarking partner (p.3). This article directly relates to the process we are attempting to improve and how other companies are managing similar issues we have identified in initial baseline data collection. The implications from Ecologic’s article is that fiberboard bottles -- which have a plastic liner -- are an earth-friendly replacement for plastic bottles and can be used for a wide variety of consumer products (p. 1). The 60,000-square-foot facility at 550 Carnegie St. was formerly occupied by Amtex, which produced plastic liners closed after its main customer was shut down; a loss of 200 jobs. Corbett said the plant will be dedicated to "new products that replace plastic” (p.1). The Schwarz group, which operates our 13 plants nation-wide, could partner with Ecologic Brands, Inc. The California plant is one hour North of Manteca, where Ecologic Brands, Inc. resides (p.1). The article also states that Ecologic Brands is running two shifts a day at the Manteca plant, and if demand continues to grow, that could go to three shifts, an around-the-clock operation, by this fall, Corbett said. At its goal of 60 million bottles per year, she said the facility could employ 200 to 300 workers (p.2).
  27. Our team approach is logical and continues with what has been done and leads into a chronological flow: The implementation strategy starts with the continuation of specific tasks that have deemed useful in the measure phase such as internal damage audits. This leads into the identification of best practices internally and externally so this information can be included in the written Standard Operating Procedures (SOP), training, and competency skills check. Afterwards, the SOP and training will be developed followed by actually doing the training and checking driver competency skills.
  28. The top half exhibit represents costs without Failure Reduction Analysis. Whereas, those costs outlined below are to be considered: Procedural writing, qualifications competency training, and a damage metric to be updated weekly with the financial impact noted. Consider inquiring with Rite Hite for best practices training on forklifts and different surfaces that we come in contact with at our plant during the loading process. Schedule a sales meeting with Ecologic fiberboard bottles, regarding the providing of corrugated product from our NorCal facility to their facility in Manteca, CA. They originally started up production to 6 million corrugated bottle liners in their first year (2013), but were ramping up to producing 60 million per year. It may be worth looking into them for providing hogged corrugated board that NorCal Sheets disposes of for their production, instead of scrapping it out for pennies on the dollar. Evaluate the use of additional cameras for which to monitor the loading process, so as to further reduce damage.
  29. Again, the top exhibit represents costs without Failure Reduction Analysis. Whereas, those costs outlines below are to be considered.
  30. Again, the top exhibit represents costs without Failure Reduction Analysis. Whereas, those costs outlines below are to be considered.
  31. A control plan is a process management document that summarizes the measurement details (what? Where? How? Etc.) for each process step. CPs provide increased detail on the measurement controls that will remain in place as ‘business as usual’ after a Lean Six Sigma project is closed. For each process step, a CP defines the characteristics that are measured, their specification, applicable historical capability, measurement method used and a response plan if out of specification.
  32. As per point one, rises in frequency of damage returns are somewhat semi-annual, with peaks in the winter and summer months. On the basis of point two, a detectable difference appears to have existed when all three shifts were being monitored and measured (twice per shift) and data collected. Wertheimer should be given more care during handling, due to their elevated sensitivity.
  33. Will be added after Champion Meeting.