Downloaded 62 times


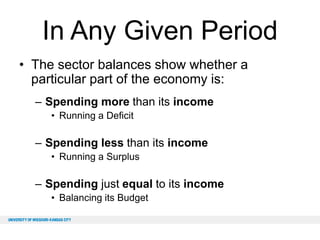


![Fiscal Space with EMU
“[T]he power to issue its own money, to
make drafts on its own central bank, is the
main thing which defines national
independence. If a country gives up or
loses this power, it acquires the status of a
local authority or colony.”
~Wynne Godley, 1992](https://image.slidesharecdn.com/fieldinstitute-131104161741-phpapp01/85/Fiscal-Space-and-Financial-Stability-A-Differential-Analysis-48-320.jpg)
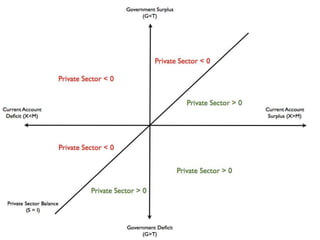
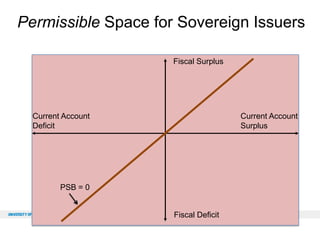

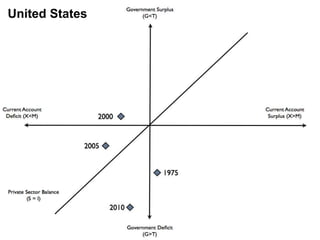
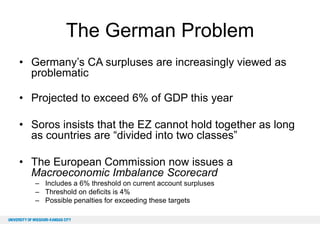


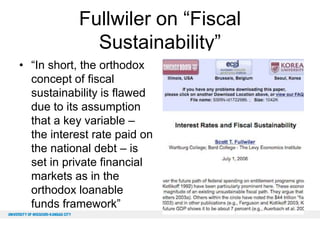
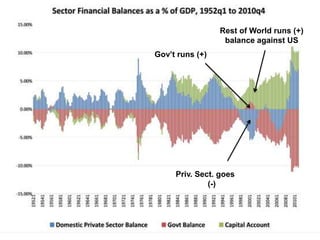
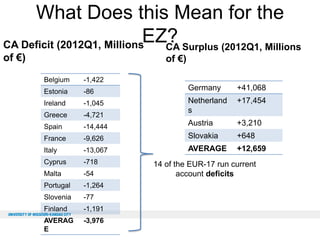
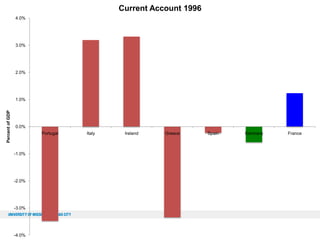
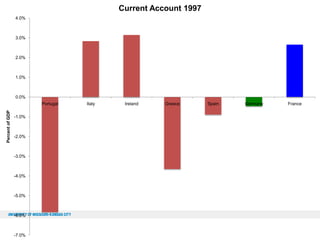
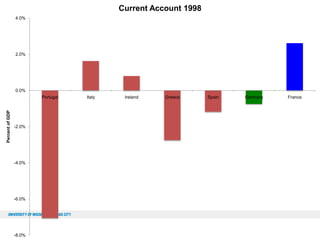
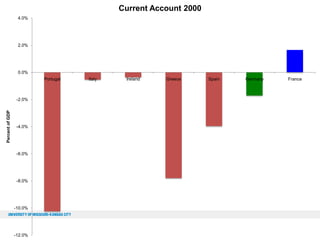
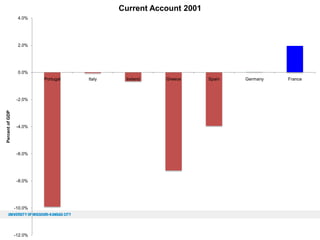
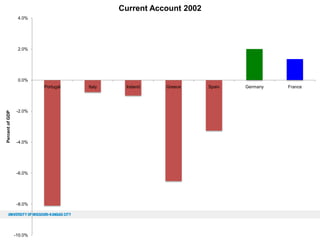
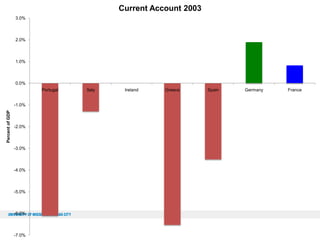
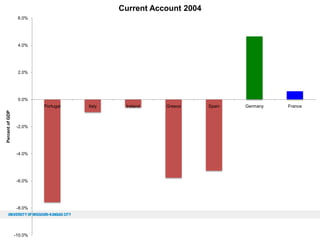
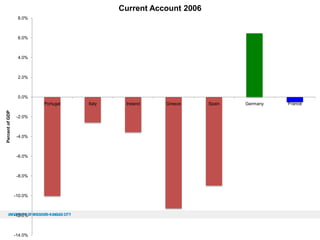
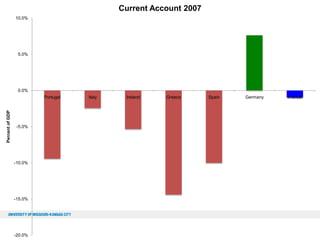
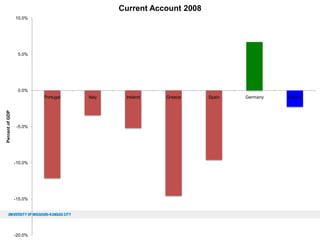
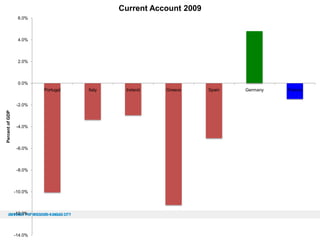
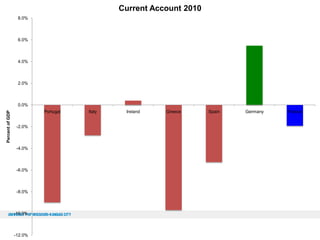
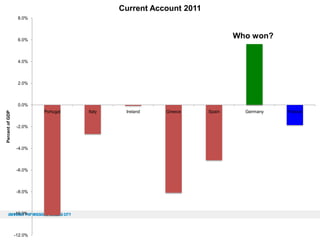
The document summarizes the Modern Money Theory (MMT) perspective on fiscal space and sustainability, contrasting it with the orthodox view. It discusses how MMT rejects the idea that government spending must be financed through taxes or debt issuance. Under MMT, a sovereign government with its own currency is only limited by real resources and inflation, not financial constraints. The document also examines sectoral balances and argues that countries with trade deficits need domestic budget deficits to support private sector surpluses. It analyzes how Germany achieved large trade surpluses within the Eurozone at the expense of its trade partners through internal devaluation.


