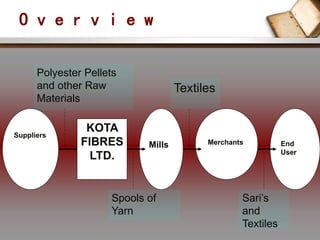
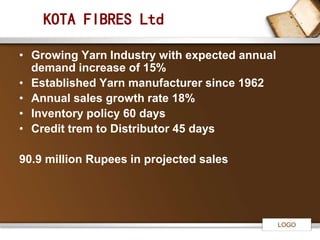
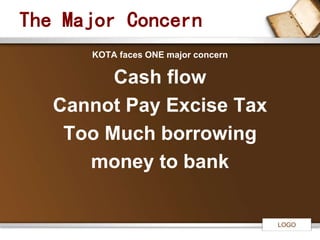
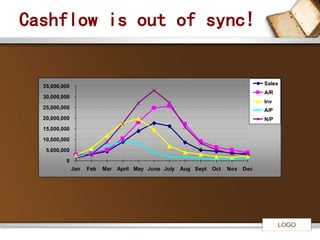
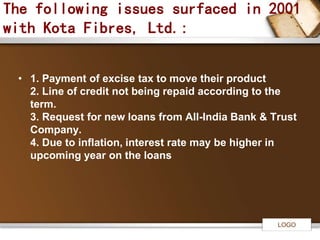
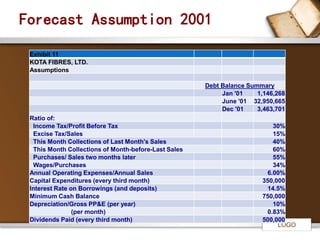
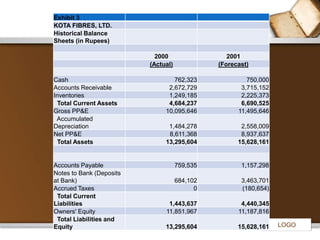
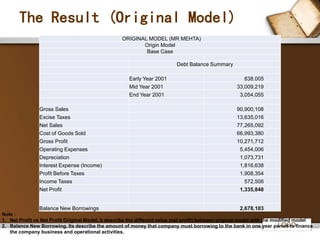
1. The document presents an analysis of different forecast models for Kota Fibres Ltd, an Indian yarn manufacturer, to address cash flow issues.
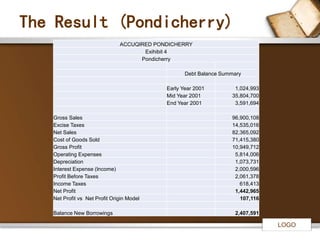
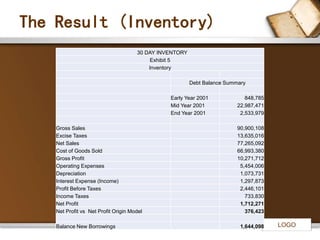
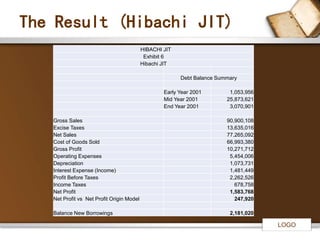
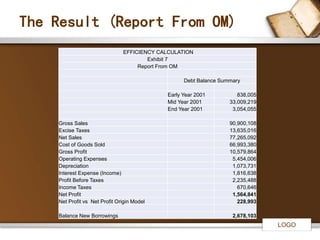
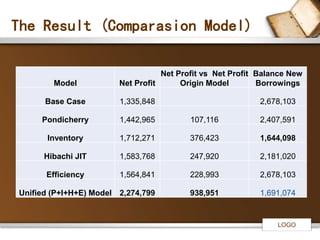
2. Key models analyzed include acquiring a new client, reducing inventory levels, a supplier's just-in-time proposal, and improving production efficiency.
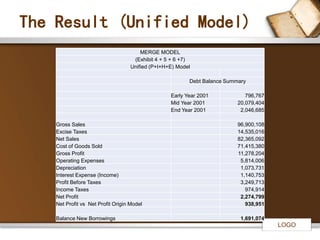
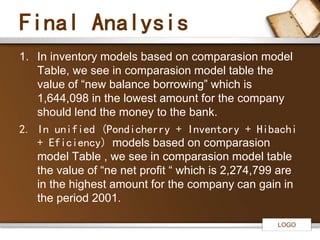
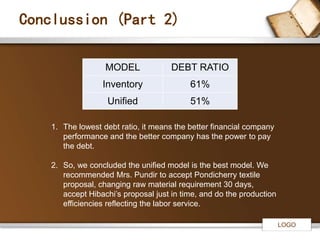
3. The unified model combining multiple changes produced the highest projected net profit of 2,274,799 rupees and lowest debt ratio, making it the recommended model to improve Kota Fibres' financial performance and secure future bank loans.