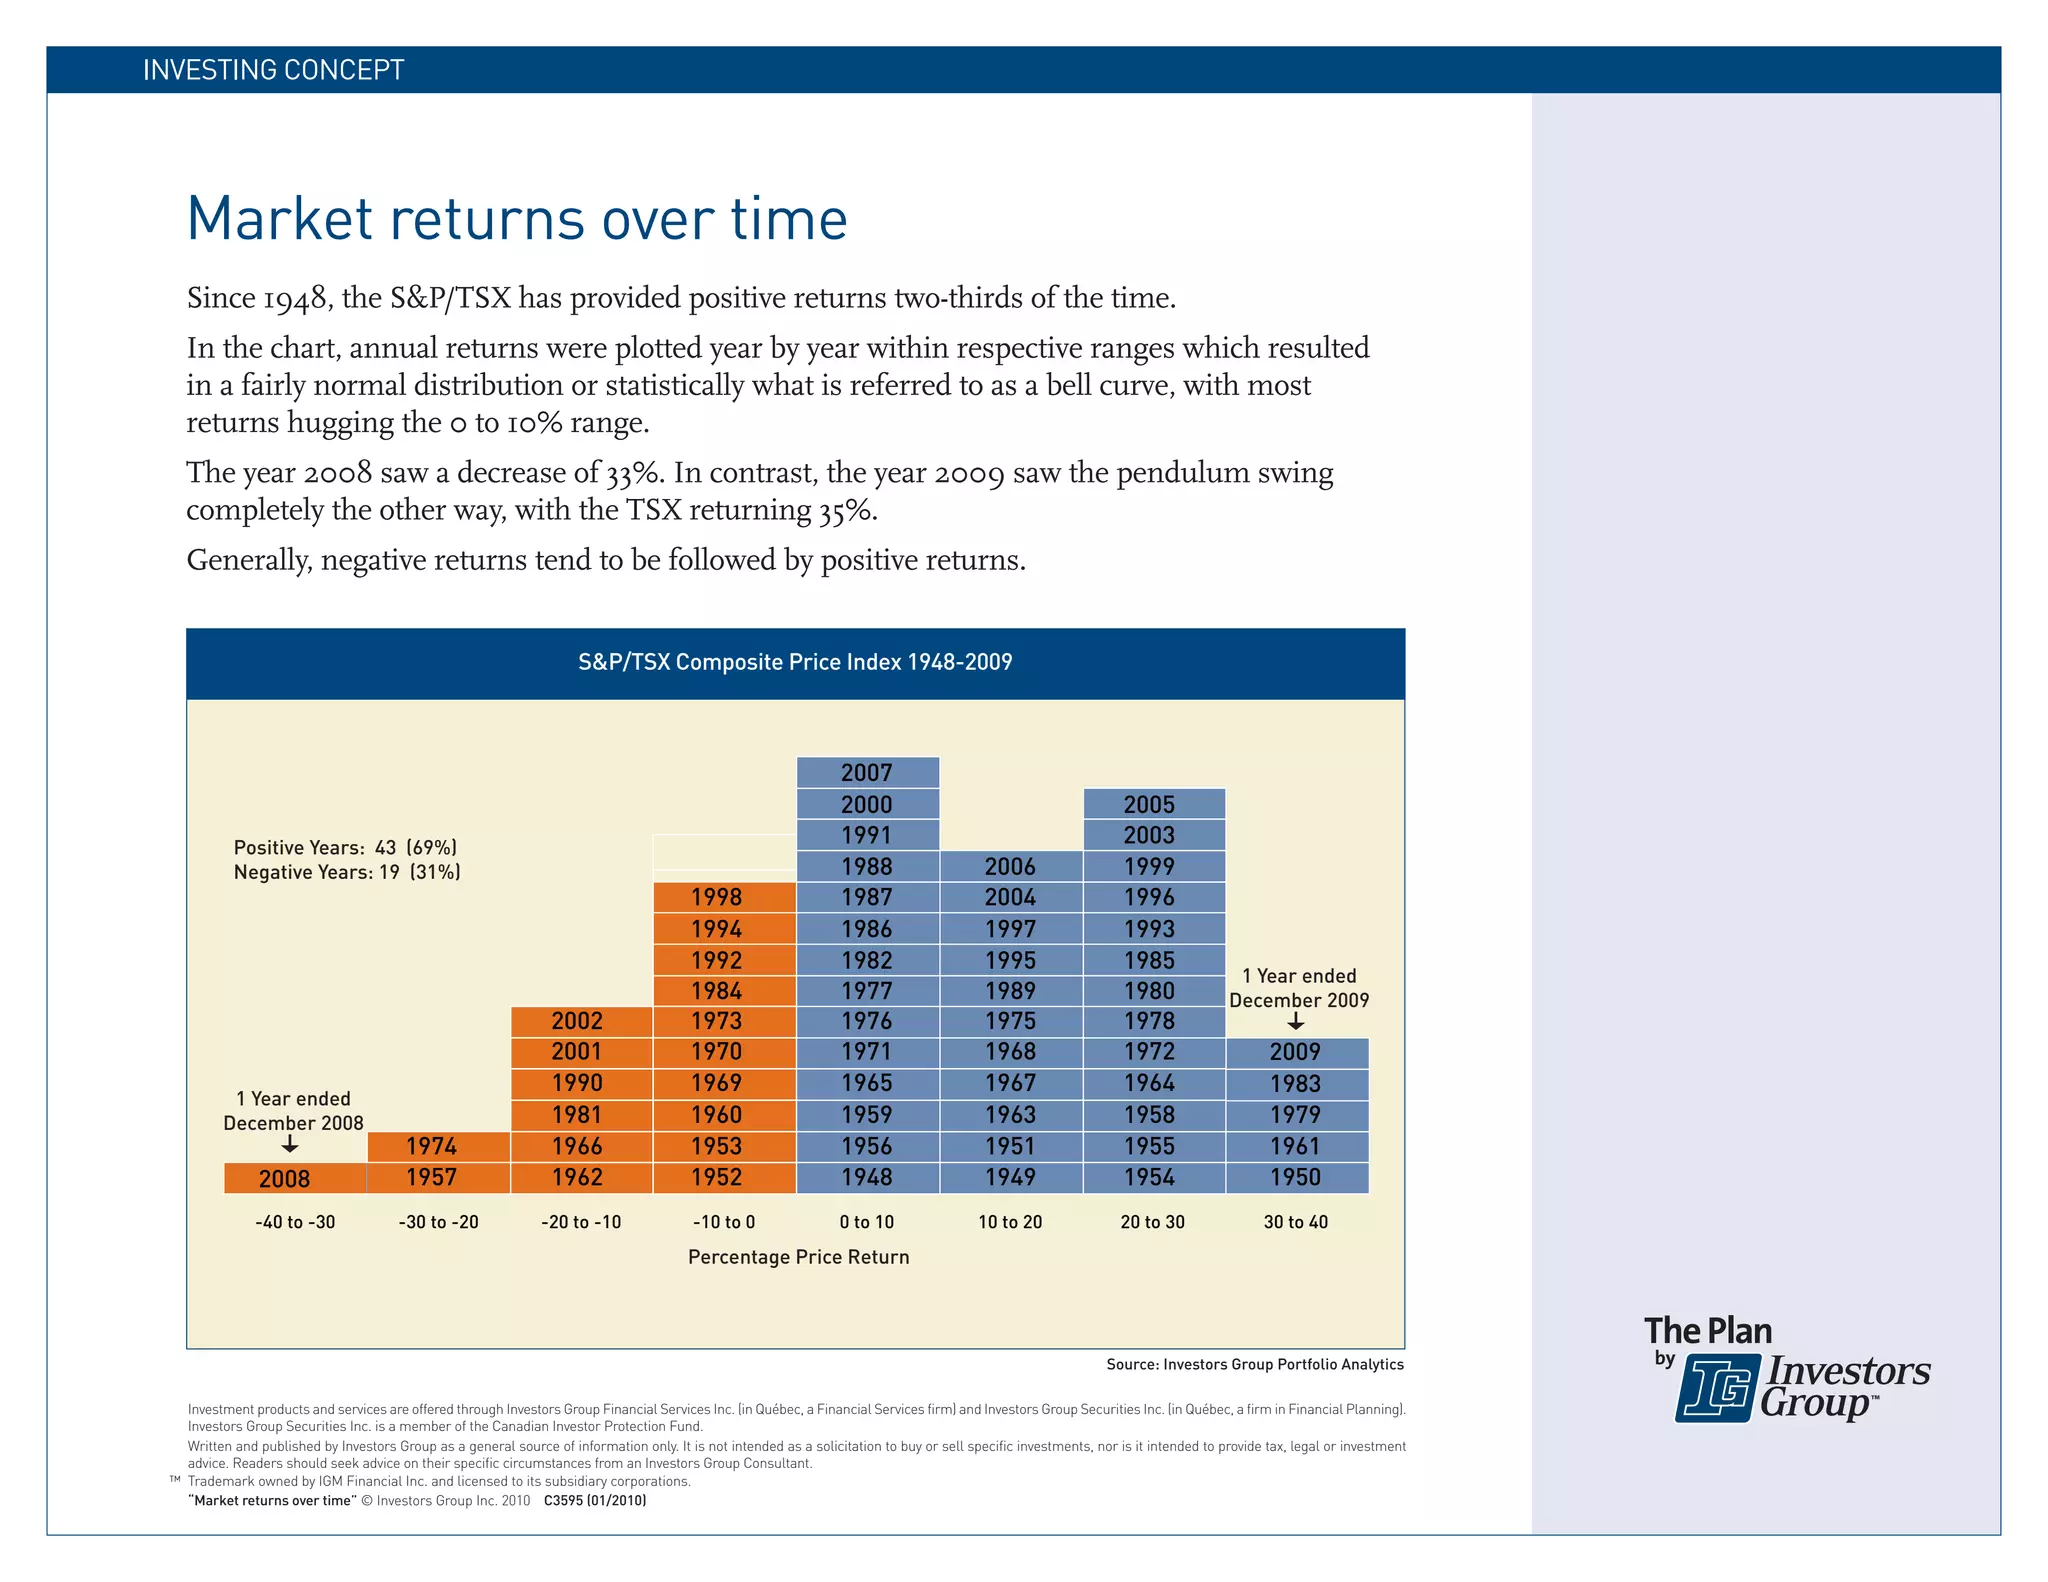
SlideShare a Scribd company logo
INVESTING CONCEPT


   Market returns over time
   Since 1948, the S&P/TSX has provided positive returns two-thirds of the time.
   In the chart, annual returns were plotted year by year within respective ranges which resulted
   in a fairly normal distribution or statistically what is referred to as a bell curve, with most
   returns hugging the 0 to 10% range.
   The year 2008 saw a decrease of 33%. In contrast, the year 2009 saw the pendulum swing
   completely the other way, with the TSX returning 35%.
   Generally, negative returns tend to be followed by positive returns.


                                                                       S&P/TSX Composite Price Index 1948-2009


                                                                                                                    2007
                                                                                                                    2000                                            2005
            Positive Years: 43 (69%)
                                                                                                                    1991                                            2003
            Negative Years: 19 (31%)                                                                                1988                    2006                    1999
                                                                                          1998                      1987                    2004                    1996
                                                                                          1994                      1986                    1997                    1993
                                                                                          1992                      1982                    1995                    1985
                                                                                                                                                                                       1 Year ended
                                                                                          1984                      1977                    1989                    1980              December 2009
                                                                  2002                    1973                      1976                    1975                    1978
                                                                  2001                    1970                      1971                    1968                    1972                     2009
                                                                  1990                    1969                      1965                    1967                    1964                     1983
           1 Year ended
          December 2008                                           1981                    1960                      1959                    1963                    1958                     1979
                                         1974                     1966                    1953                      1956                    1951                    1955                     1961
                2008                     1957                     1962                    1952                      1948                    1949                    1954                     1950
               -40 to -30               -30 to -20              -20 to -10                -10 to 0                 0 to 10                 10 to 20                20 to 30                 30 to 40
                                                                                         Percentage Price Return


                                                                                                                                                                 Source: Investors Group Portfolio Analytics

   Investment products and services are offered through Investors Group Financial Services Inc. (in Québec, a Financial Services firm) and Investors Group Securities Inc. (in Québec, a firm in Financial Planning).
   Investors Group Securities Inc. is a member of the Canadian Investor Protection Fund.
   Written and published by Investors Group as a general source of information only. It is not intended as a solicitation to buy or sell specific investments, nor is it intended to provide tax, legal or investment
   advice. Readers should seek advice on their specific circumstances from an Investors Group Consultant.
 ™ Trademark owned by IGM Financial Inc. and licensed to its subsidiary corporations.
   “Market returns over time” © Investors Group Inc. 2010 C3595 (01/2010)

More Related Content

Viewers also liked

N5308 elkins c_powerpoint_activity
N5308 elkins c_powerpoint_activityN5308 elkins c_powerpoint_activity
N5308 elkins c_powerpoint_activity
cae6728
 
stypendium
stypendiumstypendium
stypendium
ulikarp
 
创建同步化的精益供应链体系概述
创建同步化的精益供应链体系概述创建同步化的精益供应链体系概述
创建同步化的精益供应链体系概述haipeng56
 
Apresentação desafio nº3 pão
Apresentação desafio nº3 pãoApresentação desafio nº3 pão
Apresentação desafio nº3 pãonatercia.vieira
 

Viewers also liked (7)

Paradigmas emergentes
Paradigmas emergentesParadigmas emergentes
Paradigmas emergentes
 
MA Theology Cources taken
MA Theology Cources takenMA Theology Cources taken
MA Theology Cources taken
 
N5308 elkins c_powerpoint_activity
N5308 elkins c_powerpoint_activityN5308 elkins c_powerpoint_activity
N5308 elkins c_powerpoint_activity
 
stypendium
stypendiumstypendium
stypendium
 
创建同步化的精益供应链体系概述
创建同步化的精益供应链体系概述创建同步化的精益供应链体系概述
创建同步化的精益供应链体系概述
 
Apresentação desafio nº3 pão
Apresentação desafio nº3 pãoApresentação desafio nº3 pão
Apresentação desafio nº3 pão
 
02=os símbolos das profecias
02=os símbolos das profecias02=os símbolos das profecias
02=os símbolos das profecias
 

Similar to Market returns over time

Be Patient with the market report
Be Patient with the market reportBe Patient with the market report
Be Patient with the market reportfootball11
 
Producer and Industry Funding of R&D in Africa
Producer and Industry Funding of R&D in AfricaProducer and Industry Funding of R&D in Africa
Producer and Industry Funding of R&D in Africa
Agricultural Science & Technology Indicators (ASTI)
 
From Recession to Recovery to... What?
From Recession to Recovery to... What?From Recession to Recovery to... What?
From Recession to Recovery to... What?
Brent Reid
 
2003 Soa.Washington.Low Rate
2003 Soa.Washington.Low Rate2003 Soa.Washington.Low Rate
2003 Soa.Washington.Low Rate
pinchung
 
MMT Basics: You Cannot Consider the Deficit in Isolation
MMT Basics: You Cannot Consider the Deficit in IsolationMMT Basics: You Cannot Consider the Deficit in Isolation
MMT Basics: You Cannot Consider the Deficit in IsolationMitch Green
 
SIU AEC Aug 2011
SIU AEC Aug 2011 SIU AEC Aug 2011
SIU AEC Aug 2011 chaismart
 
SIU AEC aug 2011
SIU AEC aug 2011 SIU AEC aug 2011
SIU AEC aug 2011 chaismart
 
Web 2.0: La Nueva era de las Comunicaciones en los Negocios
Web 2.0: La Nueva era de las Comunicaciones en los NegociosWeb 2.0: La Nueva era de las Comunicaciones en los Negocios
Web 2.0: La Nueva era de las Comunicaciones en los Negocios
Mundo Contact
 
Crop Presentation (10.12.07)
Crop Presentation (10.12.07)Crop Presentation (10.12.07)
Crop Presentation (10.12.07)apulvermache
 
Erwin Rode on Prospects for Property
Erwin Rode on Prospects for PropertyErwin Rode on Prospects for Property
Erwin Rode on Prospects for Propertymoneyweb
 
Electoral Consequences of Unemployment Experiences
Electoral Consequences of Unemployment ExperiencesElectoral Consequences of Unemployment Experiences
Electoral Consequences of Unemployment ExperiencesThorsten Faas
 
03 05-13 ucan @ piedmont economics club
03 05-13 ucan @ piedmont economics club03 05-13 ucan @ piedmont economics club
03 05-13 ucan @ piedmont economics clubMatt Dunbar
 
Sorghum breeding for Improved productivity nutrition and INDUSTRIAL use
Sorghum breeding for Improved productivity nutrition and INDUSTRIAL useSorghum breeding for Improved productivity nutrition and INDUSTRIAL use
Sorghum breeding for Improved productivity nutrition and INDUSTRIAL use
RUFORUM
 
Social vulnerability to natural hazards in China
Social vulnerability to natural hazards in ChinaSocial vulnerability to natural hazards in China
Social vulnerability to natural hazards in China
Global Risk Forum GRFDavos
 
Freedom in the 50 States Pennsylvania Perspective
Freedom in the 50 States Pennsylvania PerspectiveFreedom in the 50 States Pennsylvania Perspective
Freedom in the 50 States Pennsylvania PerspectiveMercatus Center
 
Sensory marketing: the experience through the senses
Sensory marketing: the experience through the sensesSensory marketing: the experience through the senses
Sensory marketing: the experience through the senses
Pedro Ferreira
 
Session 6-5-chen-ying-prospects-and-challenges-for-sustainable-palm-oil-in-ch...
Session 6-5-chen-ying-prospects-and-challenges-for-sustainable-palm-oil-in-ch...Session 6-5-chen-ying-prospects-and-challenges-for-sustainable-palm-oil-in-ch...
Session 6-5-chen-ying-prospects-and-challenges-for-sustainable-palm-oil-in-ch...
ZSL Biodiversity & Palm Oil Platform
 
What is Just: Education, Excellence and Equity
What is Just: Education, Excellence and Equity What is Just: Education, Excellence and Equity
What is Just: Education, Excellence and Equity
Laurie Posner
 
André Bationo - Agricultural risks linked to soil, water and climate in Sub-S...
André Bationo - Agricultural risks linked to soil, water and climate in Sub-S...André Bationo - Agricultural risks linked to soil, water and climate in Sub-S...
André Bationo - Agricultural risks linked to soil, water and climate in Sub-S...Global Risk Forum GRFDavos
 

Similar to Market returns over time (20)

Be Patient with the market report
Be Patient with the market reportBe Patient with the market report
Be Patient with the market report
 
Producer and Industry Funding of R&D in Africa
Producer and Industry Funding of R&D in AfricaProducer and Industry Funding of R&D in Africa
Producer and Industry Funding of R&D in Africa
 
From Recession to Recovery to... What?
From Recession to Recovery to... What?From Recession to Recovery to... What?
From Recession to Recovery to... What?
 
2003 Soa.Washington.Low Rate
2003 Soa.Washington.Low Rate2003 Soa.Washington.Low Rate
2003 Soa.Washington.Low Rate
 
MMT Basics: You Cannot Consider the Deficit in Isolation
MMT Basics: You Cannot Consider the Deficit in IsolationMMT Basics: You Cannot Consider the Deficit in Isolation
MMT Basics: You Cannot Consider the Deficit in Isolation
 
SIU AEC Aug 2011
SIU AEC Aug 2011 SIU AEC Aug 2011
SIU AEC Aug 2011
 
SIU AEC aug 2011
SIU AEC aug 2011 SIU AEC aug 2011
SIU AEC aug 2011
 
Web 2.0: La Nueva era de las Comunicaciones en los Negocios
Web 2.0: La Nueva era de las Comunicaciones en los NegociosWeb 2.0: La Nueva era de las Comunicaciones en los Negocios
Web 2.0: La Nueva era de las Comunicaciones en los Negocios
 
Crop Presentation (10.12.07)
Crop Presentation (10.12.07)Crop Presentation (10.12.07)
Crop Presentation (10.12.07)
 
Erwin Rode on Prospects for Property
Erwin Rode on Prospects for PropertyErwin Rode on Prospects for Property
Erwin Rode on Prospects for Property
 
Electoral Consequences of Unemployment Experiences
Electoral Consequences of Unemployment ExperiencesElectoral Consequences of Unemployment Experiences
Electoral Consequences of Unemployment Experiences
 
03 05-13 ucan @ piedmont economics club
03 05-13 ucan @ piedmont economics club03 05-13 ucan @ piedmont economics club
03 05-13 ucan @ piedmont economics club
 
Sorghum breeding for Improved productivity nutrition and INDUSTRIAL use
Sorghum breeding for Improved productivity nutrition and INDUSTRIAL useSorghum breeding for Improved productivity nutrition and INDUSTRIAL use
Sorghum breeding for Improved productivity nutrition and INDUSTRIAL use
 
Social vulnerability to natural hazards in China
Social vulnerability to natural hazards in ChinaSocial vulnerability to natural hazards in China
Social vulnerability to natural hazards in China
 
Freedom in the 50 States Pennsylvania Perspective
Freedom in the 50 States Pennsylvania PerspectiveFreedom in the 50 States Pennsylvania Perspective
Freedom in the 50 States Pennsylvania Perspective
 
Sensory marketing: the experience through the senses
Sensory marketing: the experience through the sensesSensory marketing: the experience through the senses
Sensory marketing: the experience through the senses
 
Session 6-5-chen-ying-prospects-and-challenges-for-sustainable-palm-oil-in-ch...
Session 6-5-chen-ying-prospects-and-challenges-for-sustainable-palm-oil-in-ch...Session 6-5-chen-ying-prospects-and-challenges-for-sustainable-palm-oil-in-ch...
Session 6-5-chen-ying-prospects-and-challenges-for-sustainable-palm-oil-in-ch...
 
What is Just: Education, Excellence and Equity
What is Just: Education, Excellence and Equity What is Just: Education, Excellence and Equity
What is Just: Education, Excellence and Equity
 
Davos bationo full pc
Davos bationo full pcDavos bationo full pc
Davos bationo full pc
 
André Bationo - Agricultural risks linked to soil, water and climate in Sub-S...
André Bationo - Agricultural risks linked to soil, water and climate in Sub-S...André Bationo - Agricultural risks linked to soil, water and climate in Sub-S...
André Bationo - Agricultural risks linked to soil, water and climate in Sub-S...
 

Market returns over time

  • 1. INVESTING CONCEPT Market returns over time Since 1948, the S&P/TSX has provided positive returns two-thirds of the time. In the chart, annual returns were plotted year by year within respective ranges which resulted in a fairly normal distribution or statistically what is referred to as a bell curve, with most returns hugging the 0 to 10% range. The year 2008 saw a decrease of 33%. In contrast, the year 2009 saw the pendulum swing completely the other way, with the TSX returning 35%. Generally, negative returns tend to be followed by positive returns. S&P/TSX Composite Price Index 1948-2009 2007 2000 2005 Positive Years: 43 (69%) 1991 2003 Negative Years: 19 (31%) 1988 2006 1999 1998 1987 2004 1996 1994 1986 1997 1993 1992 1982 1995 1985 1 Year ended 1984 1977 1989 1980 December 2009 2002 1973 1976 1975 1978 2001 1970 1971 1968 1972 2009 1990 1969 1965 1967 1964 1983 1 Year ended December 2008 1981 1960 1959 1963 1958 1979 1974 1966 1953 1956 1951 1955 1961 2008 1957 1962 1952 1948 1949 1954 1950 -40 to -30 -30 to -20 -20 to -10 -10 to 0 0 to 10 10 to 20 20 to 30 30 to 40 Percentage Price Return Source: Investors Group Portfolio Analytics Investment products and services are offered through Investors Group Financial Services Inc. (in Québec, a Financial Services firm) and Investors Group Securities Inc. (in Québec, a firm in Financial Planning). Investors Group Securities Inc. is a member of the Canadian Investor Protection Fund. Written and published by Investors Group as a general source of information only. It is not intended as a solicitation to buy or sell specific investments, nor is it intended to provide tax, legal or investment advice. Readers should seek advice on their specific circumstances from an Investors Group Consultant. ™ Trademark owned by IGM Financial Inc. and licensed to its subsidiary corporations. “Market returns over time” © Investors Group Inc. 2010 C3595 (01/2010)