Downloaded 11 times


![wisdom [wiz-duh m]:
the ability to view more things
with a “blank slate.”
6](https://image.slidesharecdn.com/fall2017firstdivisionmeeting-170901121946/85/September-2017-Division-Meeting-6-320.jpg)


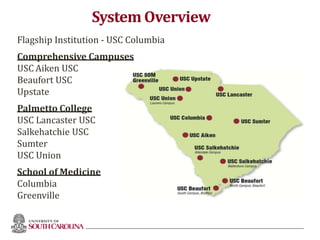


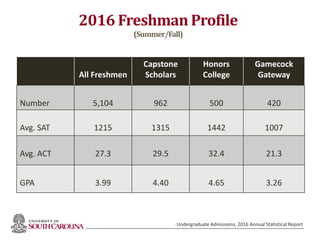


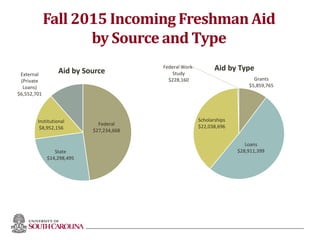


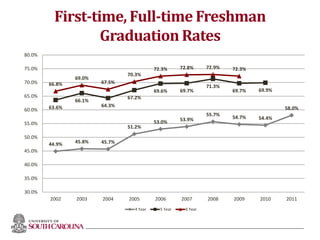
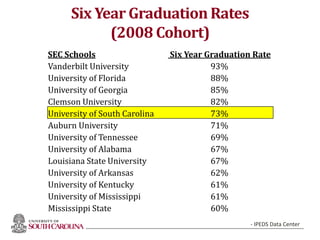


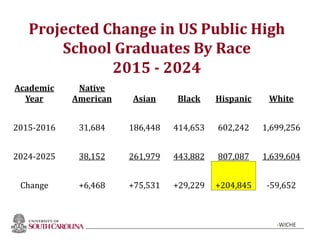


The document is the notes from a September 1, 2017 division meeting presented by Dr. Dennis Pruitt, Vice President for Student Affairs at the University. The summary includes: 1) An overview of the historical role of student affairs and how it has changed from an "in loco parentis" model to focusing on meaningful services, experiences and support to empower student success. 2) A discussion of the current state of the University's student body including enrollment numbers, demographics, academic profiles and graduation/retention rates which are increasing but still lag behind peer institutions. 3) Notes on national trends in higher education including increasing enrollment of women and students of color while white student numbers are projected to decline