Downloaded 14 times
![Mr. Shaha Rohit D Int. Journal of Engineering Research and Applications www.ijera.com
ISSN : 2248-9622, Vol. 5, Issue 5, ( Part -2) May 2015, pp.44-50
www.ijera.com 44 | P a g e
Vibration Analysis of deep groove ball bearing using Finite
Element Analysis
Mr. Shaha Rohit D*, Prof. S. S. Kulkarni**
*(Dept. of Mechanical Engg.SKN SCOE, Korti-Pandharpur, Maharashtra India)
** (2
Dept. of Mechanical Engg.SKN SCOE, Korti-Pandharpur, Maharashtra India)
ABSTRACT
Rolling element bearing is essential part of machinery. The rolling bearing, with outer ring fixed, is a multi body
mechanical system with rolling elements that transmit motion and load from the inner raceway to the outer
raceway. The rolling bearings dynamical behaviour analysis is an important condition to determine the machine
vibration response. Modern trend of Dynamic analysis is useful in early prediction. Dynamic analysis has
become a very powerful tool for the betterment of the actual performance of the system. The methodology for
prediction and validation of dynamic characteristics of bearing rotor system vibration is studied. ANSYS
software is the promising tools for the modelling. The result obtained from FEA are validated with experimental
results.
Keywords - deep groove ball Bearing, Outer race defects, Inner race defect, FFT analysis.
I. INTRODUCTION
The bearing type used in this study is a single row
deep groove ball bearing. They are the most popular
of all rolling bearing because it is non-separable,
capable of operating at high even very high speeds,
and require little maintenance in service. In addition
they have a price advantages. The bearing model 6204
from SKF is used in study. This bearing has a bore
diameter of 20 mm and widely used for many
applications.
Experimental modal analysis, structural dynamics
modification and finite element analysis is used to
analyze the dynamic properties of a test structure.
Most noise, vibration or failure problems in
mechanical structures and systems are caused by
excessive dynamic behavior. In recent years, however,
the implementation of the Fast Fourier Transform
(FFT) in low cost computer-based signal analyzers
has provided the environmental testing laboratory
with a fast and more powerful tool for acquisition and
analysis of vibration data.
The FFT spectrum analyzer samples the input
signal, computes the magnitude of its sine and cosine
components, and displays the spectrum of these
measured frequency components. The big advantage
of this technique is its speed. Because FFT spectrum
analyzers measure all frequency components at the
same time, the technique offers the possibility of
being hundreds of times faster than traditional
analogue spectrum analyzers.
Many research works had been done in the field
of signal analysis in rolling element bearing. Amit R
Patel [1] in this paper Test rig for vibration
monitoring of bearing have been designed. The design
of test rig includes design of Shaft, Bearing selection,
pedestal selection, motor selection, and base
preparation. A 3-D model have been developed using
Pro-engineer modeling software. The vibration signals
generated by the healthy/faulty bearing can be
captured by the accelerometer mounted on the test
bearing. The analysis of the vibration signal is useful
for the condition monitoring of rolling element
bearings. Abhay Utpat [2] in this paper, the study of
failure analysis of ball bearing is discussed by creation
of artificial cracks of different sizes on various
elements and noting down its signatures. The work
has been extended with Finite Element Analysis of
bearing with artificial defects to study the peaks at its
outer ring as well as inner ring defect frequencies. It is
concluded that at constant defect size and constant
load with different speeds of rotation, amplitudes of
vibration varies with increase in speed. In this case
also amplitudes of vibration are observed higher for
outer ring defected bearings than inner ring defected
bearings for same defect size. U. A. Patel, Shukla
Rajkamal [3] in this paper modern trend of dynamic
analysis is used for prediction. PRO-E and ANSYS
software are used for the modeling and model analysis
of the bearing rotor system.Experiment result has
been taken for the analysis of the signal that has been
obtained through the use of FFT analyser. Defect size
was 0.02 mm3 was studied and the different plots in
terms of acceleration and displacement amplitude
were generated both in the experiment and FEA
software ANSYS 12. The result was almost same in
both. M.S. Patil, Jose Mathew, [4] in this paper work
is focused towards the development of a theoretical
model to study the effect of defect size on bearing
vibration. The model makes it possible to detect the
frequency spectrum having peaks at the bearing defect
RESEARCH ARTICLE OPEN ACCESS](https://image.slidesharecdn.com/f505024450-150511084244-lva1-app6891/75/Vibration-Analysis-of-deep-groove-ball-bearing-using-Finite-Element-Analysis-1-2048.jpg)
![Mr. Shaha Rohit D Int. Journal of Engineering Research and Applications www.ijera.com
ISSN : 2248-9622, Vol. 5, Issue 5, ( Part -2) May 2015, pp.44-50
www.ijera.com 45 | P a g e
frequencies. The amplitudes at these frequencies are
also predicted. He developed a mathematical model
for the ball bearing vibrations due to defect on the
bearing race. N. Tandon , A. Choudhury, [7] a review
of vibration and acoustic measurement methods for
the detection of defects in rolling element bearings is
presented in this paper. This paper include detection
of both localized and distributed categories of defect,
explanation for the vibration and noise generation,
Vibration measurement in both time and frequency
domains along with signal processing techniques such
as the high-frequency resonance technique, acoustic
measurement techniques such as sound pressure,
sound intensity and acoustic emission. Dennis H.
Shreve [8] this paper is considers the various data
collection setup parameters and tradeoffs in acquiring
fast, meaningful vibration data to perform accurate
analysis in the field of predictive maintenance. The
intent of this paper is to focus on the internal signal
processing path, and how it relates to the ultimate
root-cause analysis of the original vibration problem.
An understanding of these basic concepts in signal
processing and data manipulation will enable one to
select instrumentation and to understand its use.
This paper consists of finite element modeling and
analysis of healthy bearing and defective bearing.
Modeling is a complex task for designing a bearing
because in the modeling of bearing various types of
joints should be applied at the design stage which is
very complex. In defective bearing, defect is created
on inner race and outer race. Amplitudes of
acceleration are obtained for different defect size by
varying rotational speed. At the last, amplitude vs.
frequency graphs are obtained to know the results.
Also results of experimentation are benchmarked
through finite element analysis.
II. FINITE ELEMENT ANALYSIS
2.1Finite element modeling
FEA has been carried out by using ANSYS 14
package. Initially 6204 bearing model are drawn in
CATIA software and these have been imported to
ANSYS software. Defect at inner race and outer race
are created in ANSYS itself.
In pre-processor menu, there are five cases taken
into consideration for analysis in order to validate
results of each case. Following are the cases of
simulation,
1) Healthy bearing
2) (1×0.25) mm inner race defect
3) (1×0.5) mm inner race defect
4) (1×0.25) mm outer race defect
5) (1×0.5) mm outer race defect
While modeling each case, shell 163 element has
been used with element edge length 2mm. Because
shell element is suitable for curved shape component
as well as rotating component. In order to get good
results, shell element is used in rotating component.
In order to define bearing model assembly of
three components is made those are, inner race, balls,
outer race. These components are made of nodes. It
means that each component is defined as a group of
nodes.
Analysis has been carried in ANSYS EXPLICIT
LS-DYNA. 3D dynamic analysis is done so as to get
better response of the bearing. Results are obtained in
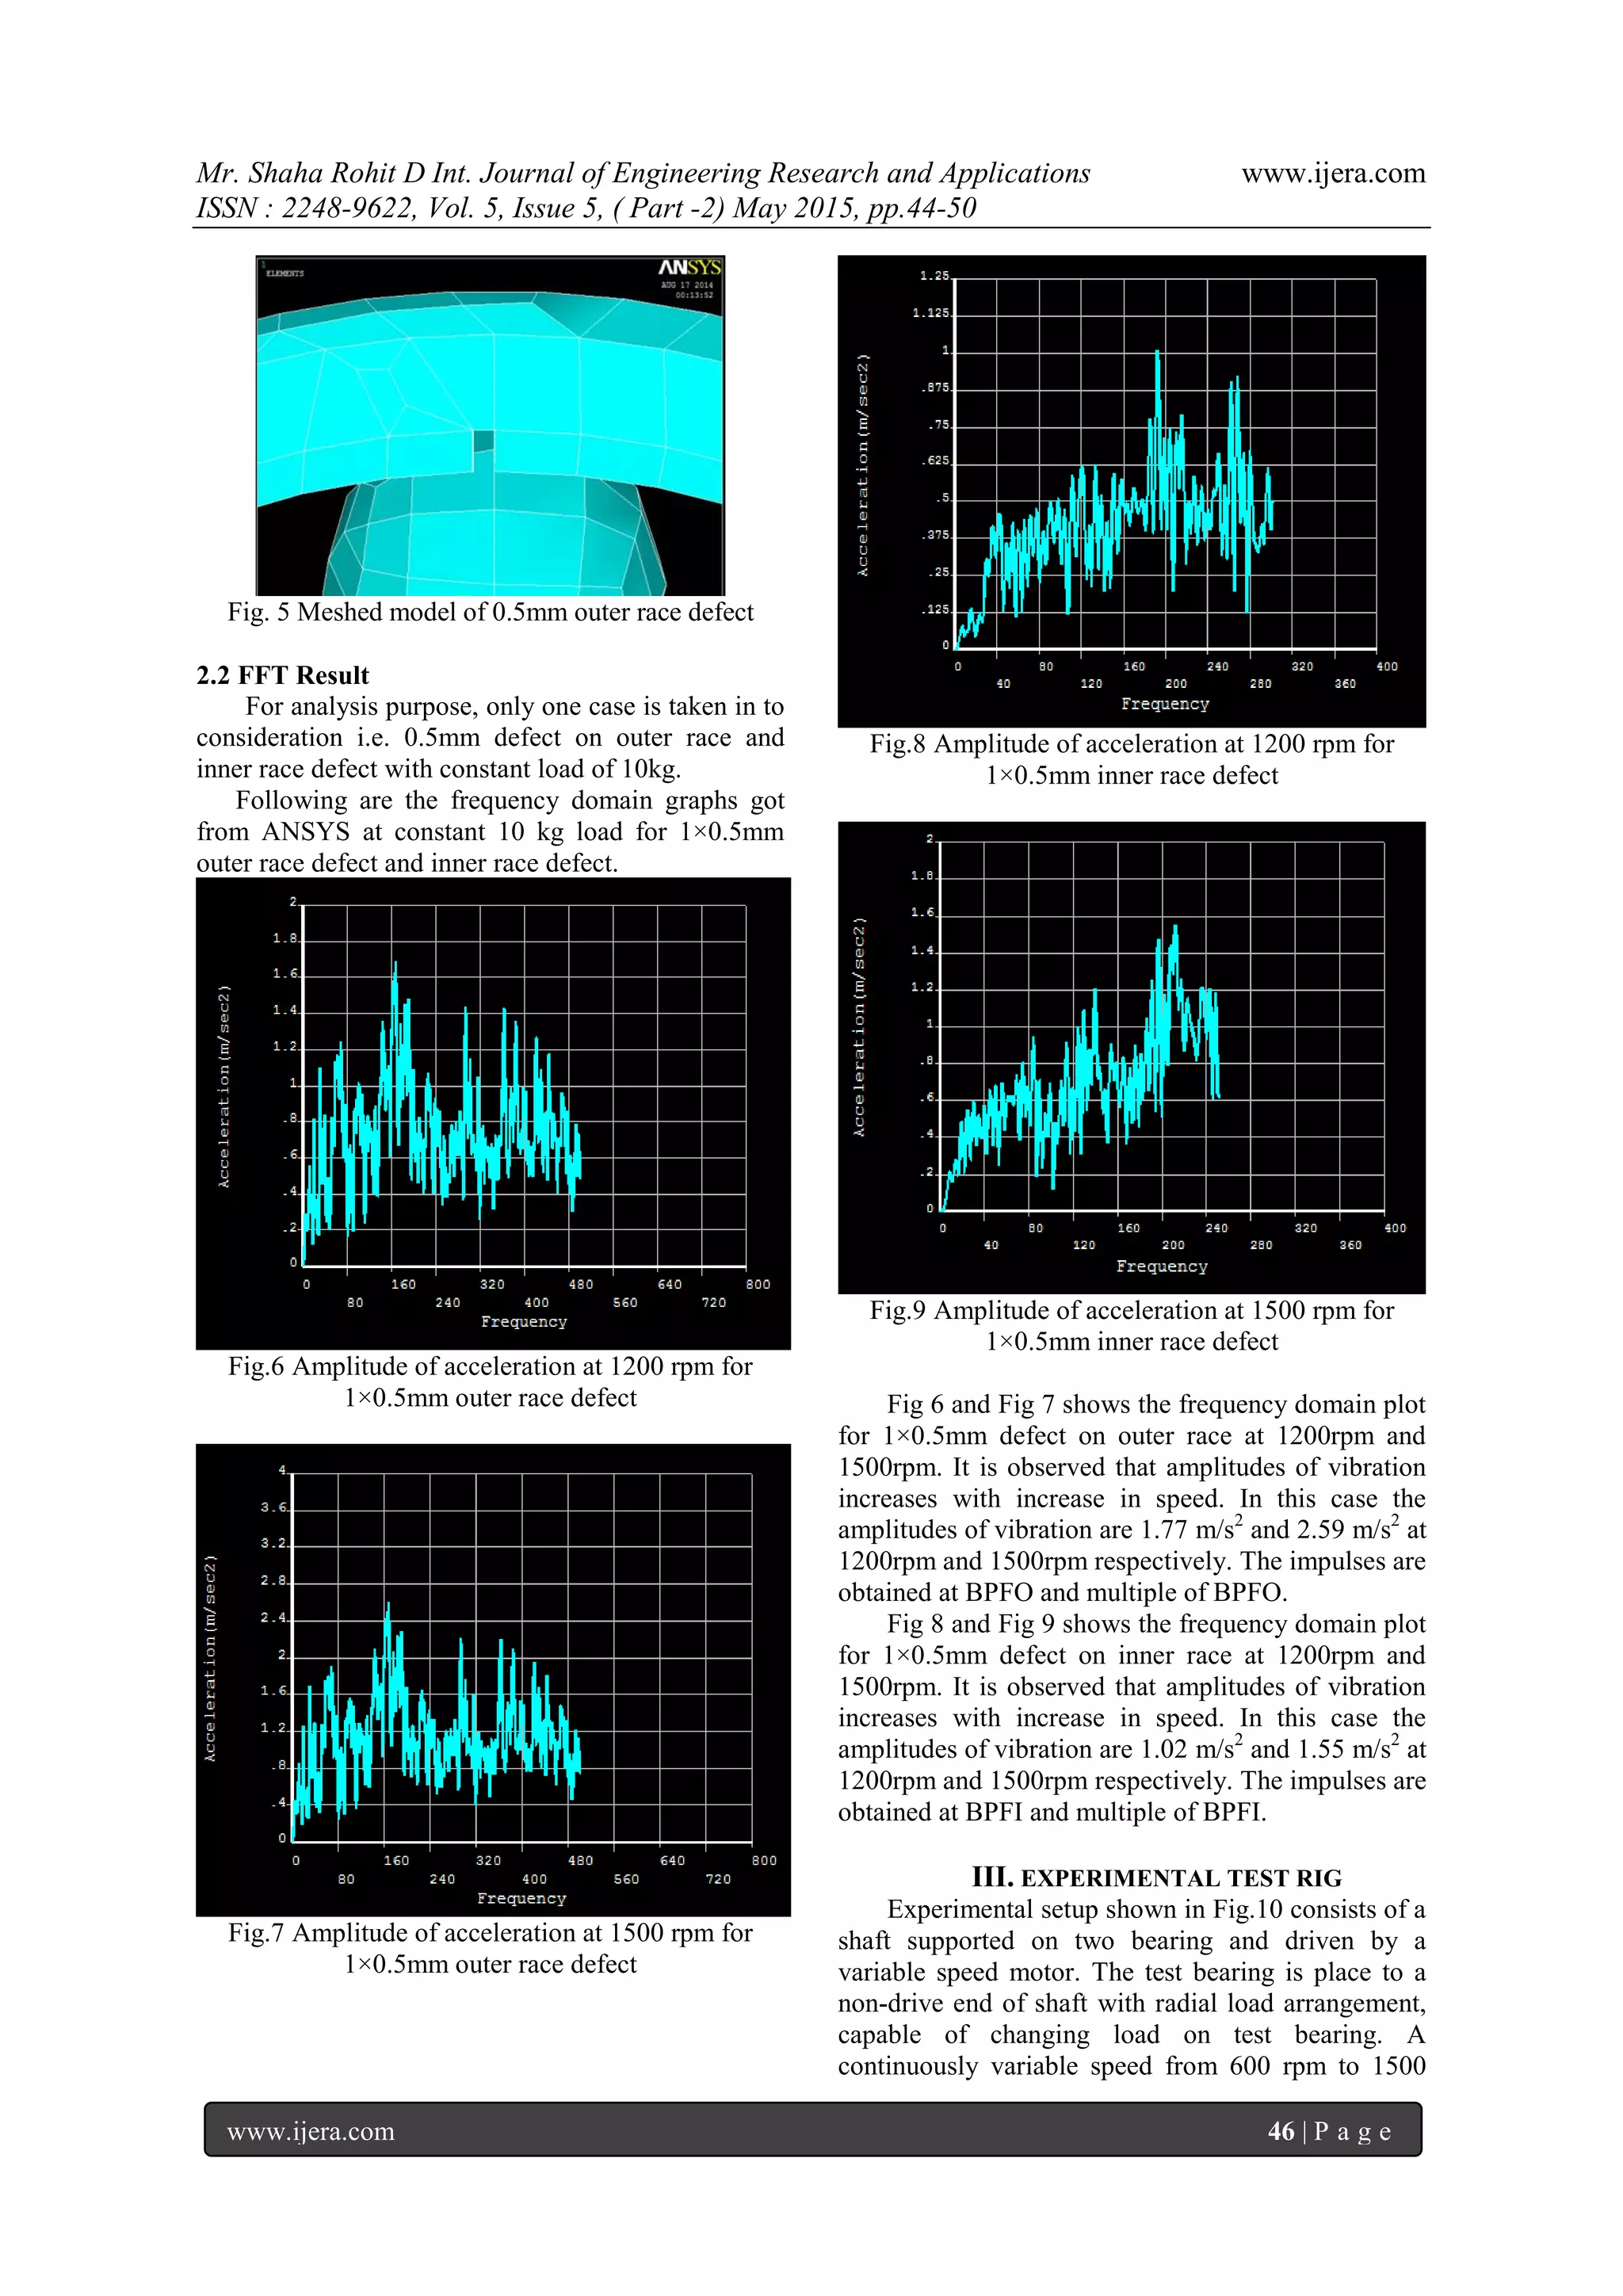
frequency domain. Following figures shows meshed
model of each case individually.
Fig.1Meshed models of healthy bearings
Fig. 2 Meshed model of 0.25mm inner race defect
Fig. 3 Meshed model of 0.5mm inner race defect
Fig. 4 Meshed model of 0.25mm outer race defect](https://image.slidesharecdn.com/f505024450-150511084244-lva1-app6891/75/Vibration-Analysis-of-deep-groove-ball-bearing-using-Finite-Element-Analysis-2-2048.jpg)
![Mr. Shaha Rohit D Int. Journal of Engineering Research and Applications www.ijera.com
ISSN : 2248-9622, Vol. 5, Issue 5, ( Part -2) May 2015, pp.44-50
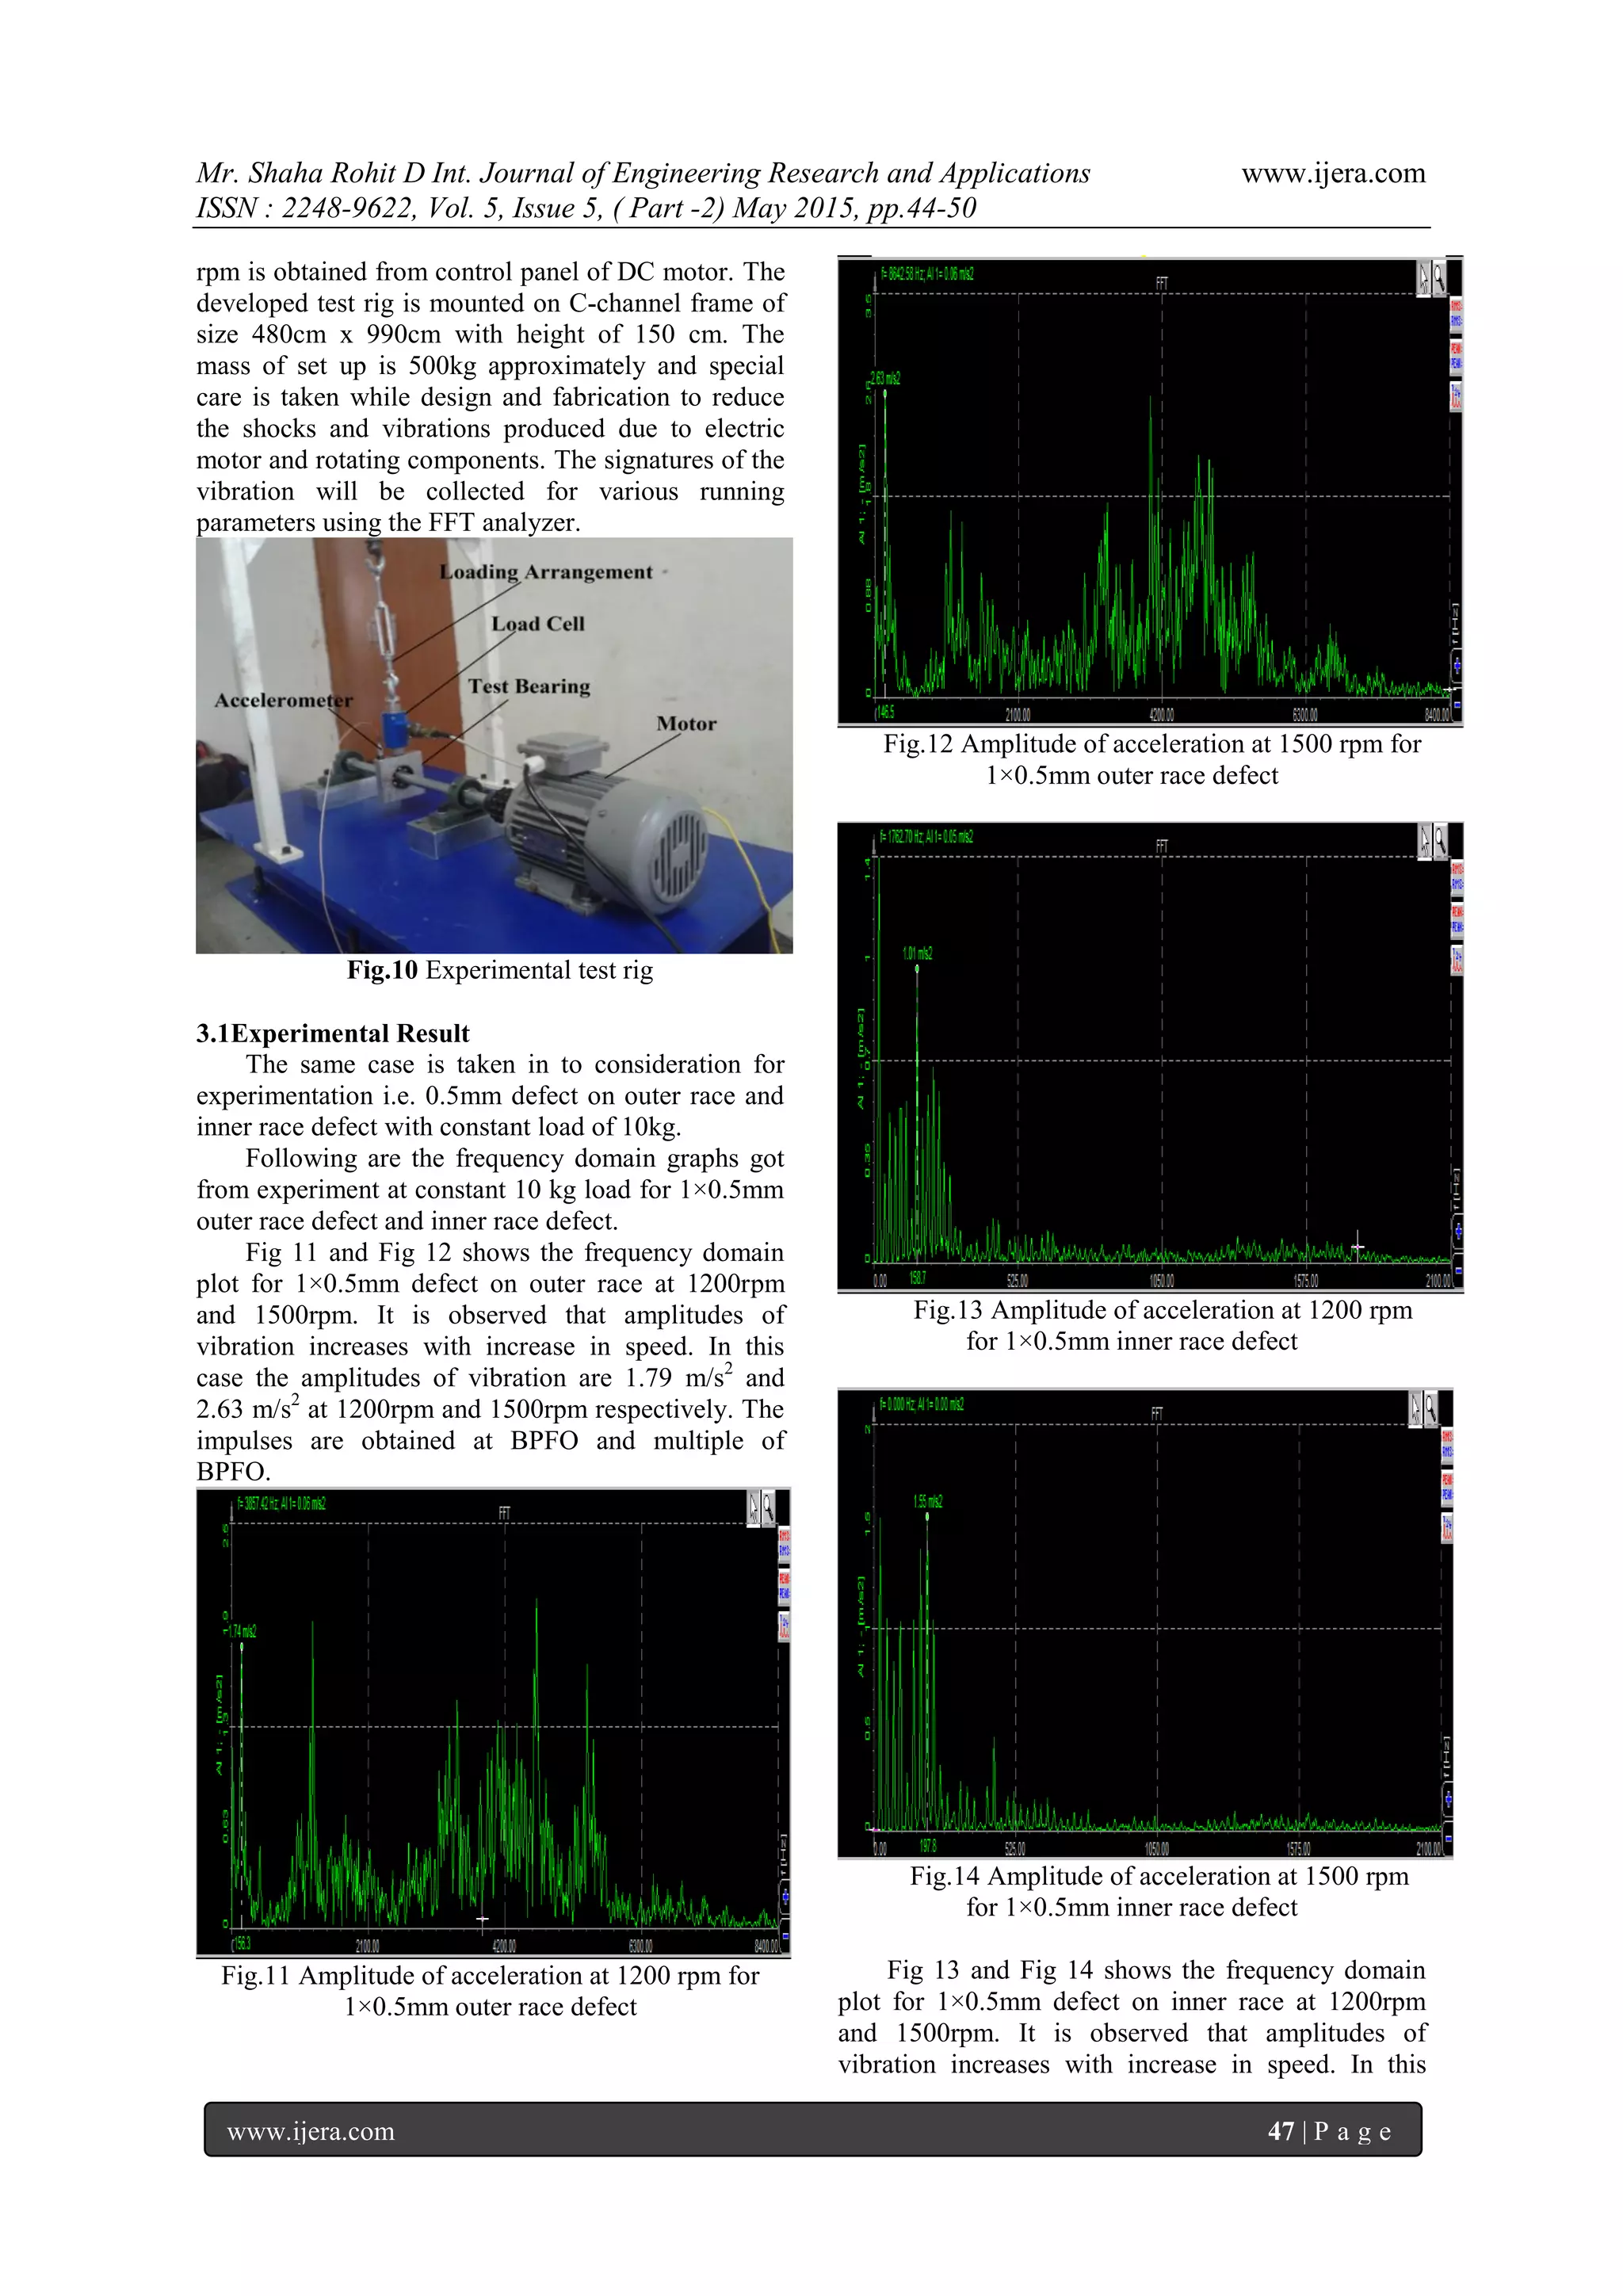
www.ijera.com 49 | P a g e
Fig. 16 Graph of Speed vs. amplitude for 1×0.5 inner
race defect at 10kg
From table 2 and 3 it is observed that amplitude
of outer race defect is more than that of inner race
defect. Also deviation in frequency occurs due to
uncontrolled parameters during experimentation. As
amplitude changes with respect to frequency also it
changes from node to node. Here, nodes on the
surface of bearing are picked up to get the result.
Also due to birth death of element, large deviation
occurs in frequency.
V. CONCLUSION
The proposed simulation method is used to
determine the vibration signal response for various
shaft speeds and loading condition, which is
compared with experimental result. It is found
simulated vibration pattern has similar characteristic
compare to experimental results. The deviation in
amplitude of acceleration is may be due to variation
of mesh density in the region near to defect and also
deviation in frequency occurs due to uncontrolled
parameters during experimentation.
It is observed that as the speed increases the peak
amplitude values (m/s2
) gradually increases for
constant load. Also the peak amplitude values (m/s2
)
for healthy bearing are smaller than defective
bearing.
It is found that the amplitude values for the case
of outer race defect are more than that for the inner
race defect. It is because of defect present on the
outer race is remained in the load zone at maximum
position as in second case, inner race moves in and
out of the load zone during each revolution of the
shaft. The strong fault vibration spectrum produced
while the defect is in the load zone and weaker fault
vibration spectrum produced while the defect is
outside the load zone.
Acknowledgements
I owe a great many thanks to a many people who
helped and supported me during mine dissertation
work, from bottom of my heart.
REFERENCES
[1] R Patel, “Development of Test Rig for
Vibration Monitoring of Bearing” GIT-
Journal of Engineering and Technology,
vol-6, 2013, ISSN 2249 - 6157.
[2] Abhay utpat “Vibration signature analysis
of defective deep groove ball bearing by
numerical and experimental approach”
International Journal of scientific &
Engineering Research, volume 4, issue 6,
June 2013
[3] U. A. Patel, Shukla Rajkamal “Vibrational
analysis of self align ball bearing having a
local defect through FEA and its validation
through experiment” International Journal
of modern engineering research, vol 2, issue
3, May-June 2012 pp. 1073-1080.
[4] M.S. Patil, P.K. Rajendrakumar, Sandeep
Desai,” A theoretical model to predict the
effect of localized defect on vibration
associated with ball bearing”, Int journal 17
May 2010.
[5] ZekiKıral_, HiraKaragulle“Vibration
analysis of rolling element bearings with
various defects under the action of an
unbalanced force” Mechanical Systems and
Signal Processing 20 (2006) pp.1967–1991.
[6] Orhan S. “Vibration monitoring for defect
diagnosis of rolling element bearing as a
predictive maintenance tool: Comprehensive
case studies” International, Vol 39, 2006,
pp. 293-298.
[7] N. Tandon , A. Choudhury “A review of
vibration and acoustic measurement
methods for the detection of defects in
rolling element bearings” Tribology
International 32 (1999)pp. 469–480.
[8] Dennis H. Shreve “Signal processing for
effective vibration analysis” IRD
Mechanalysis, Inc Columbus, Ohio
November 1995.
[9] McFadden PD, Smith JD. Model for the
vibration produced by a single point defect
in a rolling element bearing. Journal of
Sound and Vibration 1984;96(1):69–82.
[10] Gupta PK. Dynamics of rolling element
bearings Part II: ball bearing analysis.
Journal of Lubrication Technology
Transactions of the ASME 1979;101:305–
11.
[11] Rolling Element Analysis Book of Tedric A.
Yong-Han Harris
[12] V.B.Bhandari, “Design of Machine
Elements” TATA Mc-Graw-Hill
Publications, second edition, (2007) pp.124-
127.
[13] R S Khurmi, J K Gupta “Theory of Machine
Elements” S Chand Publications.](https://image.slidesharecdn.com/f505024450-150511084244-lva1-app6891/75/Vibration-Analysis-of-deep-groove-ball-bearing-using-Finite-Element-Analysis-6-2048.jpg)

This document discusses the vibration analysis of deep groove ball bearings using finite element analysis (FEA) to understand their dynamic behavior and predict potential failures. It includes a comparison between experimental results and FEA findings, highlighting how defect size and rotational speed affect vibration amplitude. The study utilizes ANSYS software for modeling and employs various methodologies, including FFT analysis, to validate the results.