Downloaded 134 times

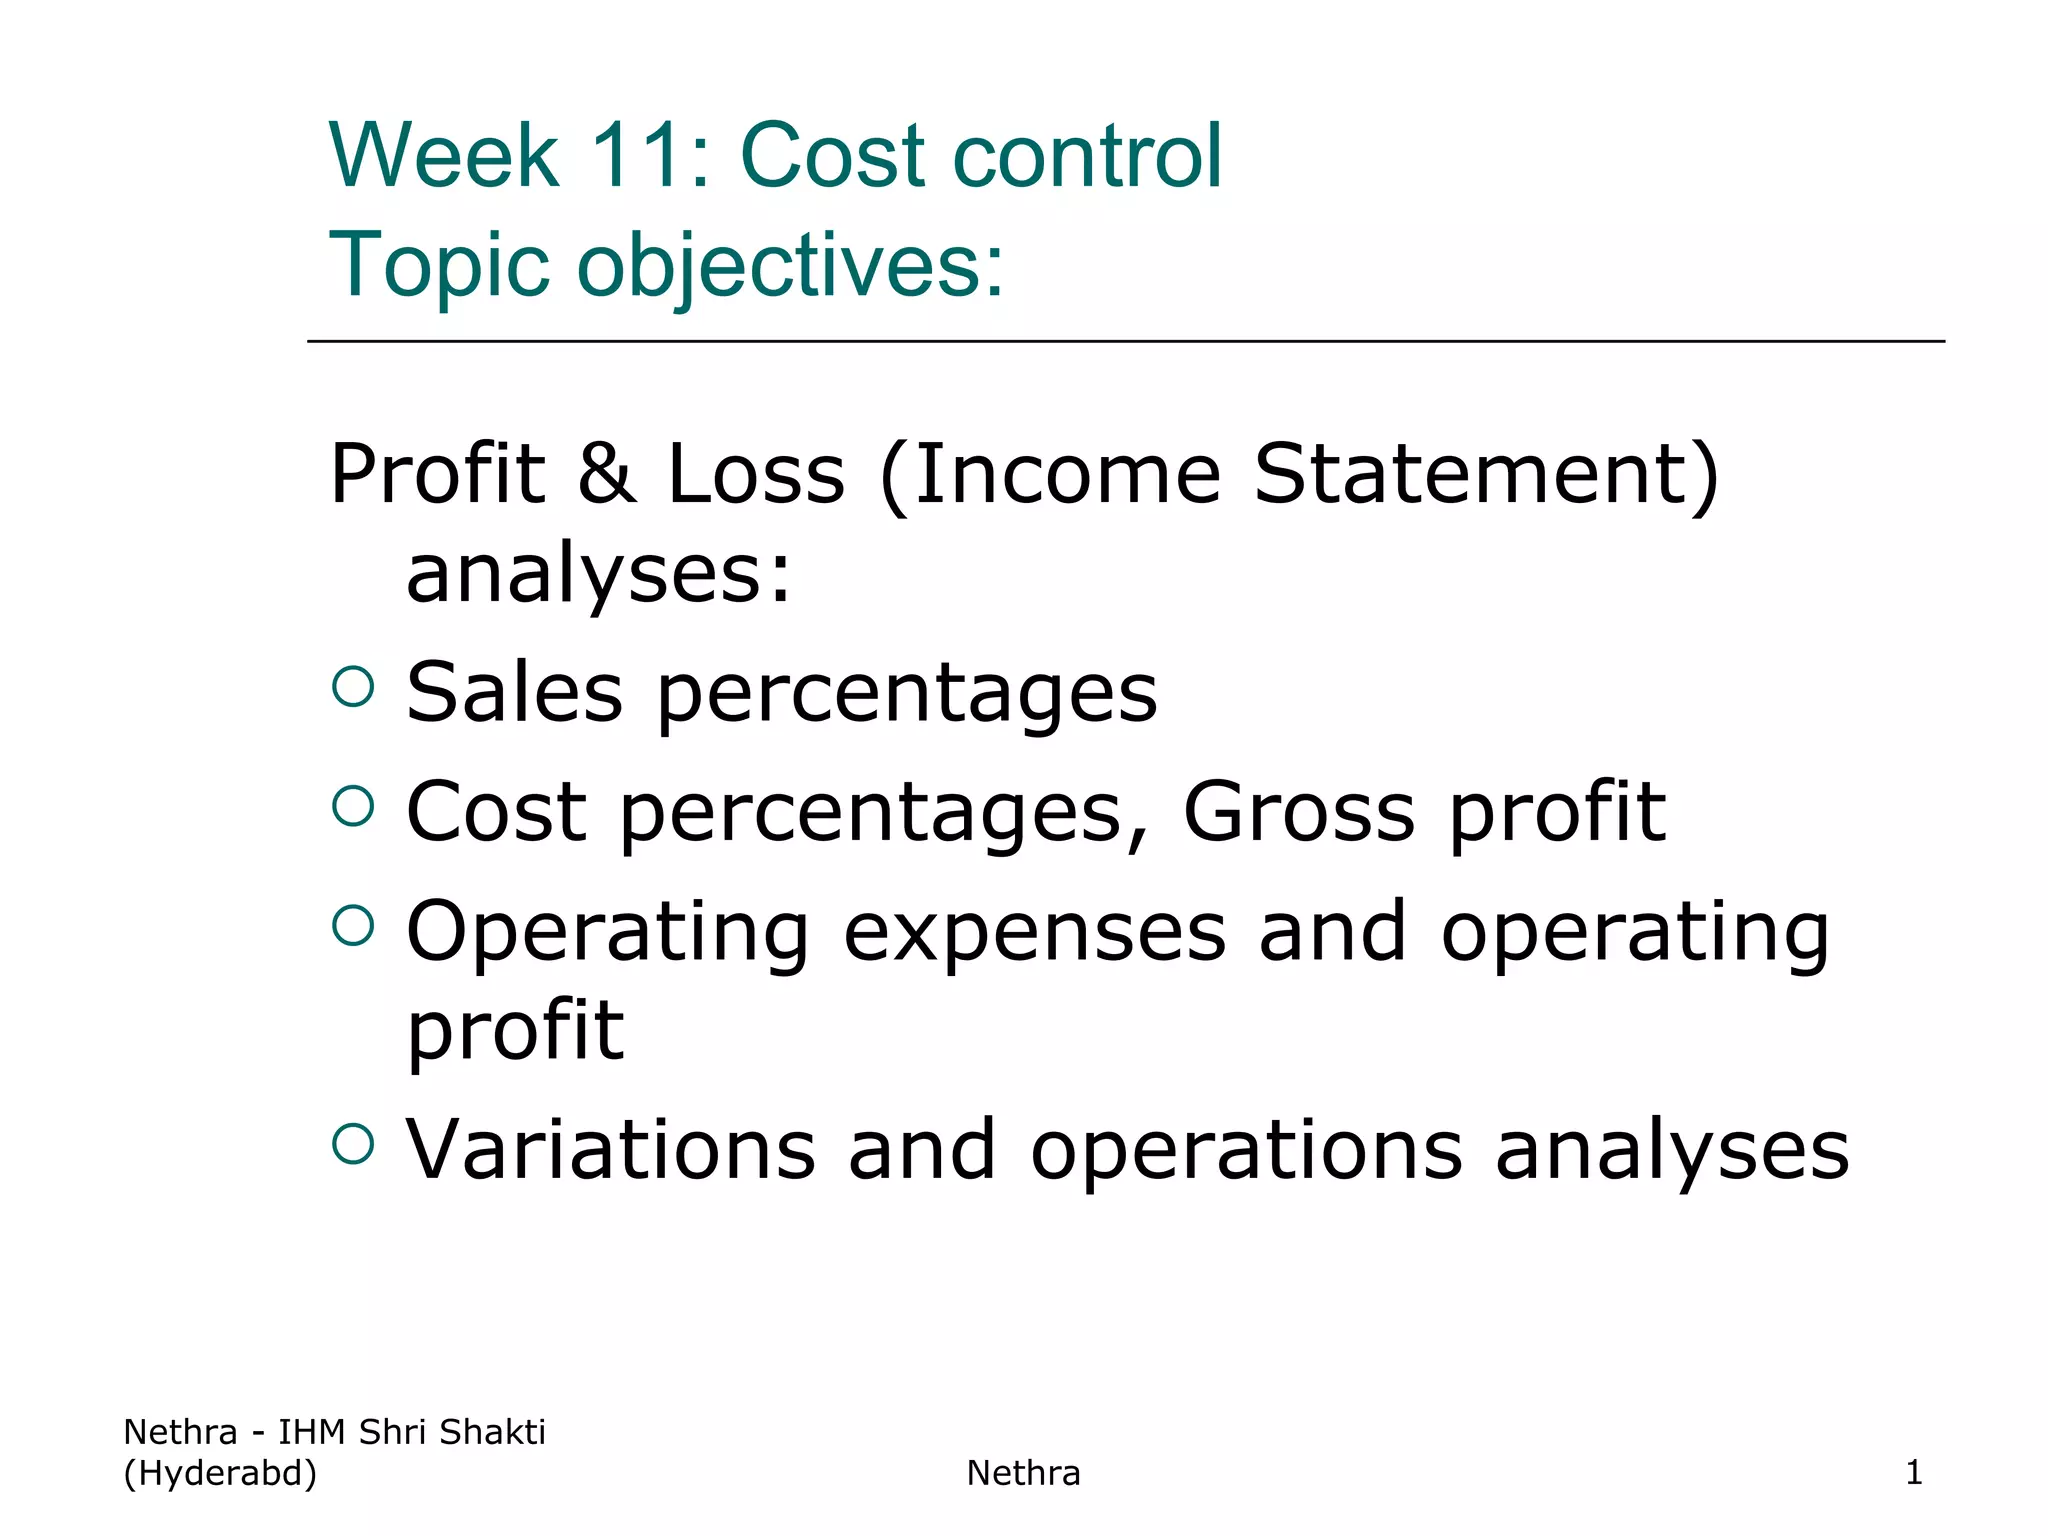
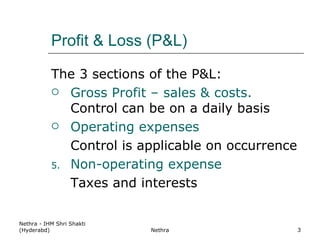
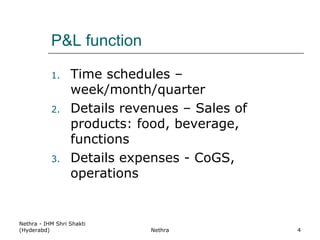
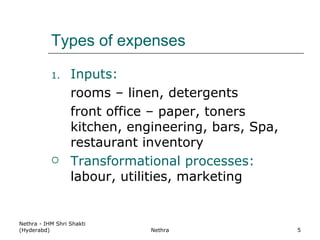
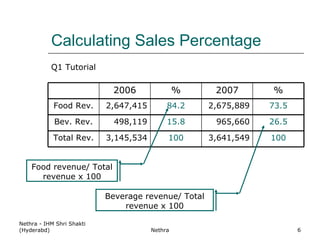
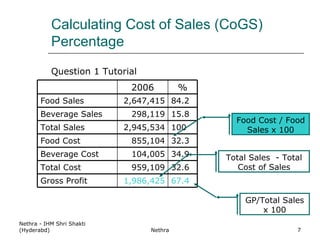
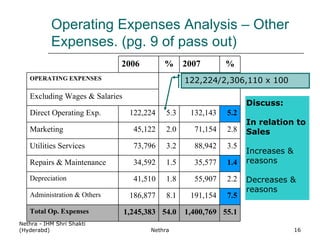
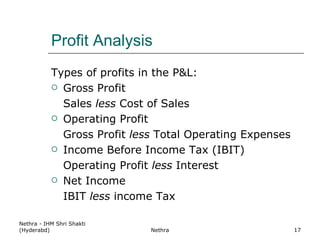
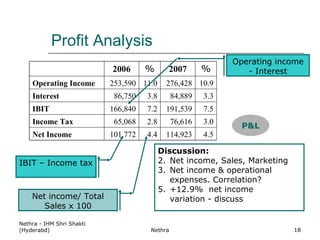
The document discusses profit and loss (P&L) analysis and cost control. It covers the three sections of a P&L statement - gross profit, operating expenses, and operating profit. It also discusses calculating various percentages like sales, costs of goods sold, and analyzing expenses, inventory, labor costs, other operating expenses, and net profit in order to understand operations and control costs. The goal is to use P&L analysis as a tool to understand operations and identify areas for cost control and improvement.