Downloaded 604 times

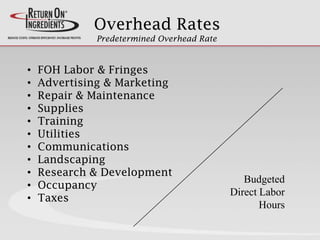
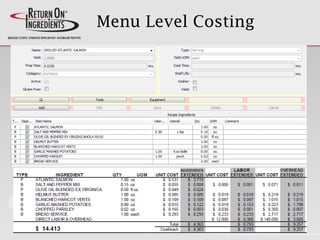
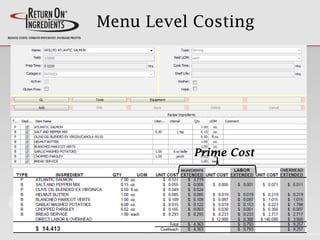
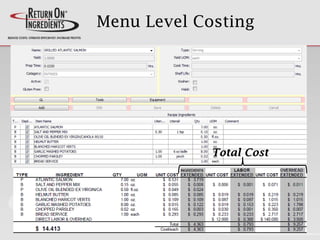
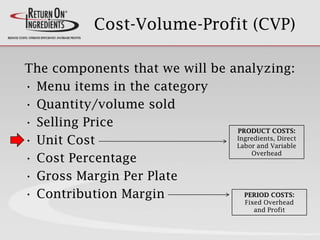
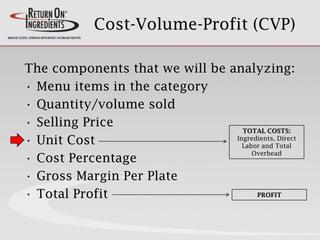

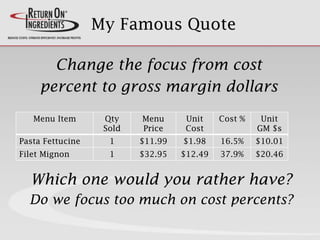
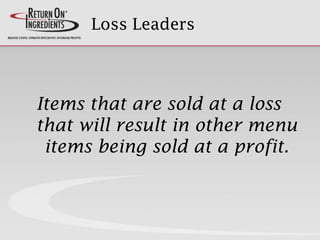
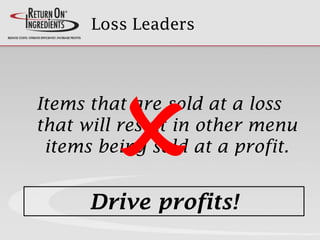
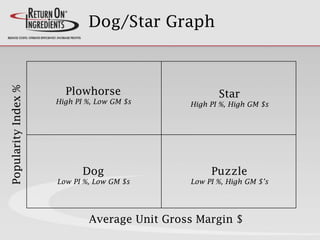
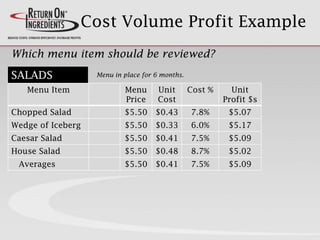
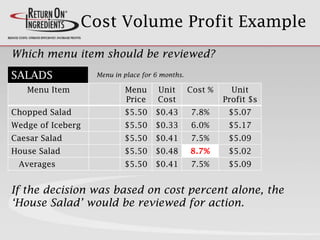
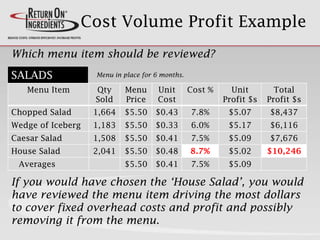
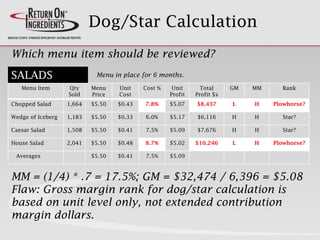
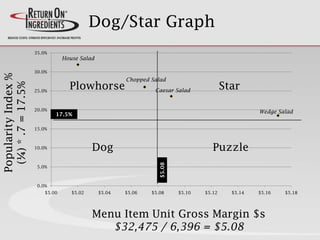
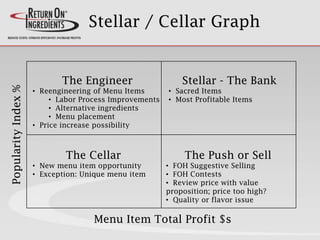
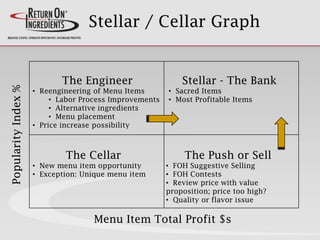
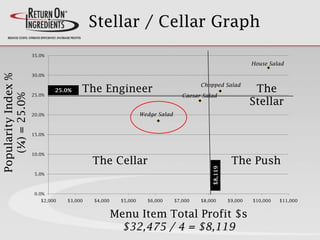
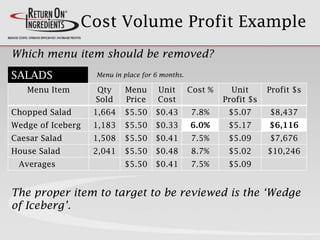
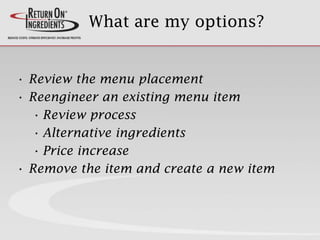
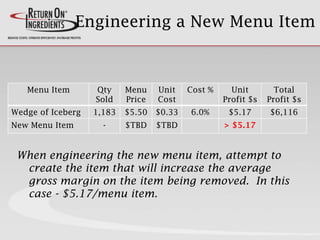
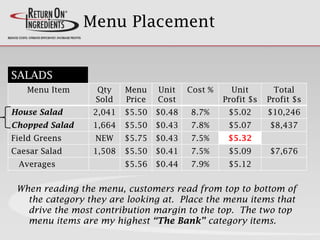


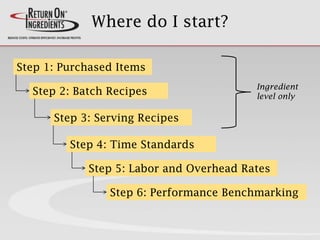
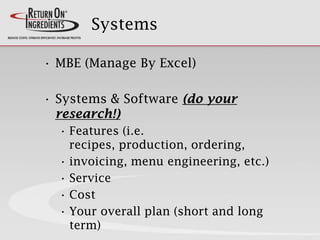
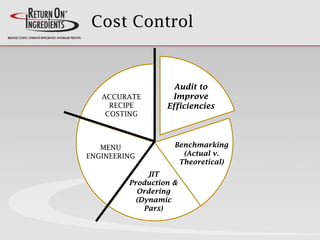
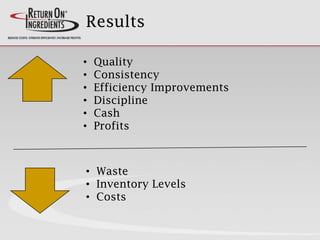


The presentation focuses on effective menu engineering for food and beverage businesses, emphasizing the importance of accurate recipe costing, portion control, and overhead management to optimize profitability. It outlines methods for analyzing menu items through cost-volume-profit analysis and advocates for pricing strategies based on gross margin rather than just cost percentages. Key concepts include recognizing loss leaders, optimizing menu placement for better sales, and continuous efficiency improvements in menu item offerings.


