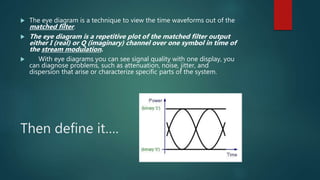
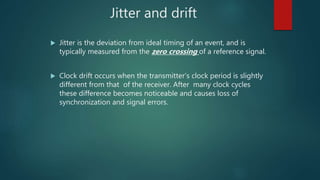
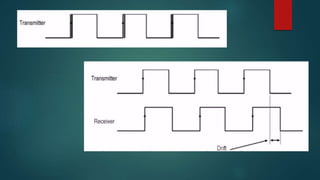
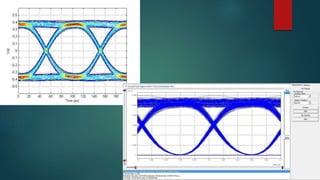
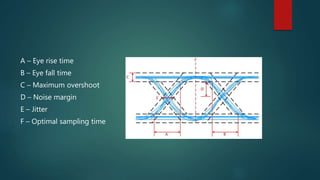
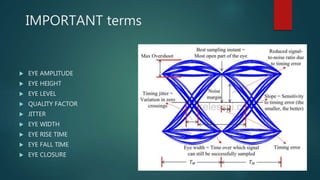
Eye diagram
Then define it….
 The eye diagram is a technique to view the time waveforms out of the
matched filter.
 The eye diagram is a repetitive plot of the matched filter output
either I (real) or Q (imaginary) channel over one symbol in time of
the stream modulation.
 With eye diagrams you can see signal quality with one display, you
can diagnose problems, such as attenuation, noise, jitter, and
dispersion that arise or characterize specific parts of the system.
Jitter and drift
 Jitter is the deviation from ideal timing of an event, and is
typically measured from the zero crossing of a reference signal.
 Clock drift occurs when the transmitter’s clock period is slightly
different from that of the receiver. After many clock cycles
these difference becomes noticeable and causes loss of
synchronization and signal errors.
A – Eye rise time
B – Eye fall time
C – Maximum overshoot
D – Noise margin
E – Jitter
F – Optimal sampling time
Closure
point
Logic level
“High” or “1”
Logic level
“Low” or “0”
PAM2 ( 1 bit data)
PAM4 (4 bit data)
Steps involved in calculating eye
diagram
IMPORTANT terms
 EYE AMPLITUDE
 EYE HEIGHT
 EYE LEVEL
 QUALITY FACTOR
 JITTER
 EYE WIDTH
 EYE RISE TIME
 EYE FALL TIME
 EYE CLOSURE
Thank you….

Eye diagram in Communication

  • 1.
  • 2.
    Then define it…. The eye diagram is a technique to view the time waveforms out of the matched filter.  The eye diagram is a repetitive plot of the matched filter output either I (real) or Q (imaginary) channel over one symbol in time of the stream modulation.  With eye diagrams you can see signal quality with one display, you can diagnose problems, such as attenuation, noise, jitter, and dispersion that arise or characterize specific parts of the system.
  • 3.
    Jitter and drift Jitter is the deviation from ideal timing of an event, and is typically measured from the zero crossing of a reference signal.  Clock drift occurs when the transmitter’s clock period is slightly different from that of the receiver. After many clock cycles these difference becomes noticeable and causes loss of synchronization and signal errors.
  • 6.
    A – Eyerise time B – Eye fall time C – Maximum overshoot D – Noise margin E – Jitter F – Optimal sampling time
  • 7.
  • 8.
    Logic level “High” or“1” Logic level “Low” or “0”
  • 9.
    PAM2 ( 1bit data) PAM4 (4 bit data)
  • 10.
    Steps involved incalculating eye diagram
  • 11.
    IMPORTANT terms  EYEAMPLITUDE  EYE HEIGHT  EYE LEVEL  QUALITY FACTOR  JITTER  EYE WIDTH  EYE RISE TIME  EYE FALL TIME  EYE CLOSURE
  • 12.