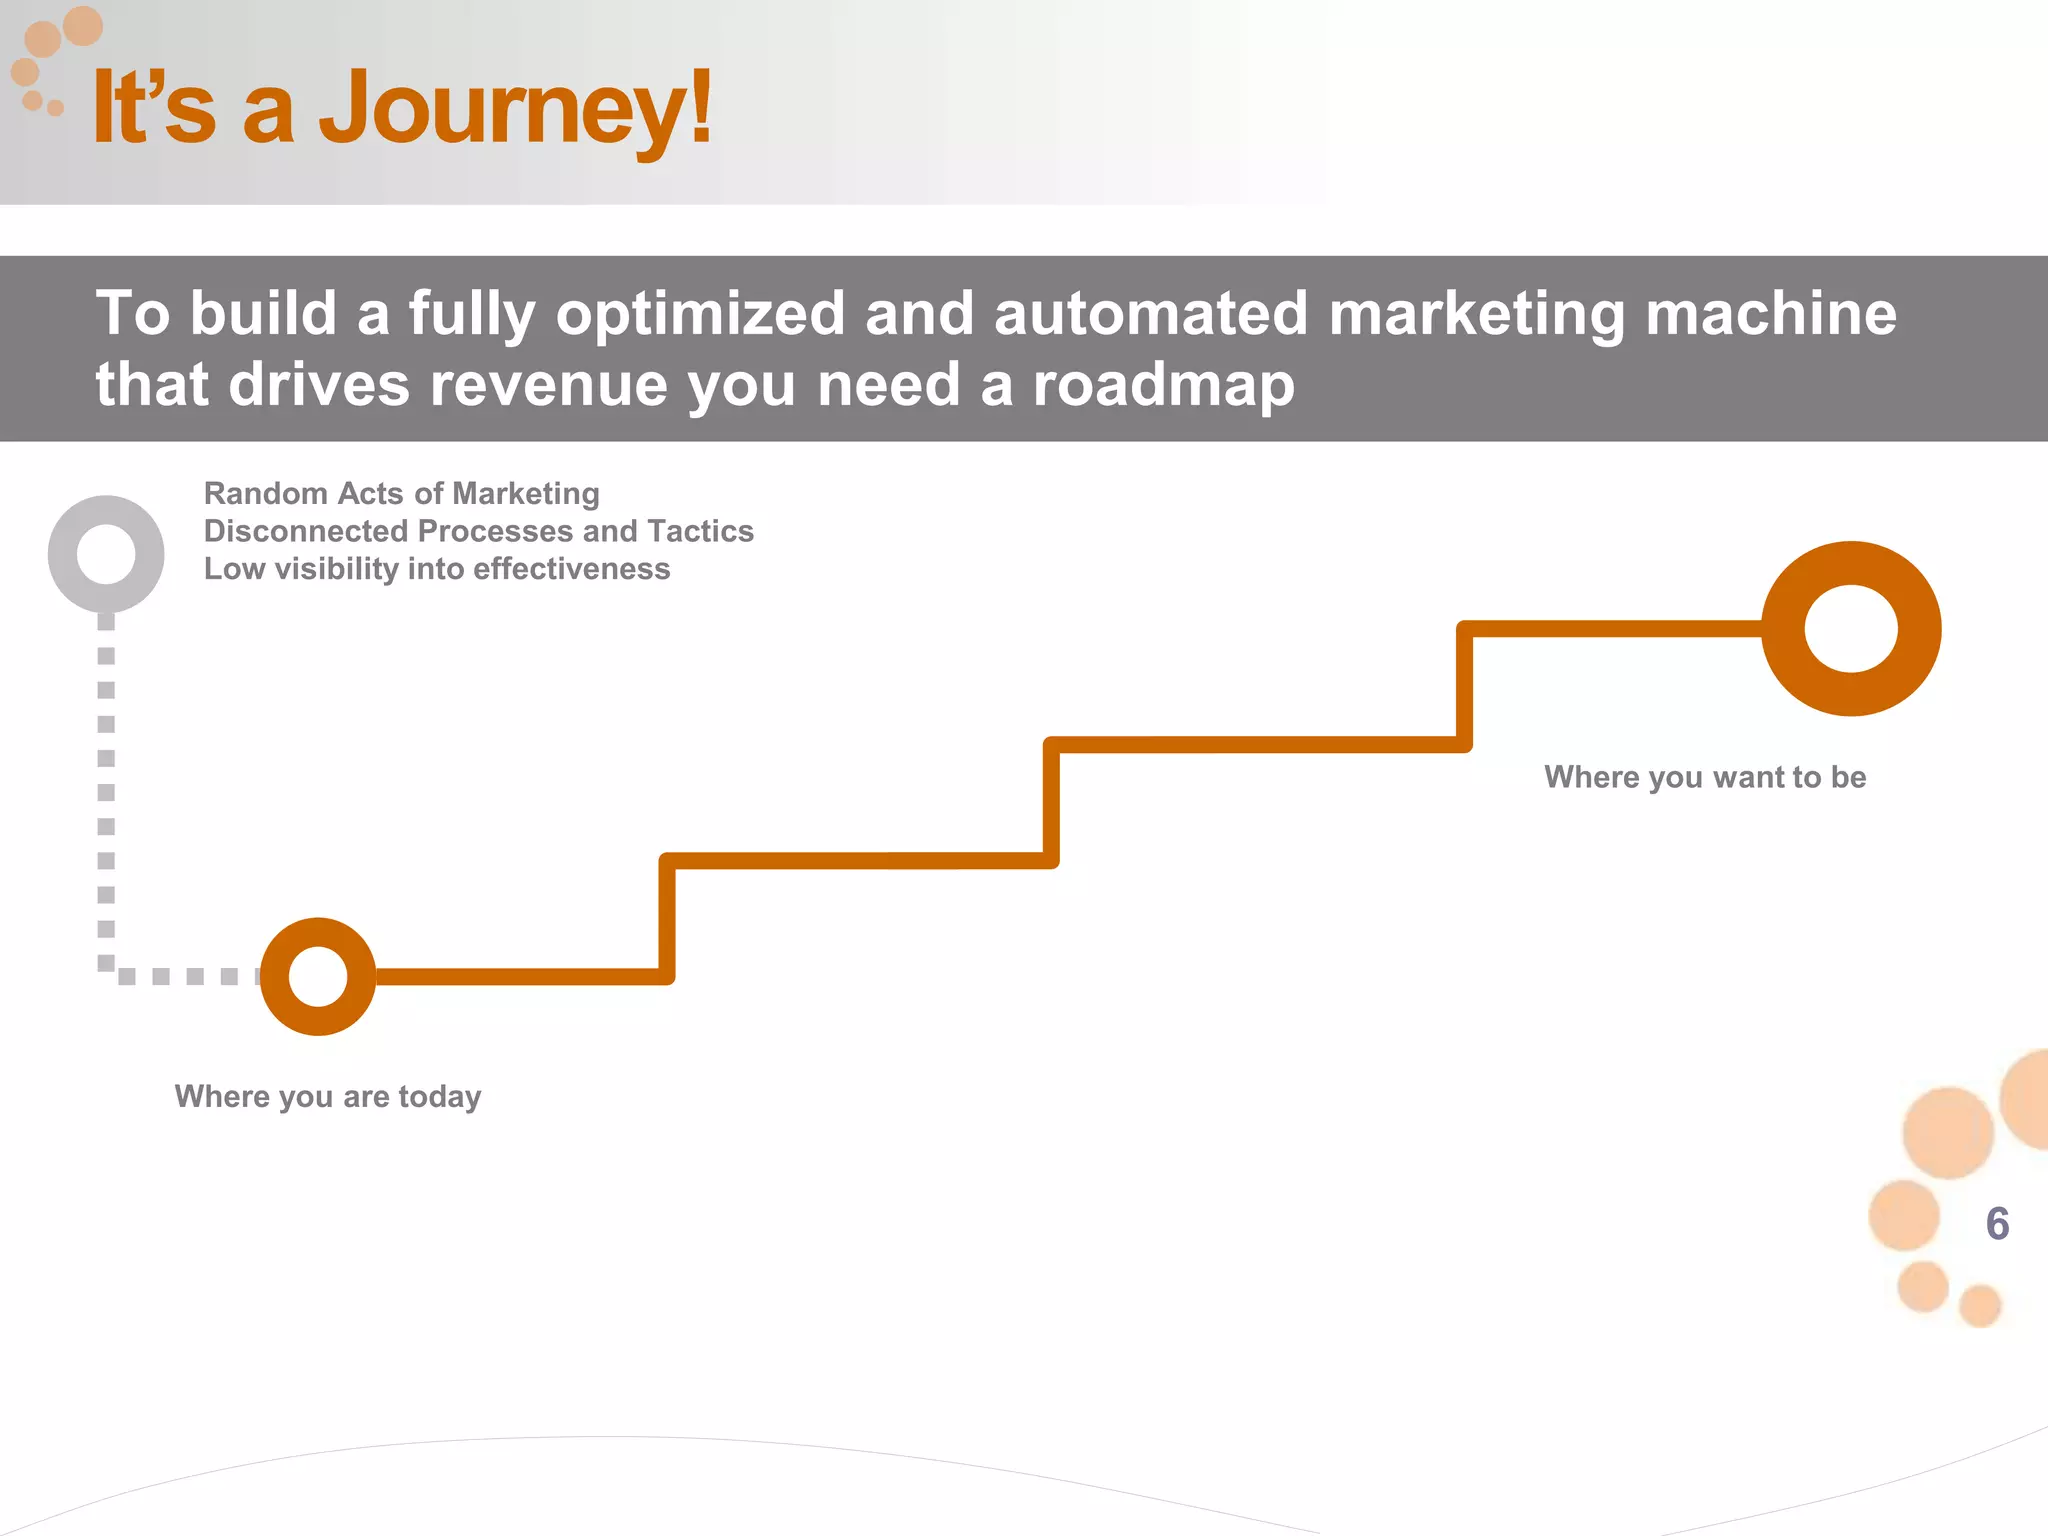
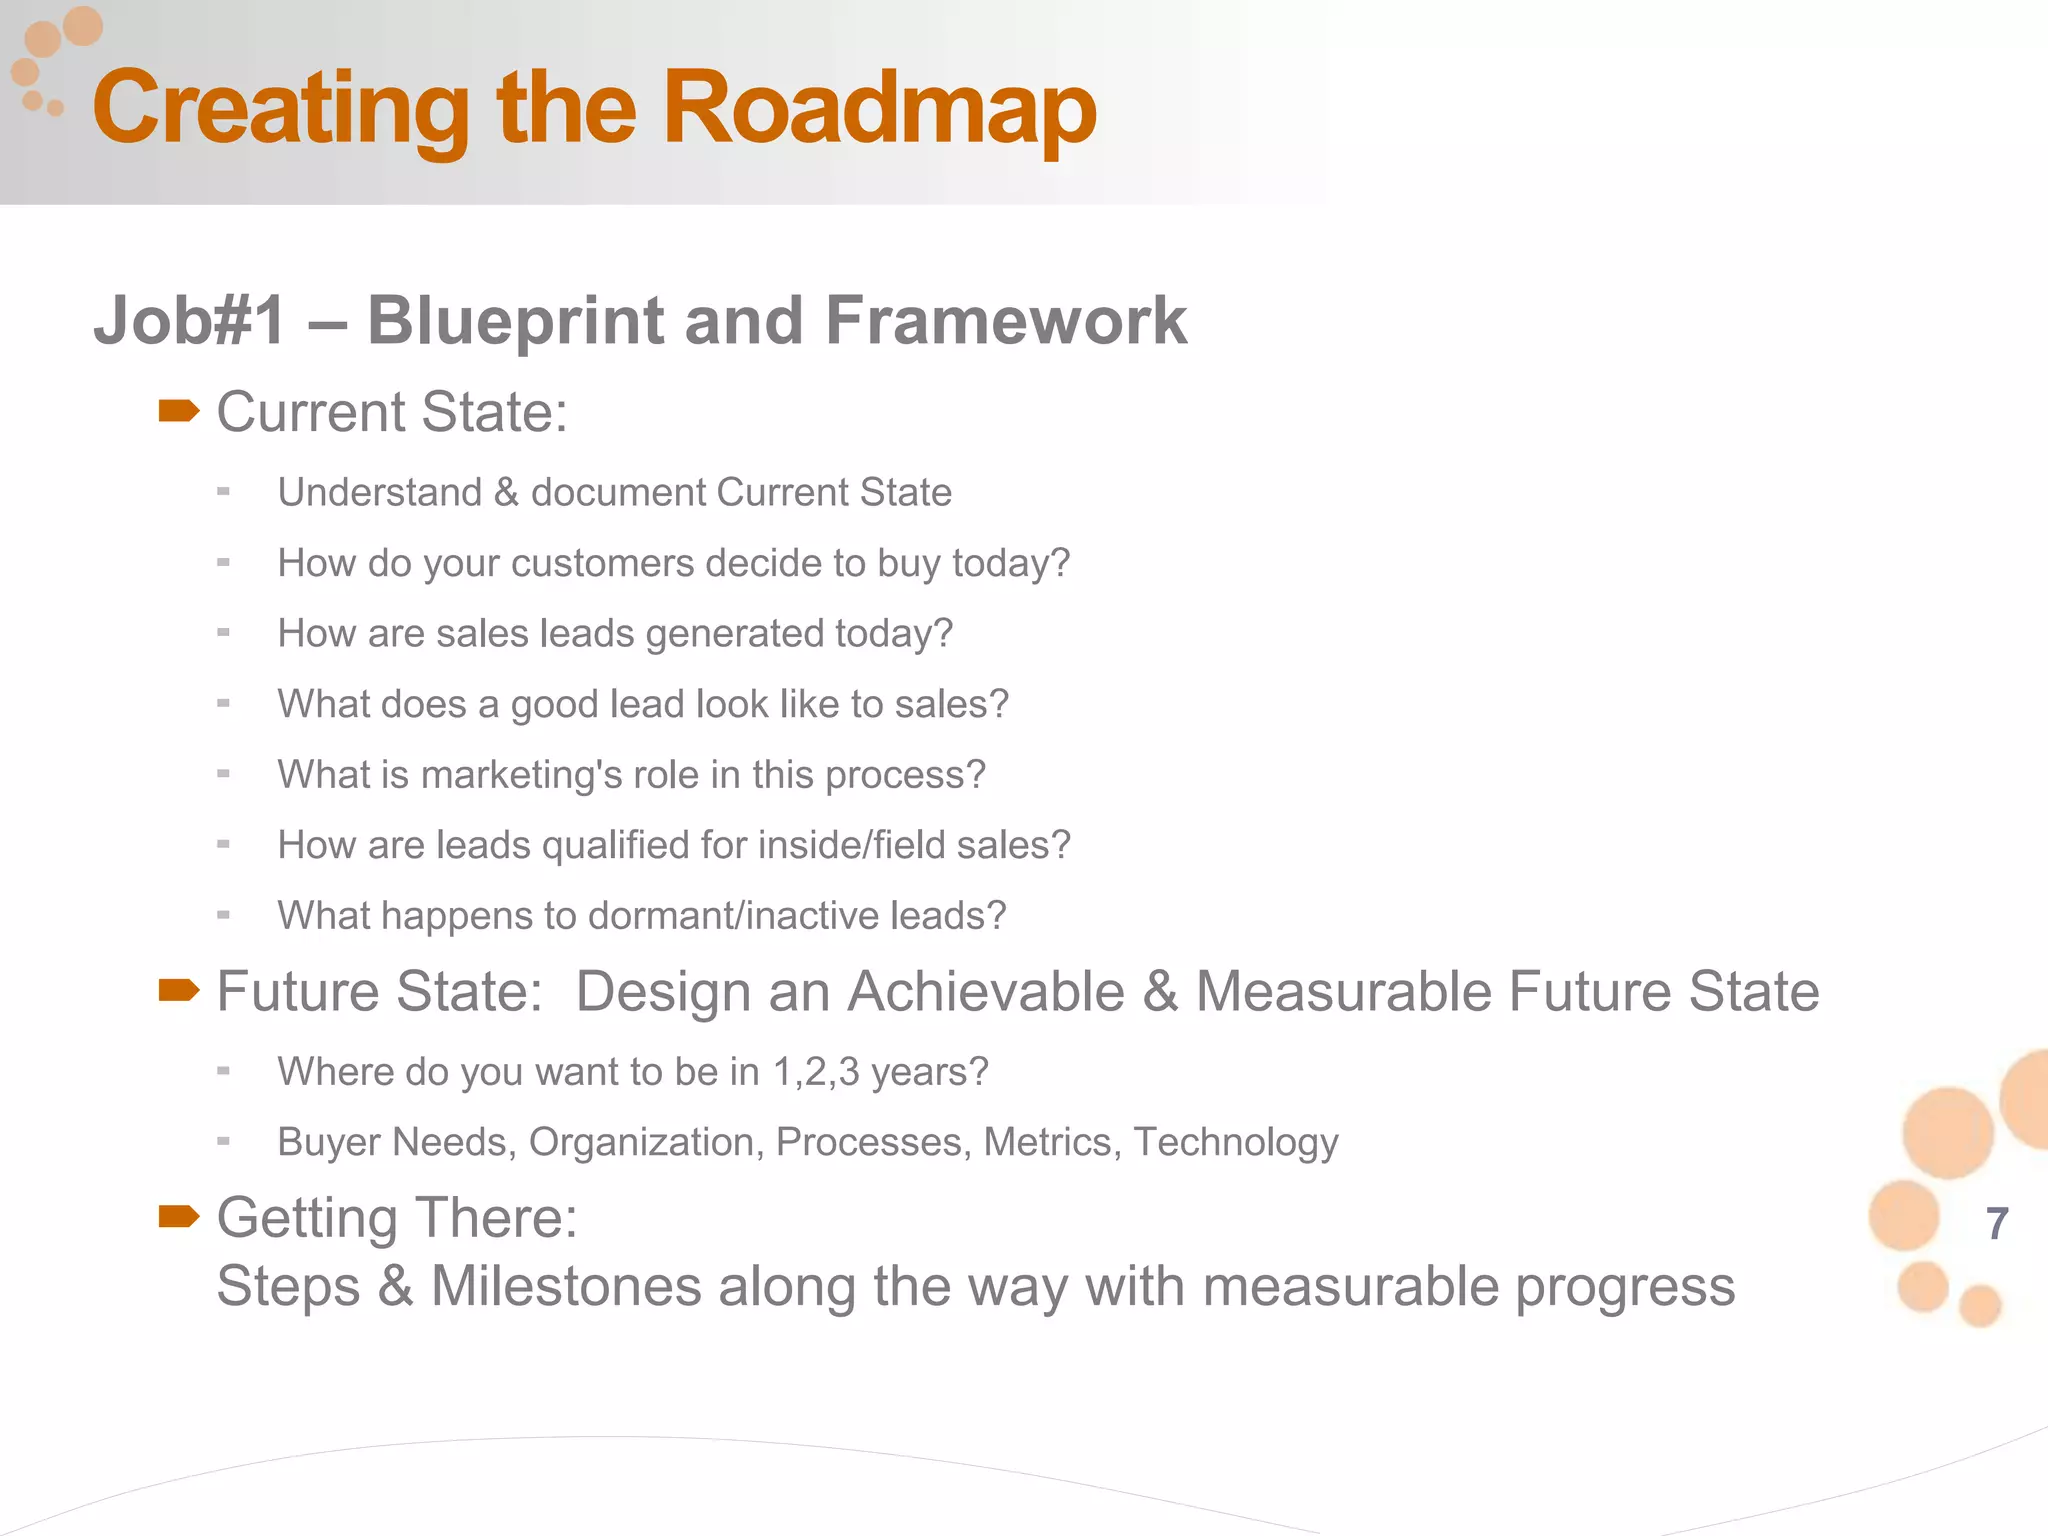
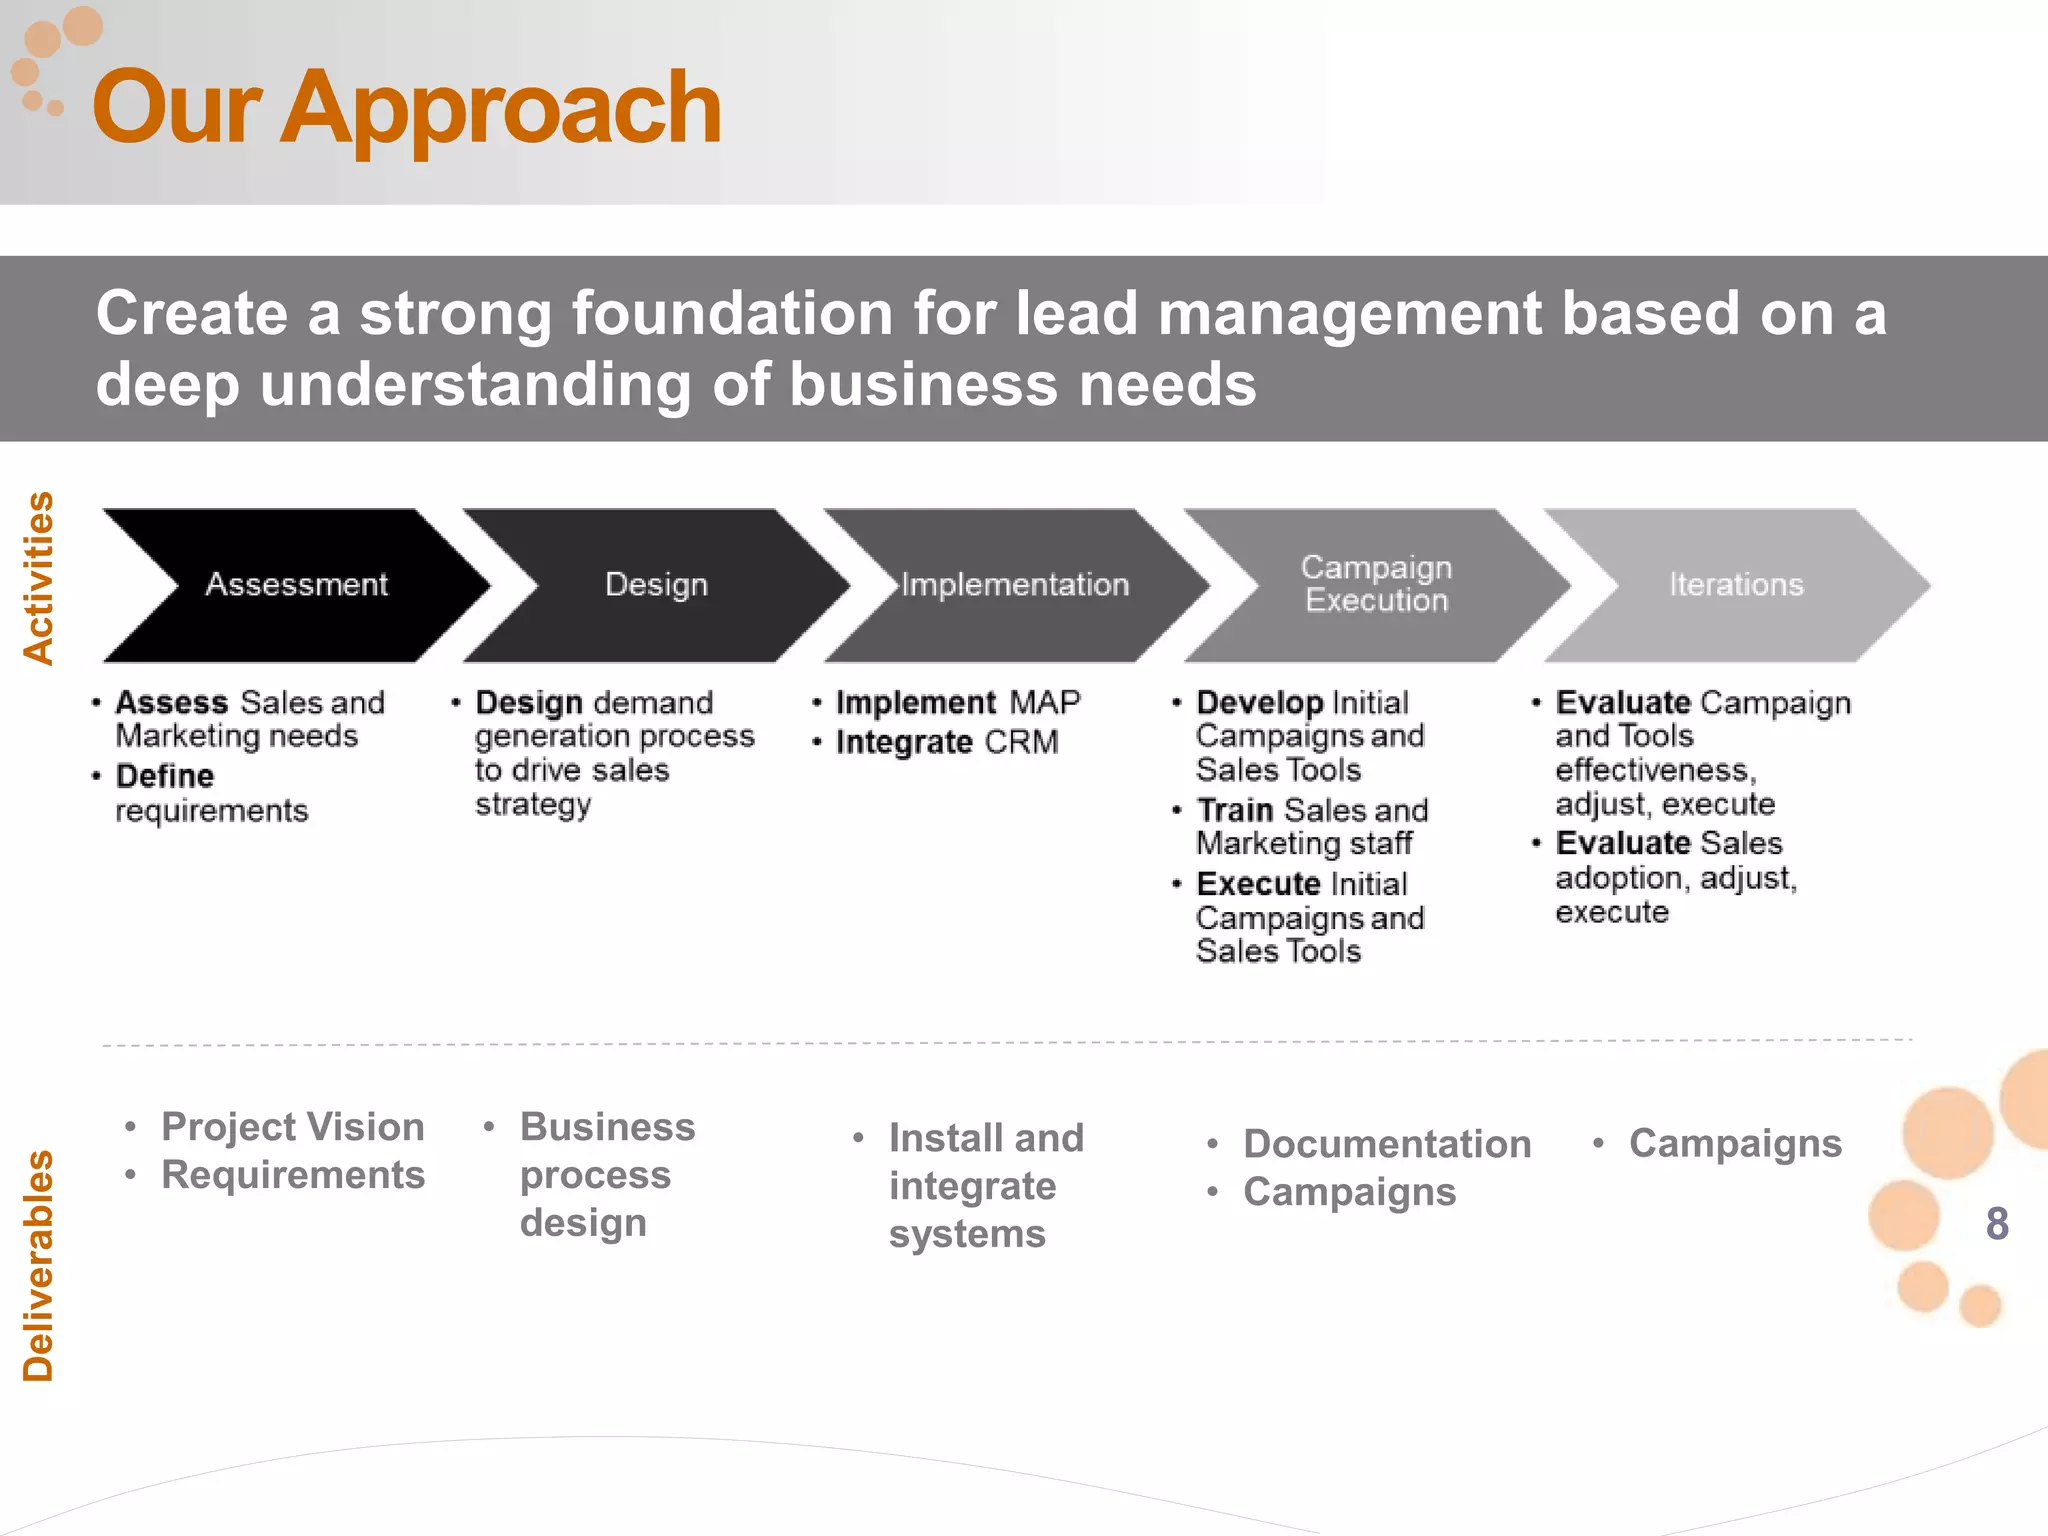
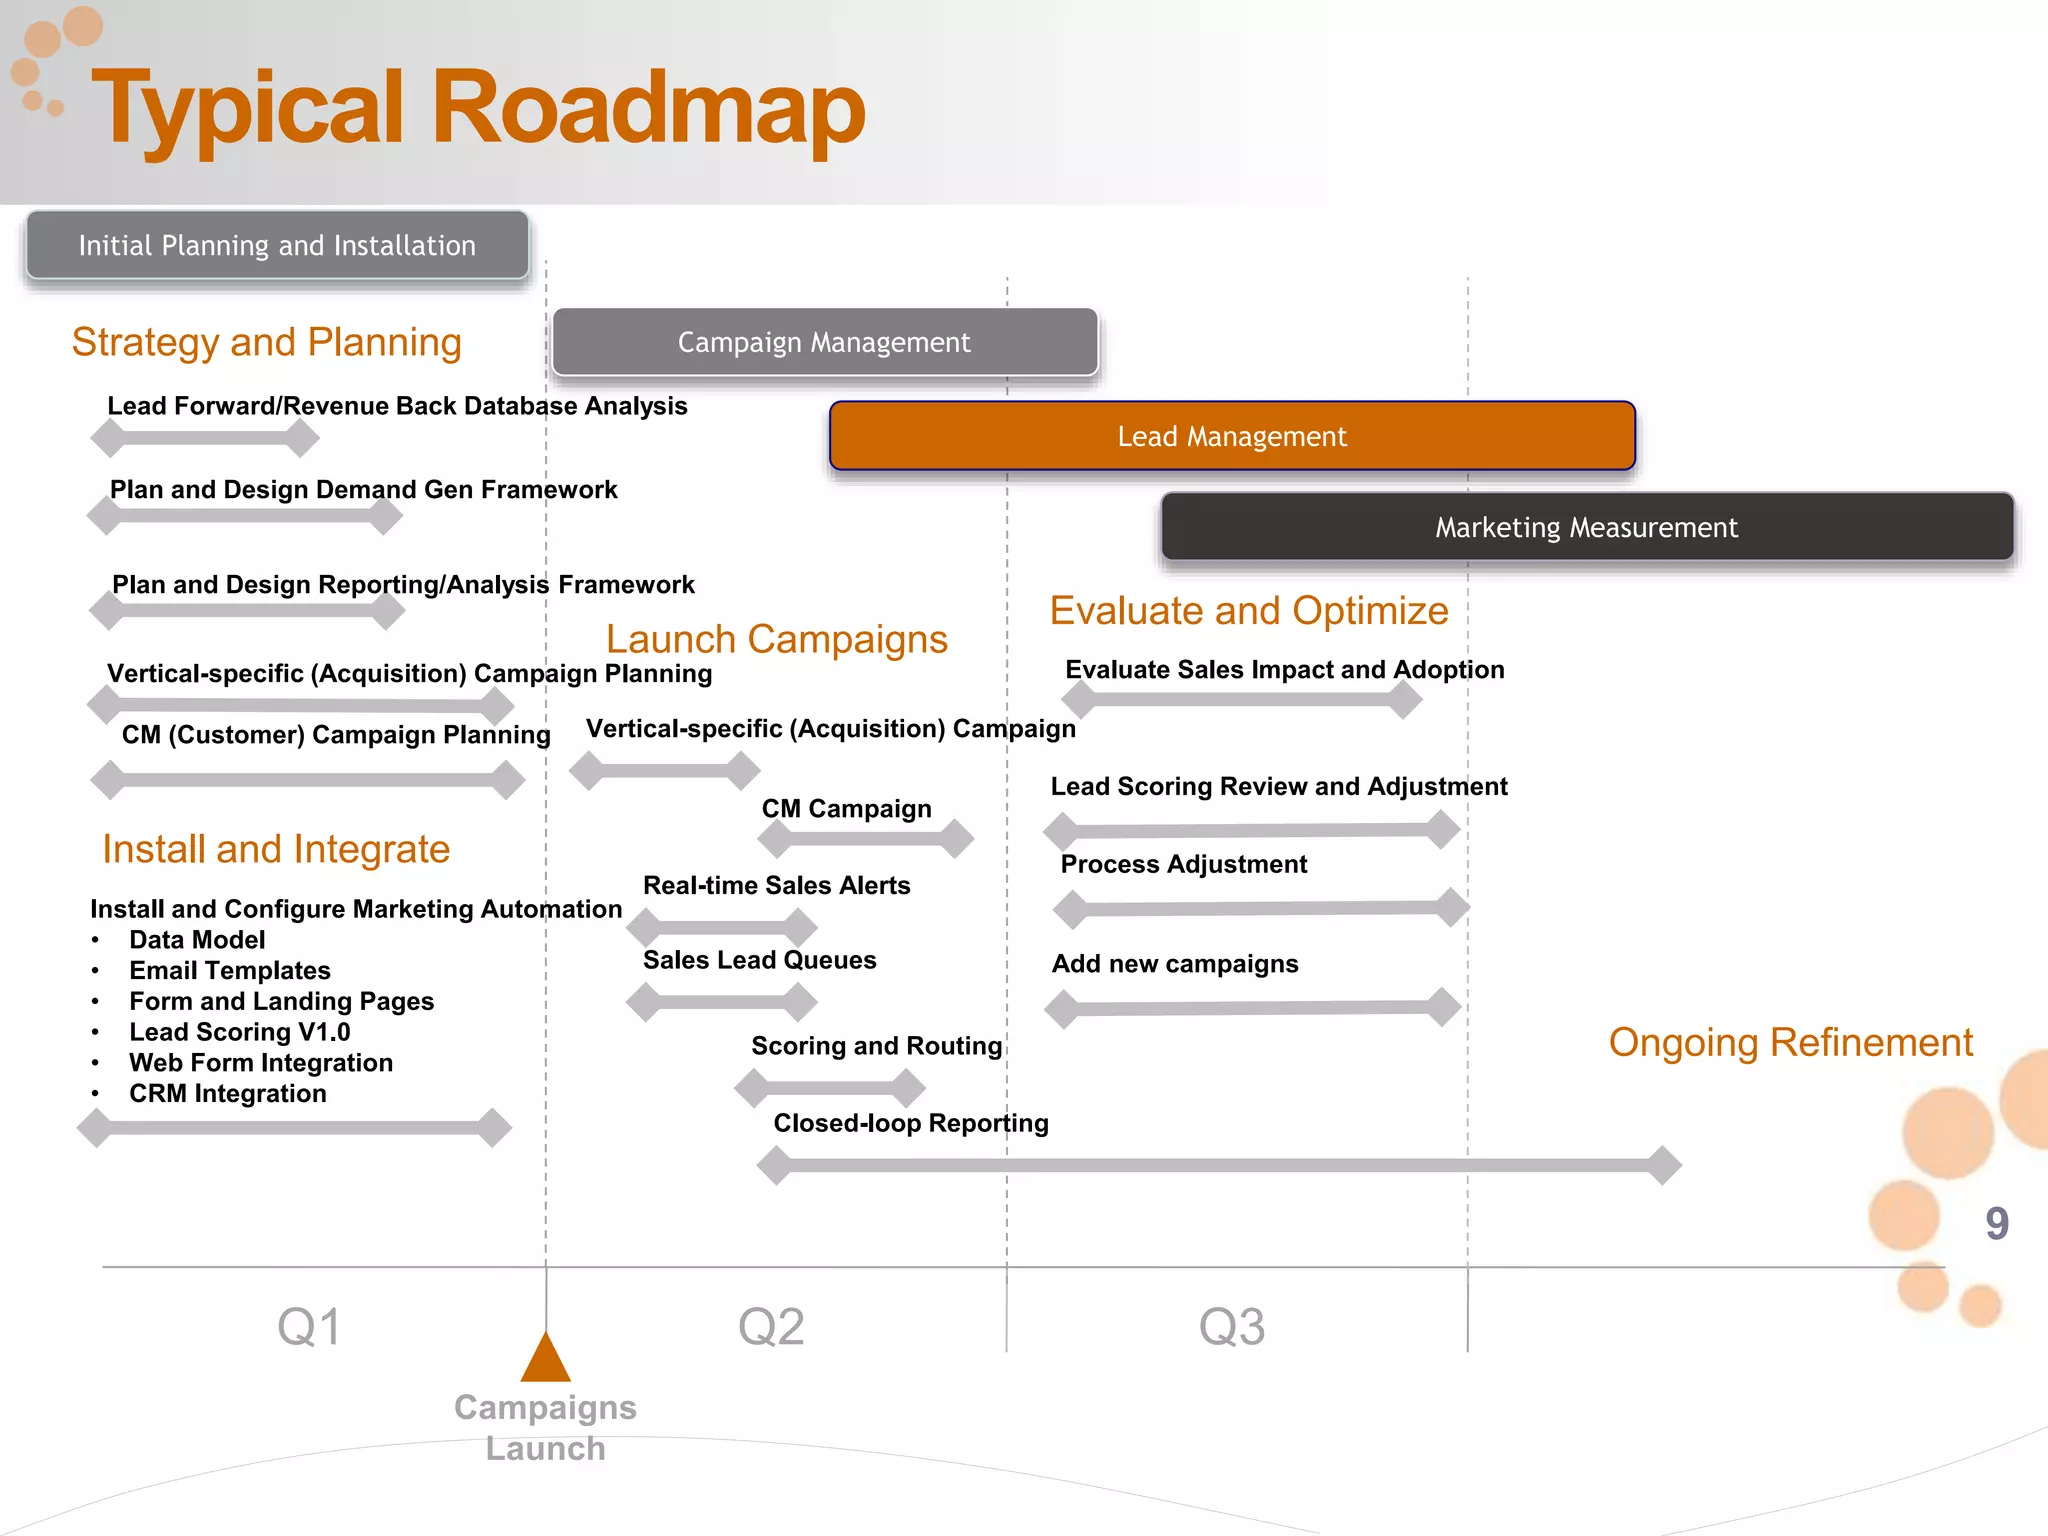
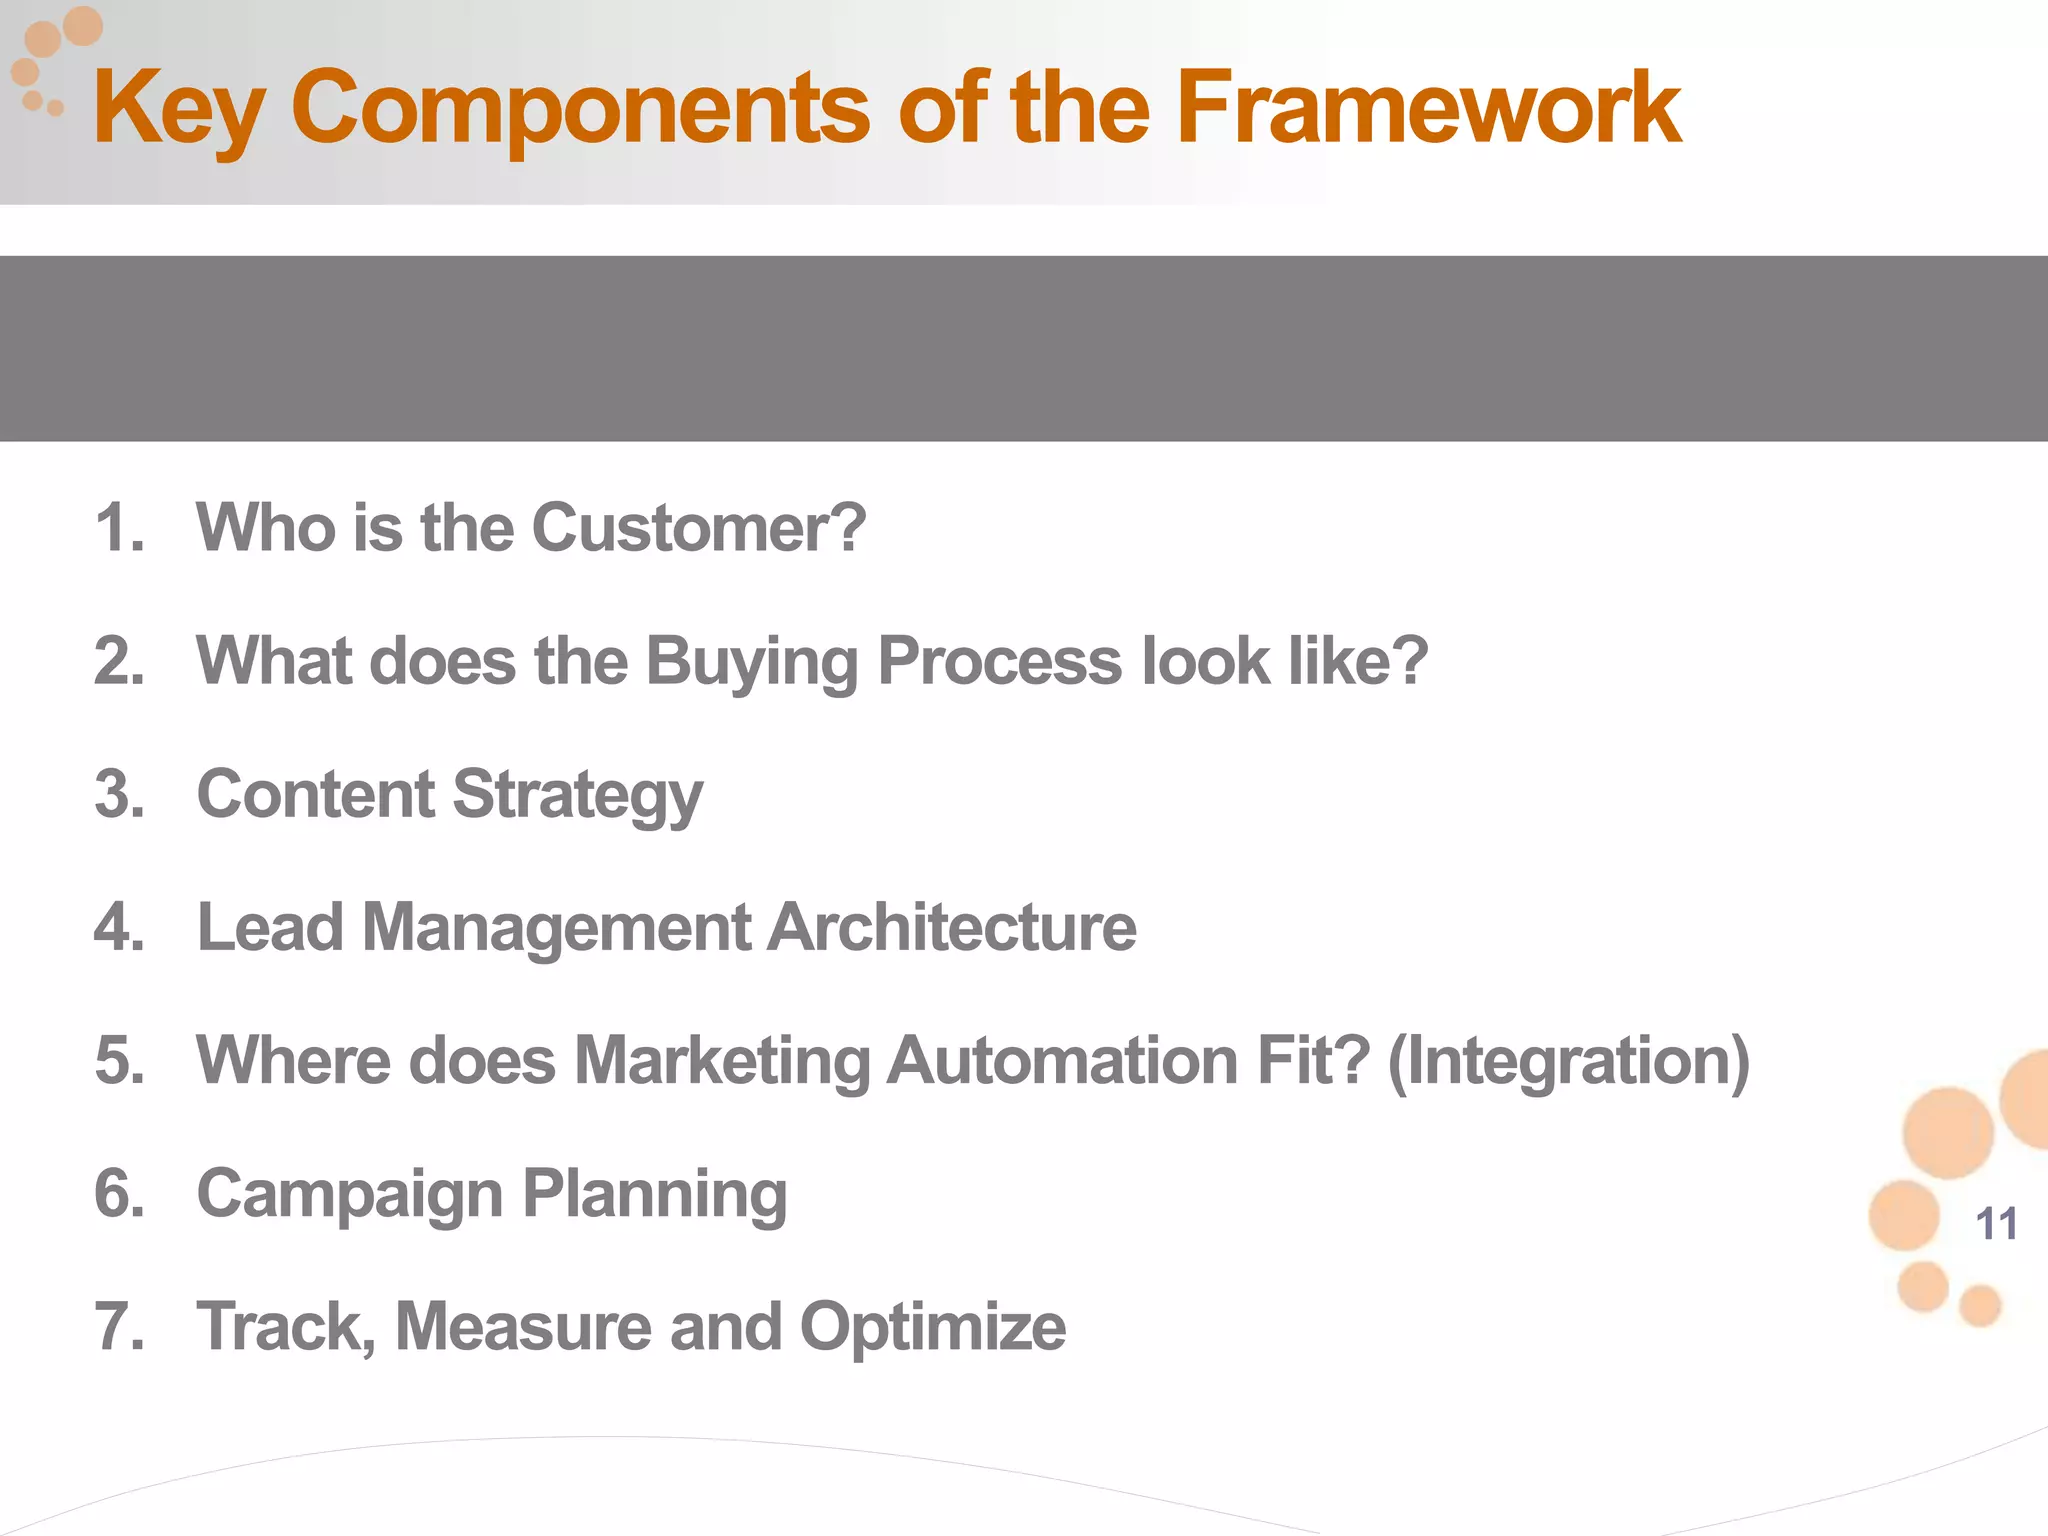
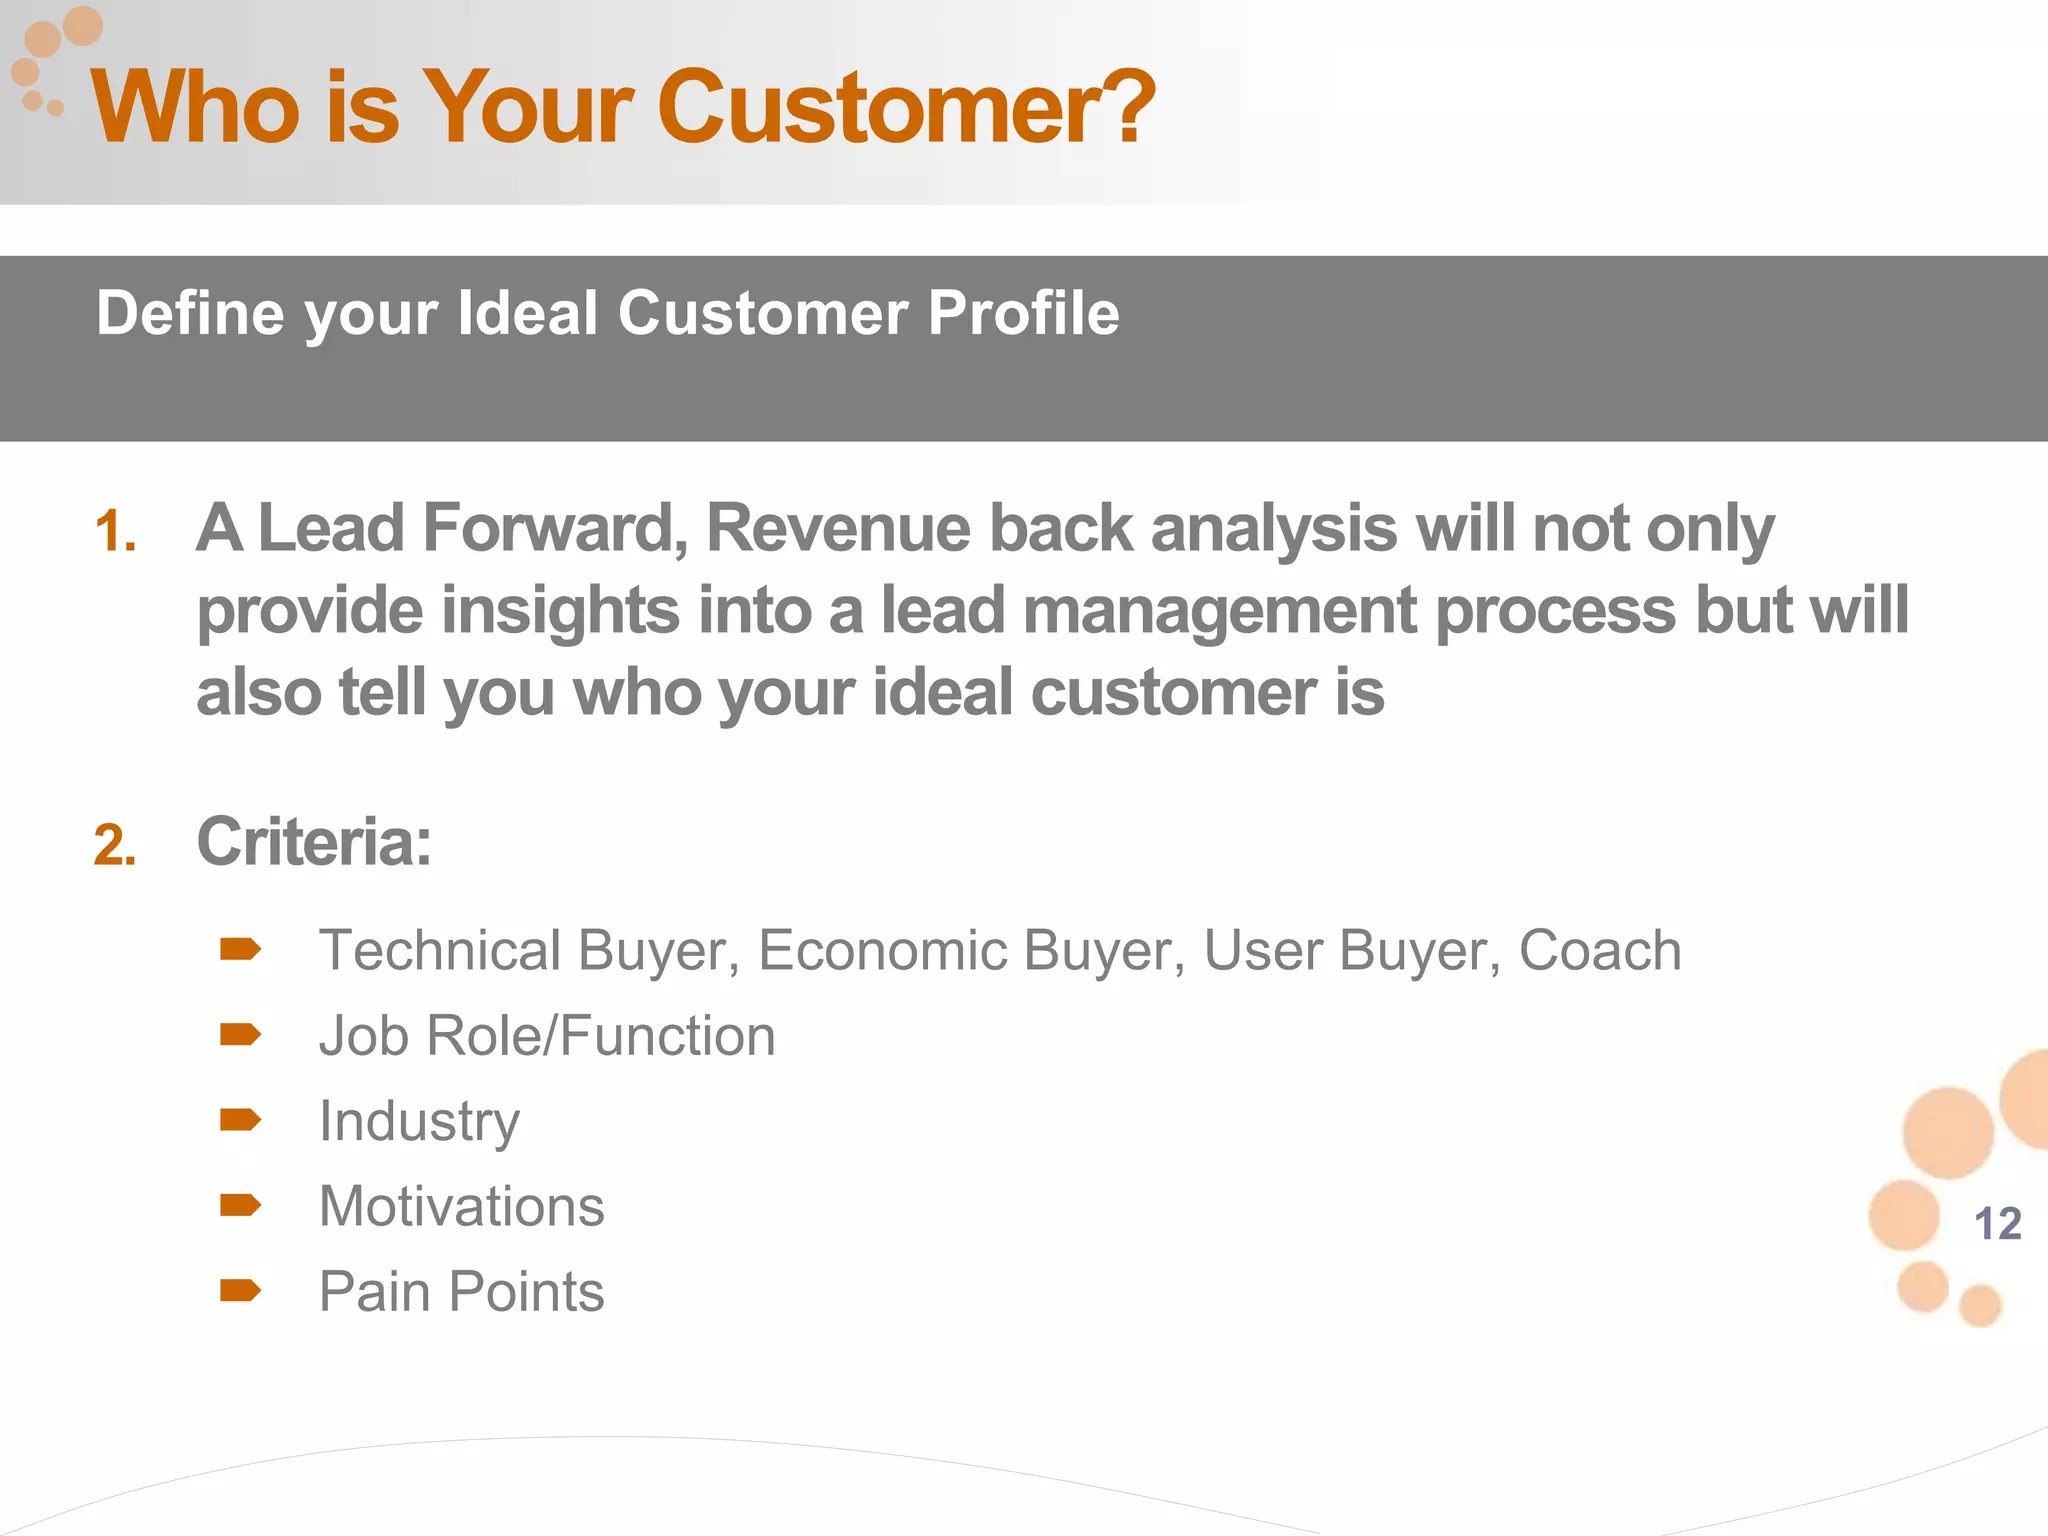
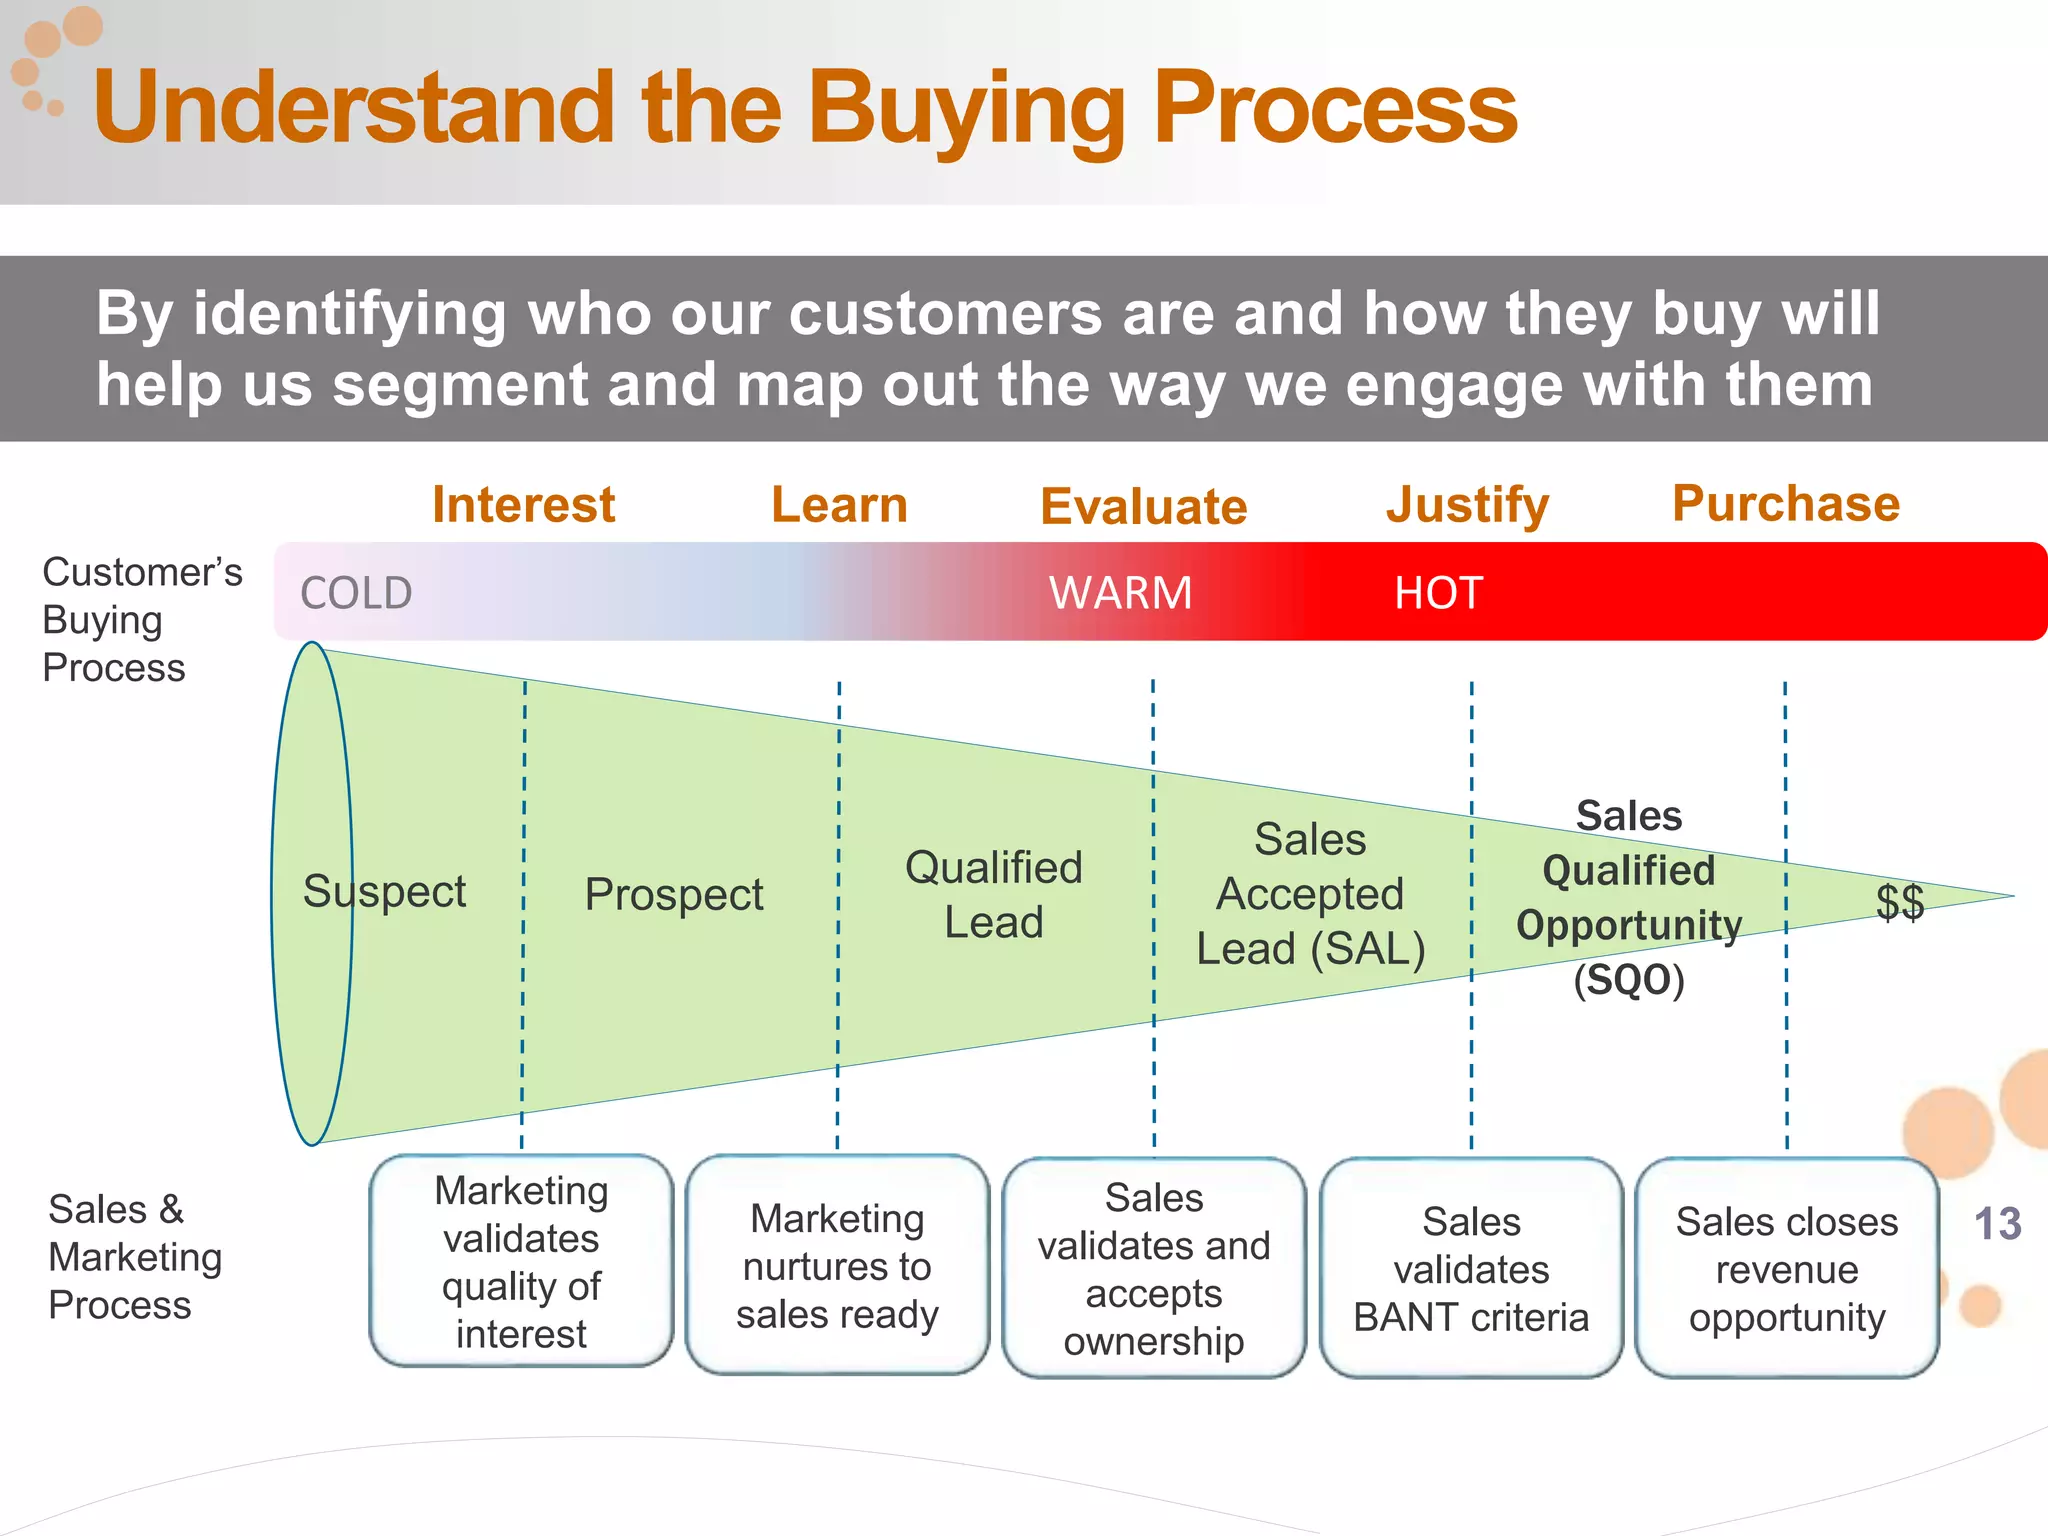
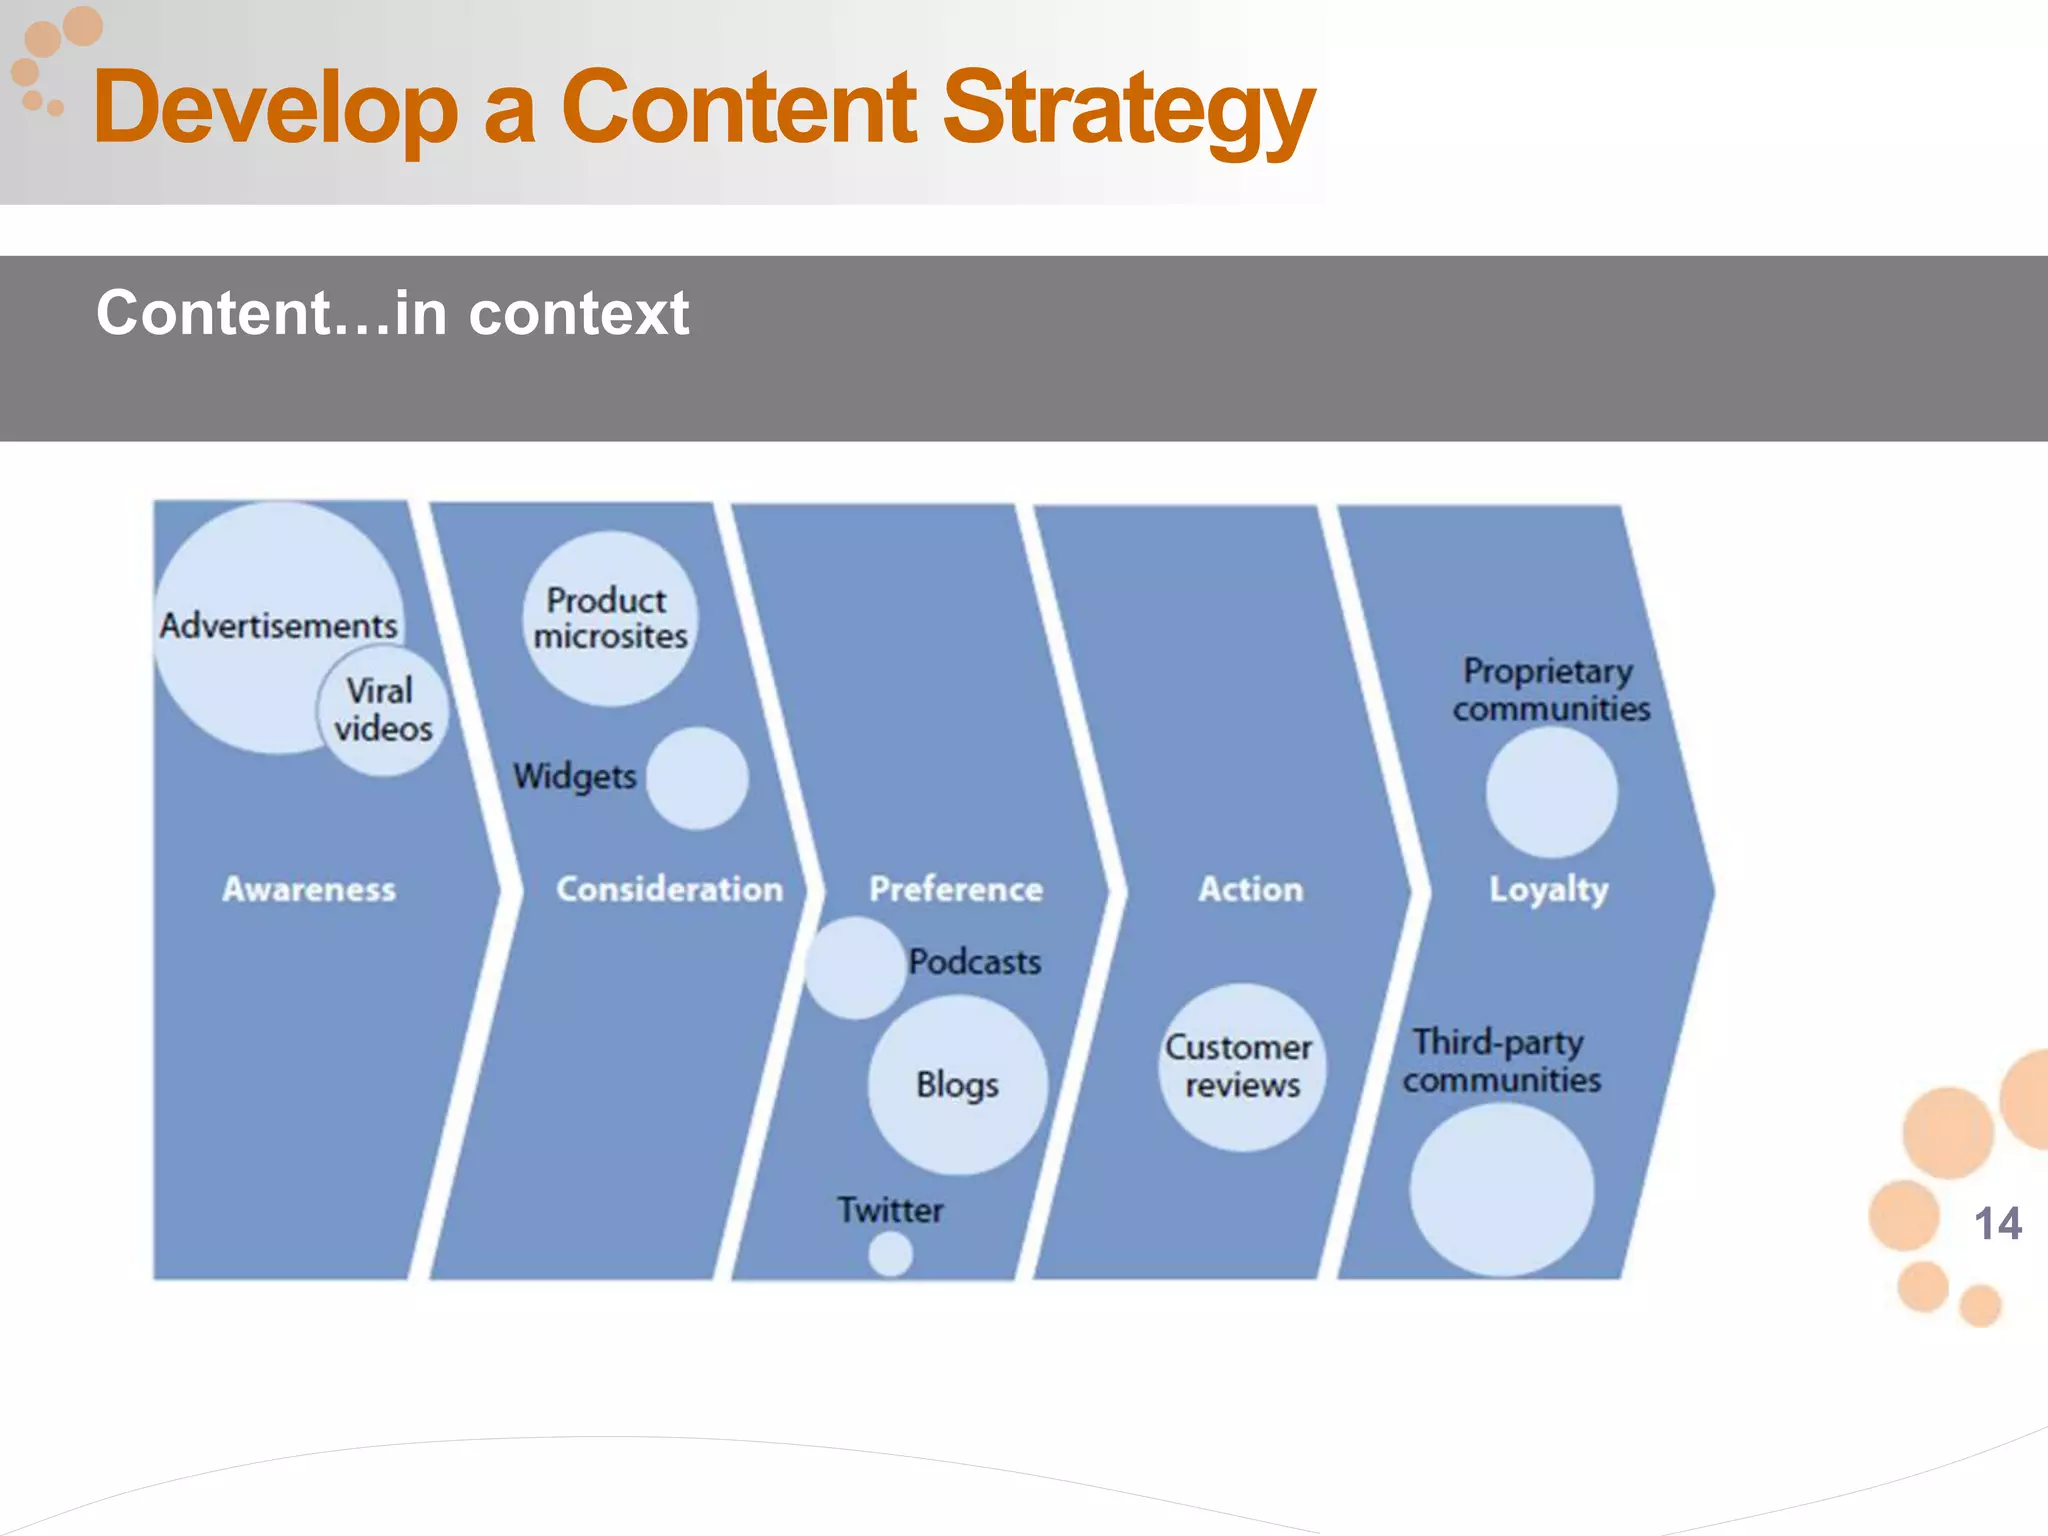
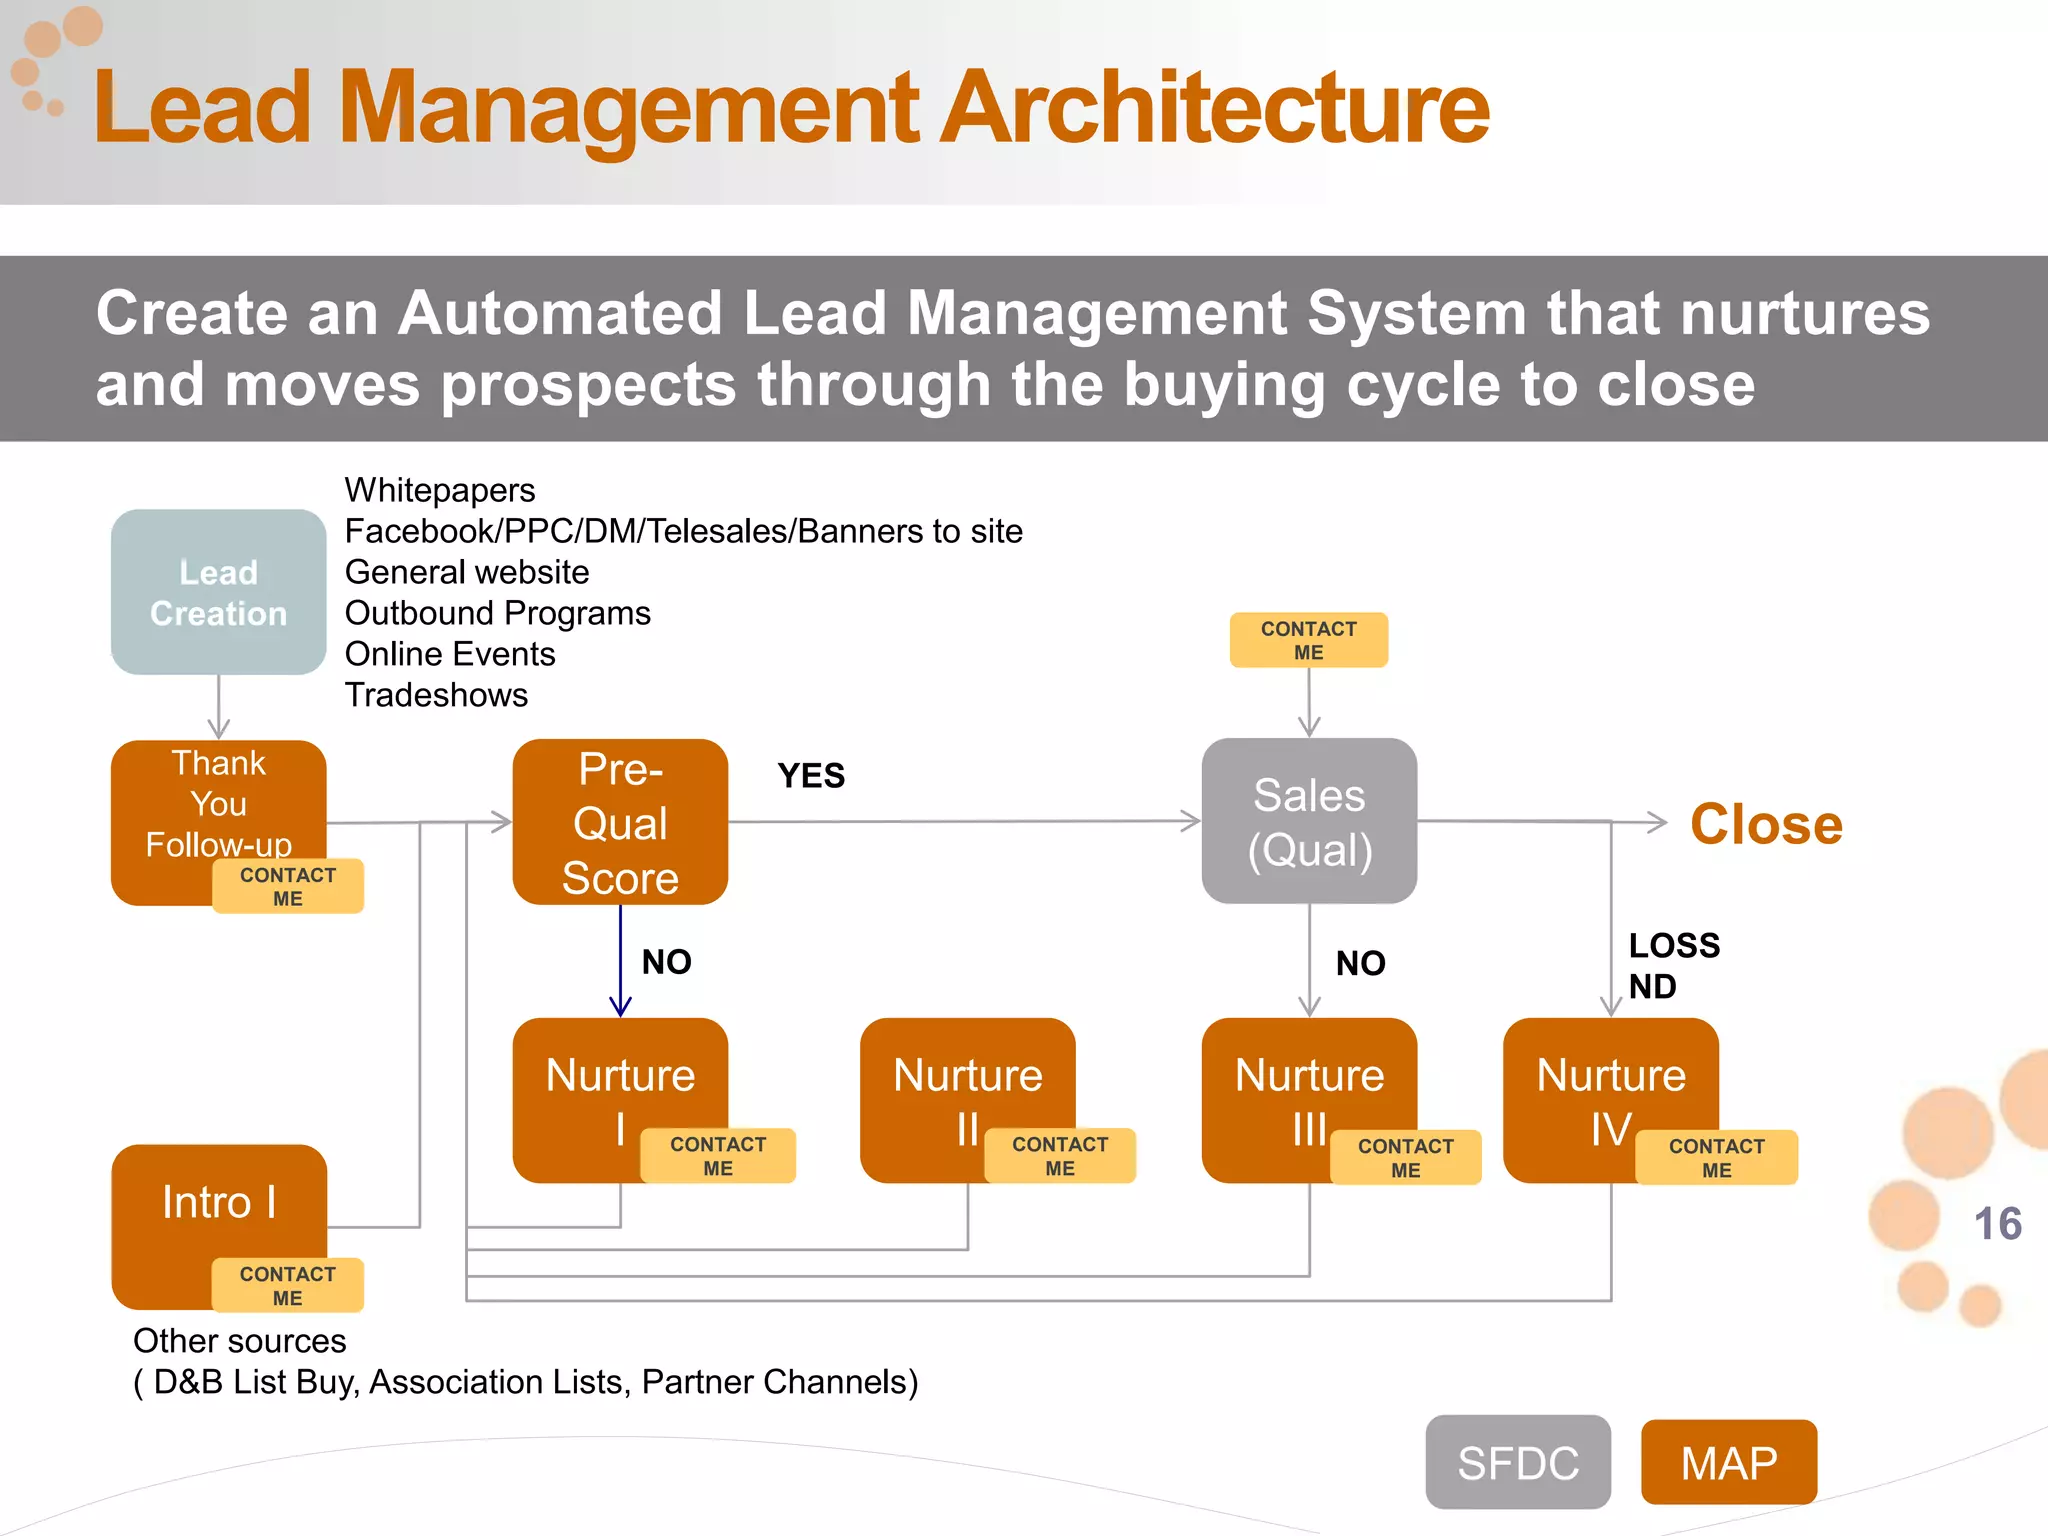
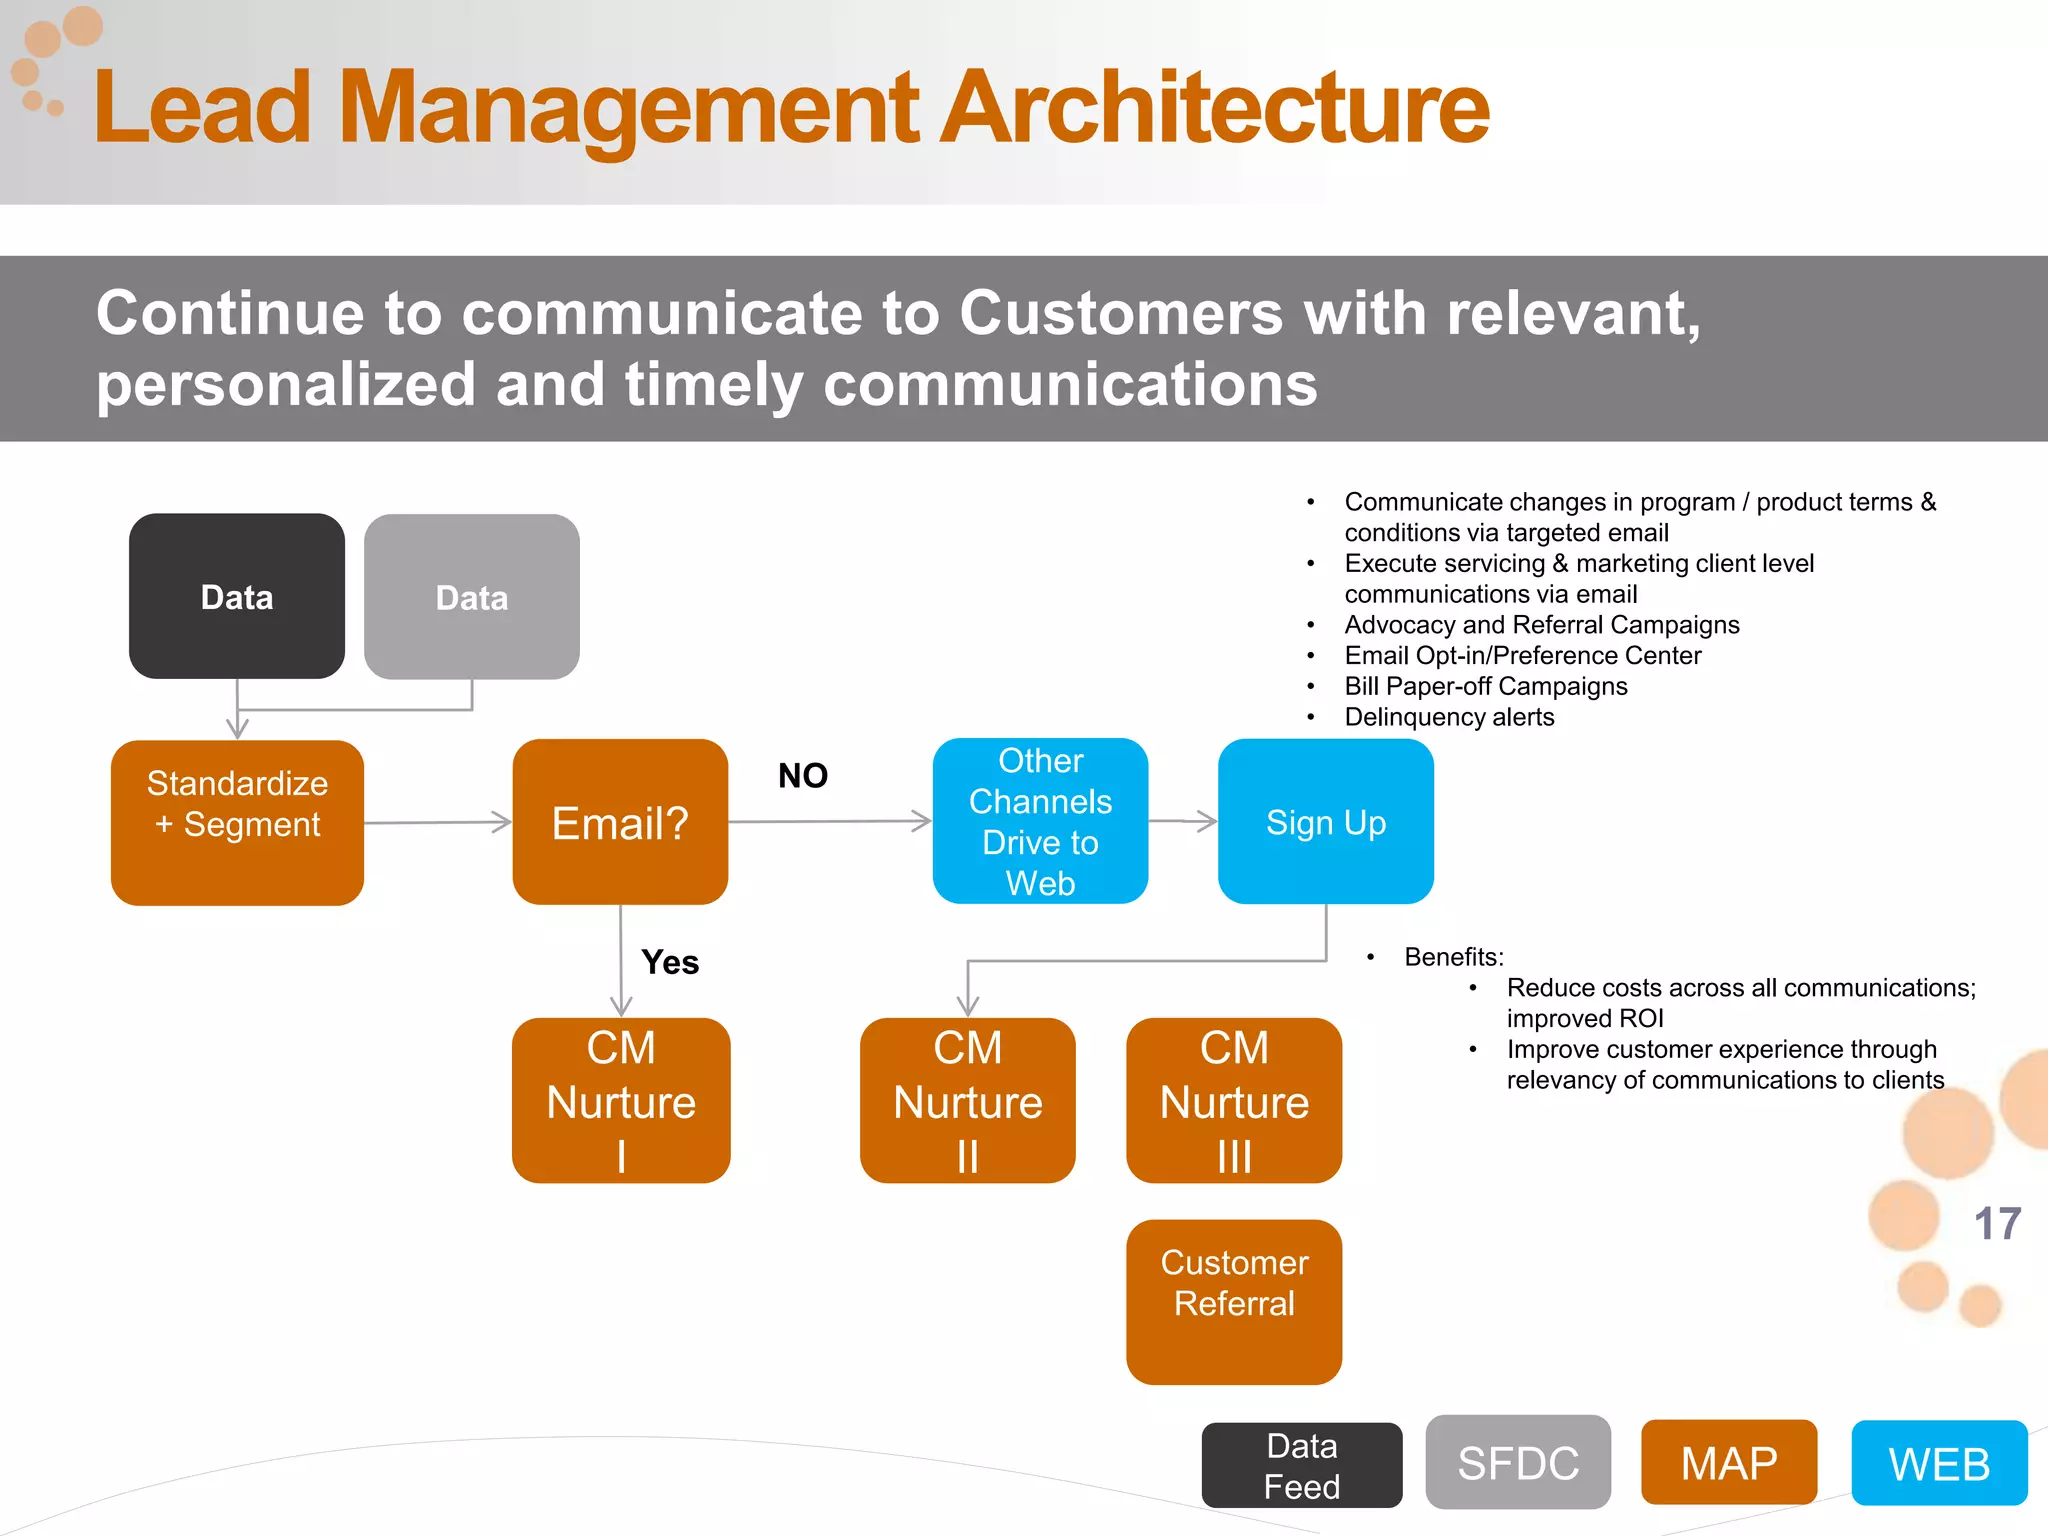
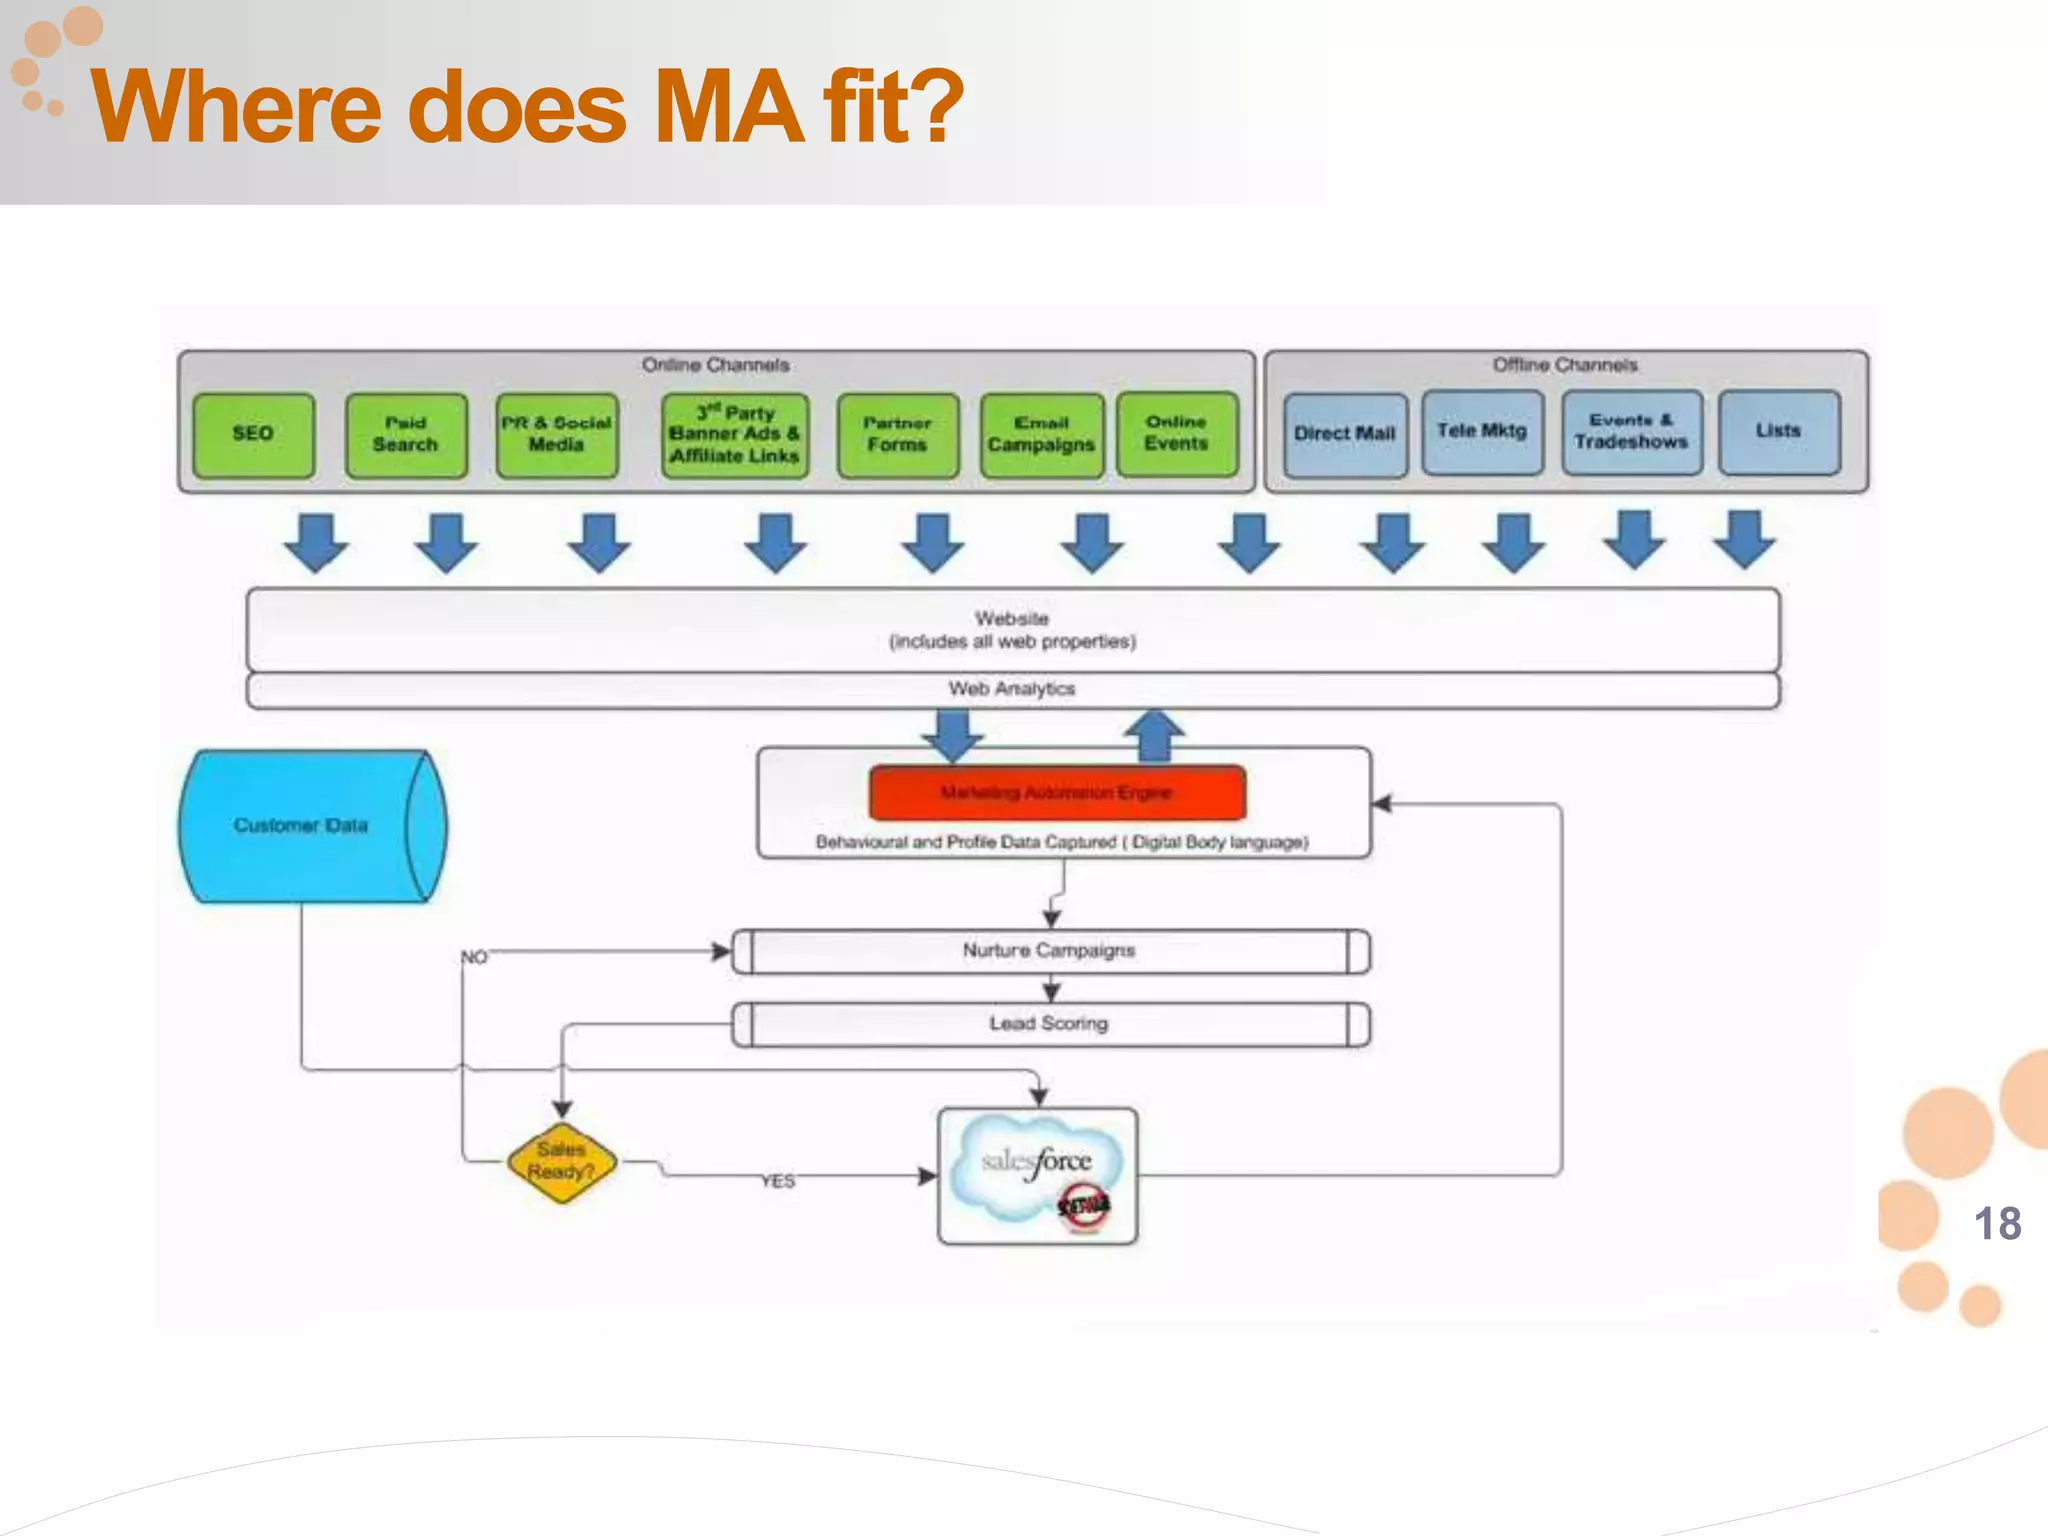
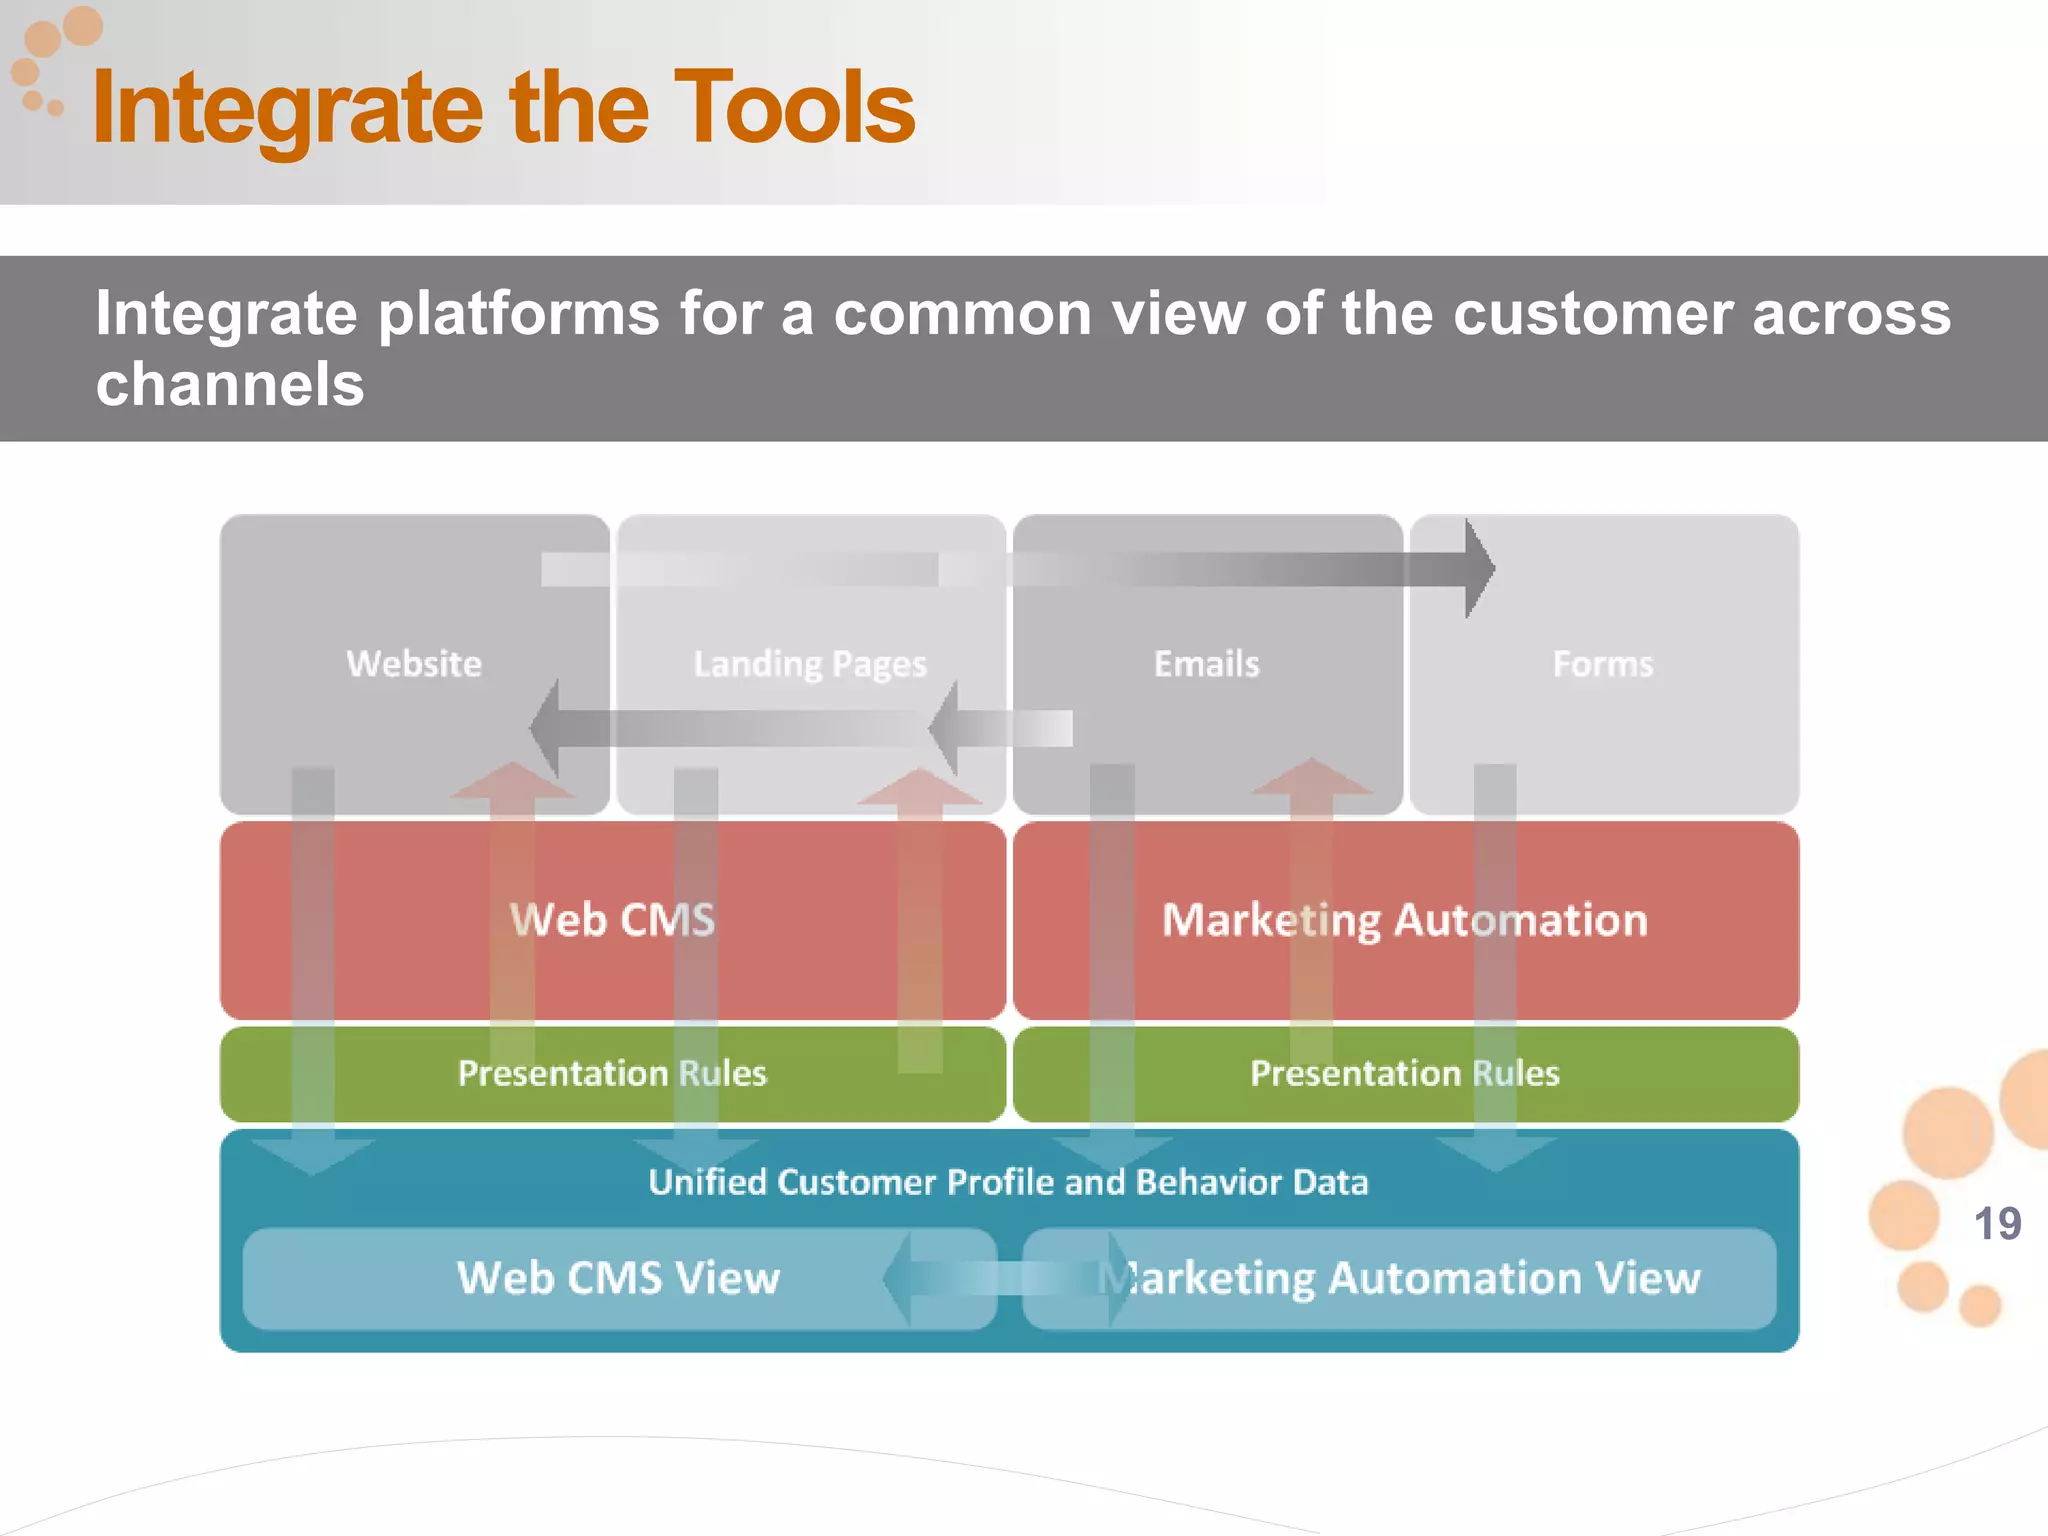
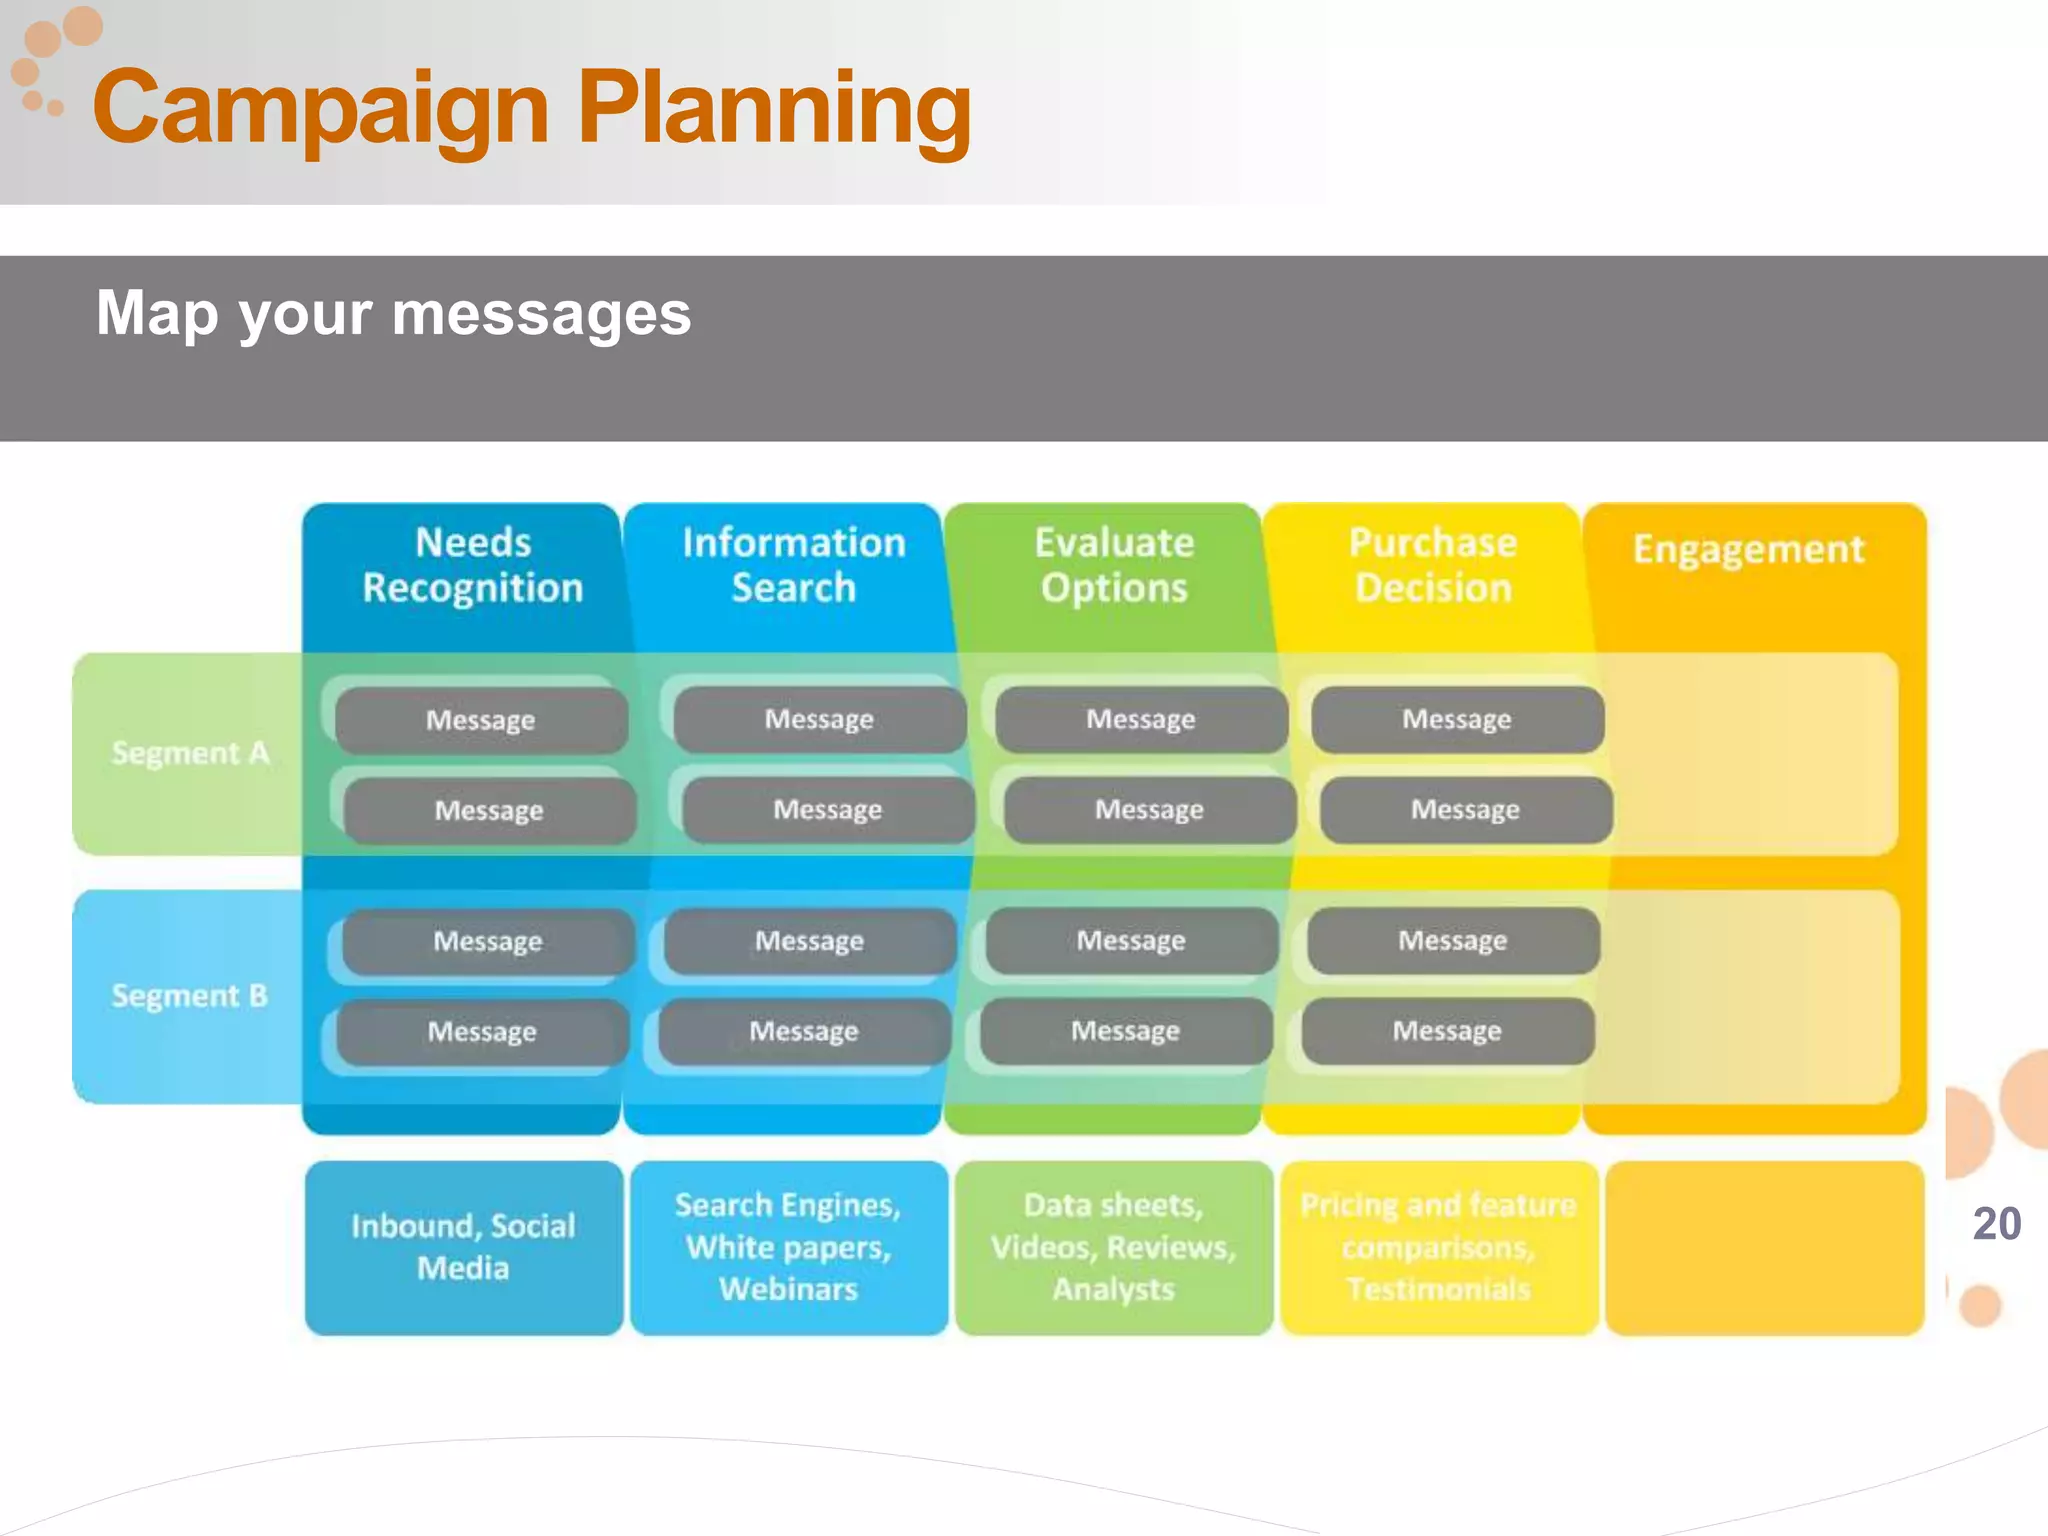
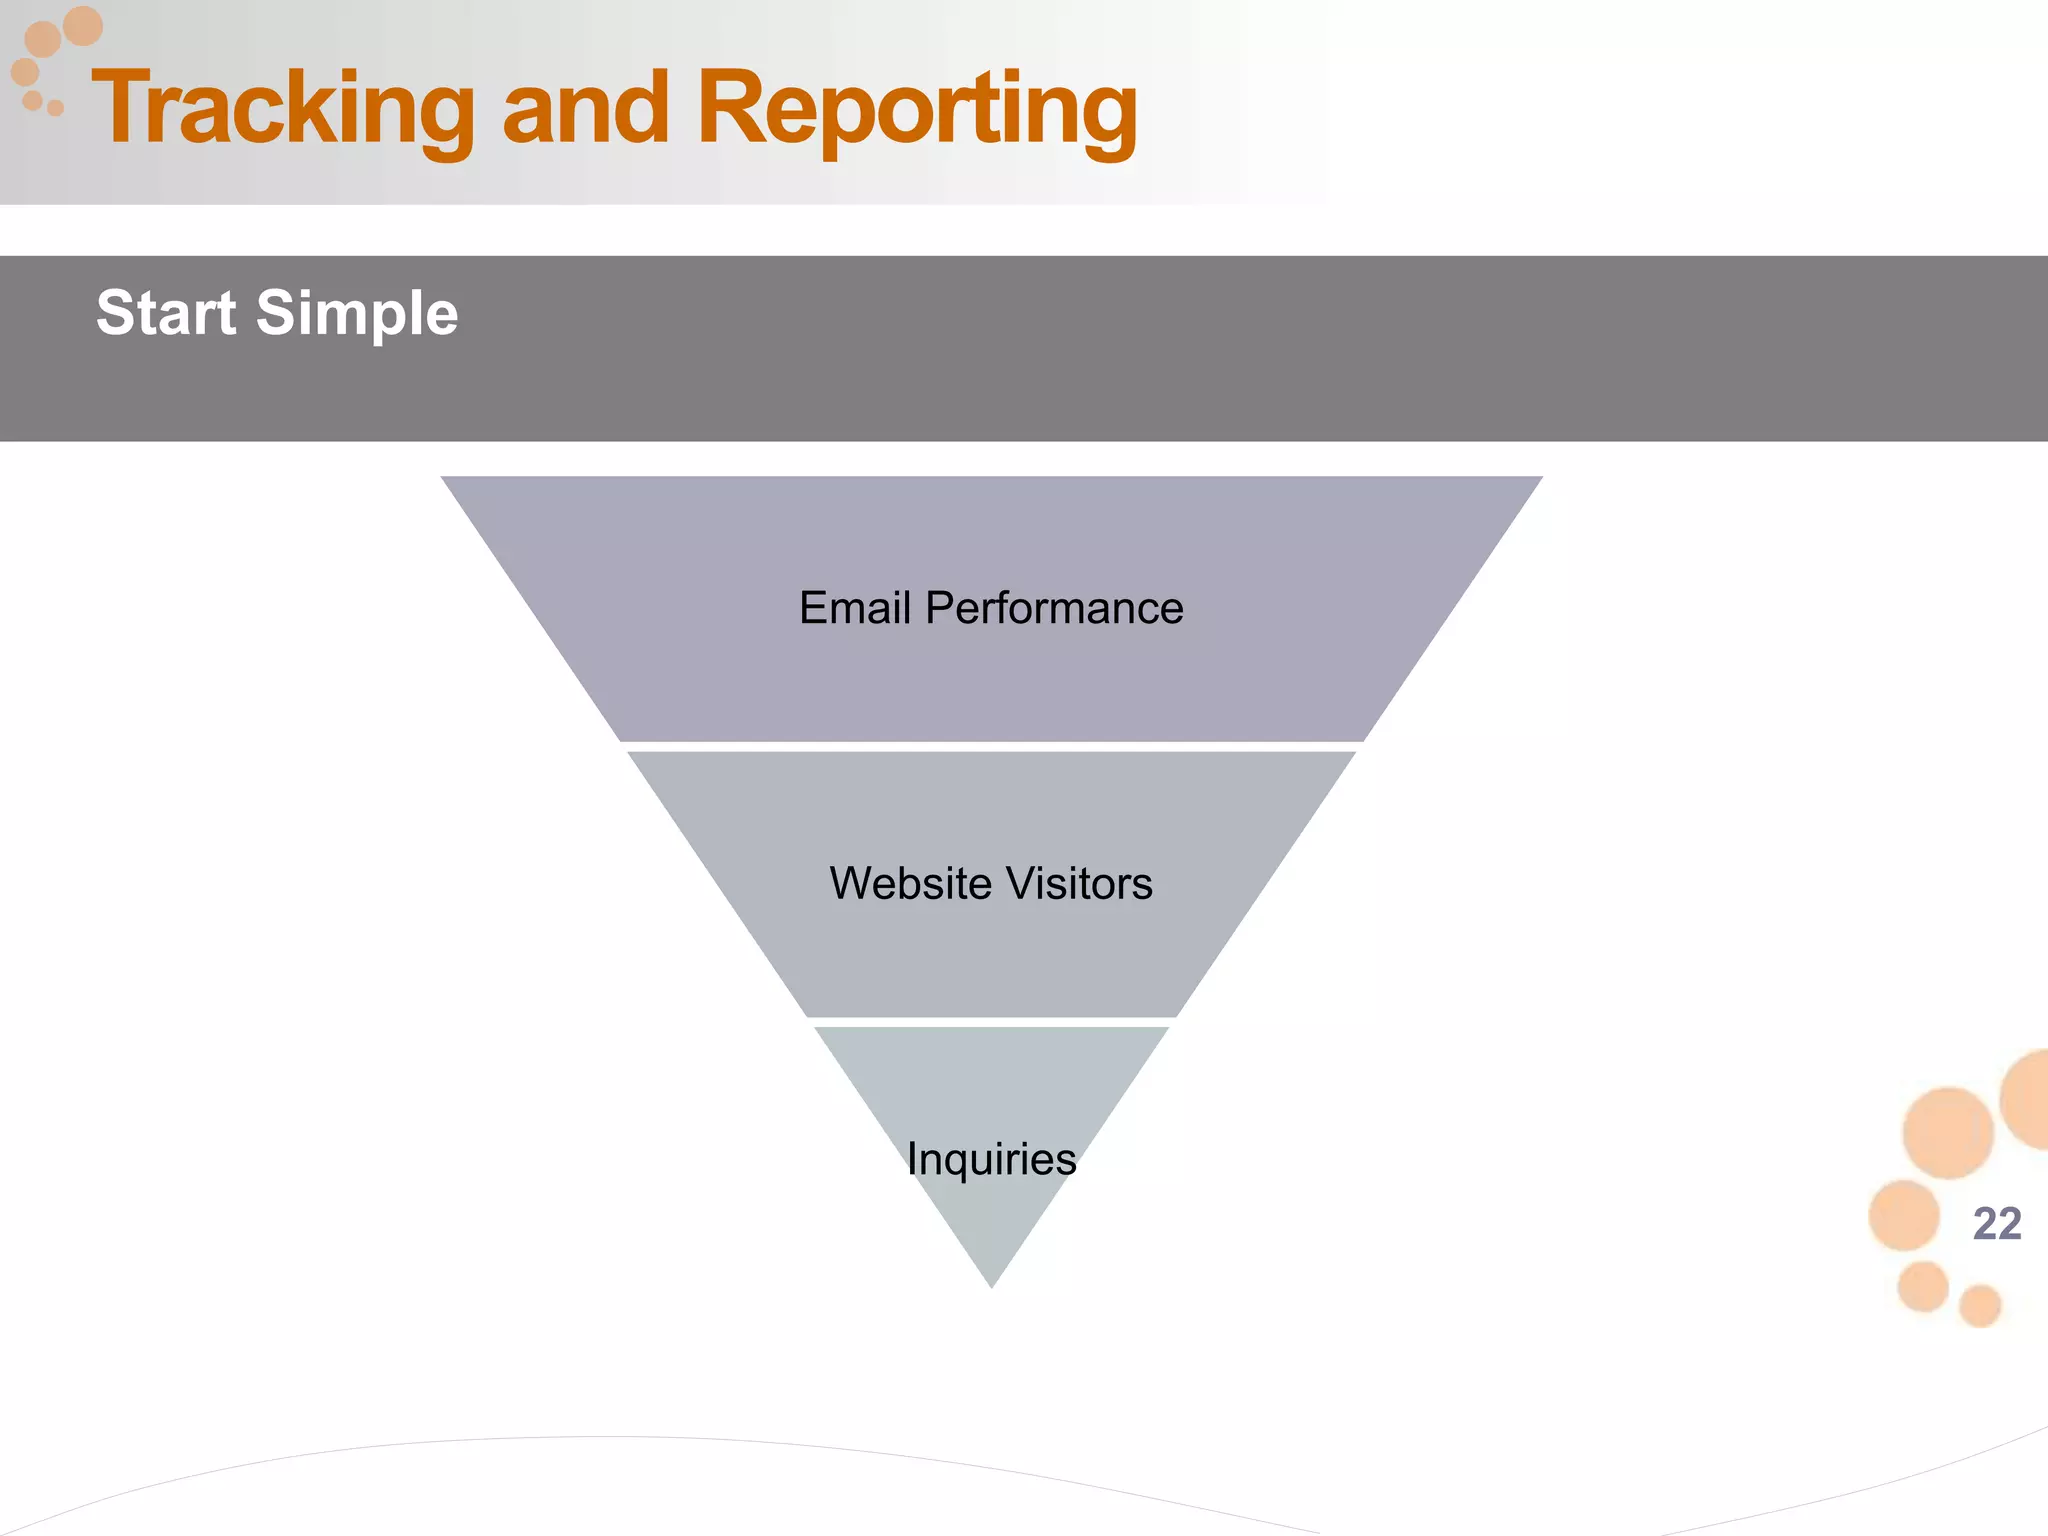
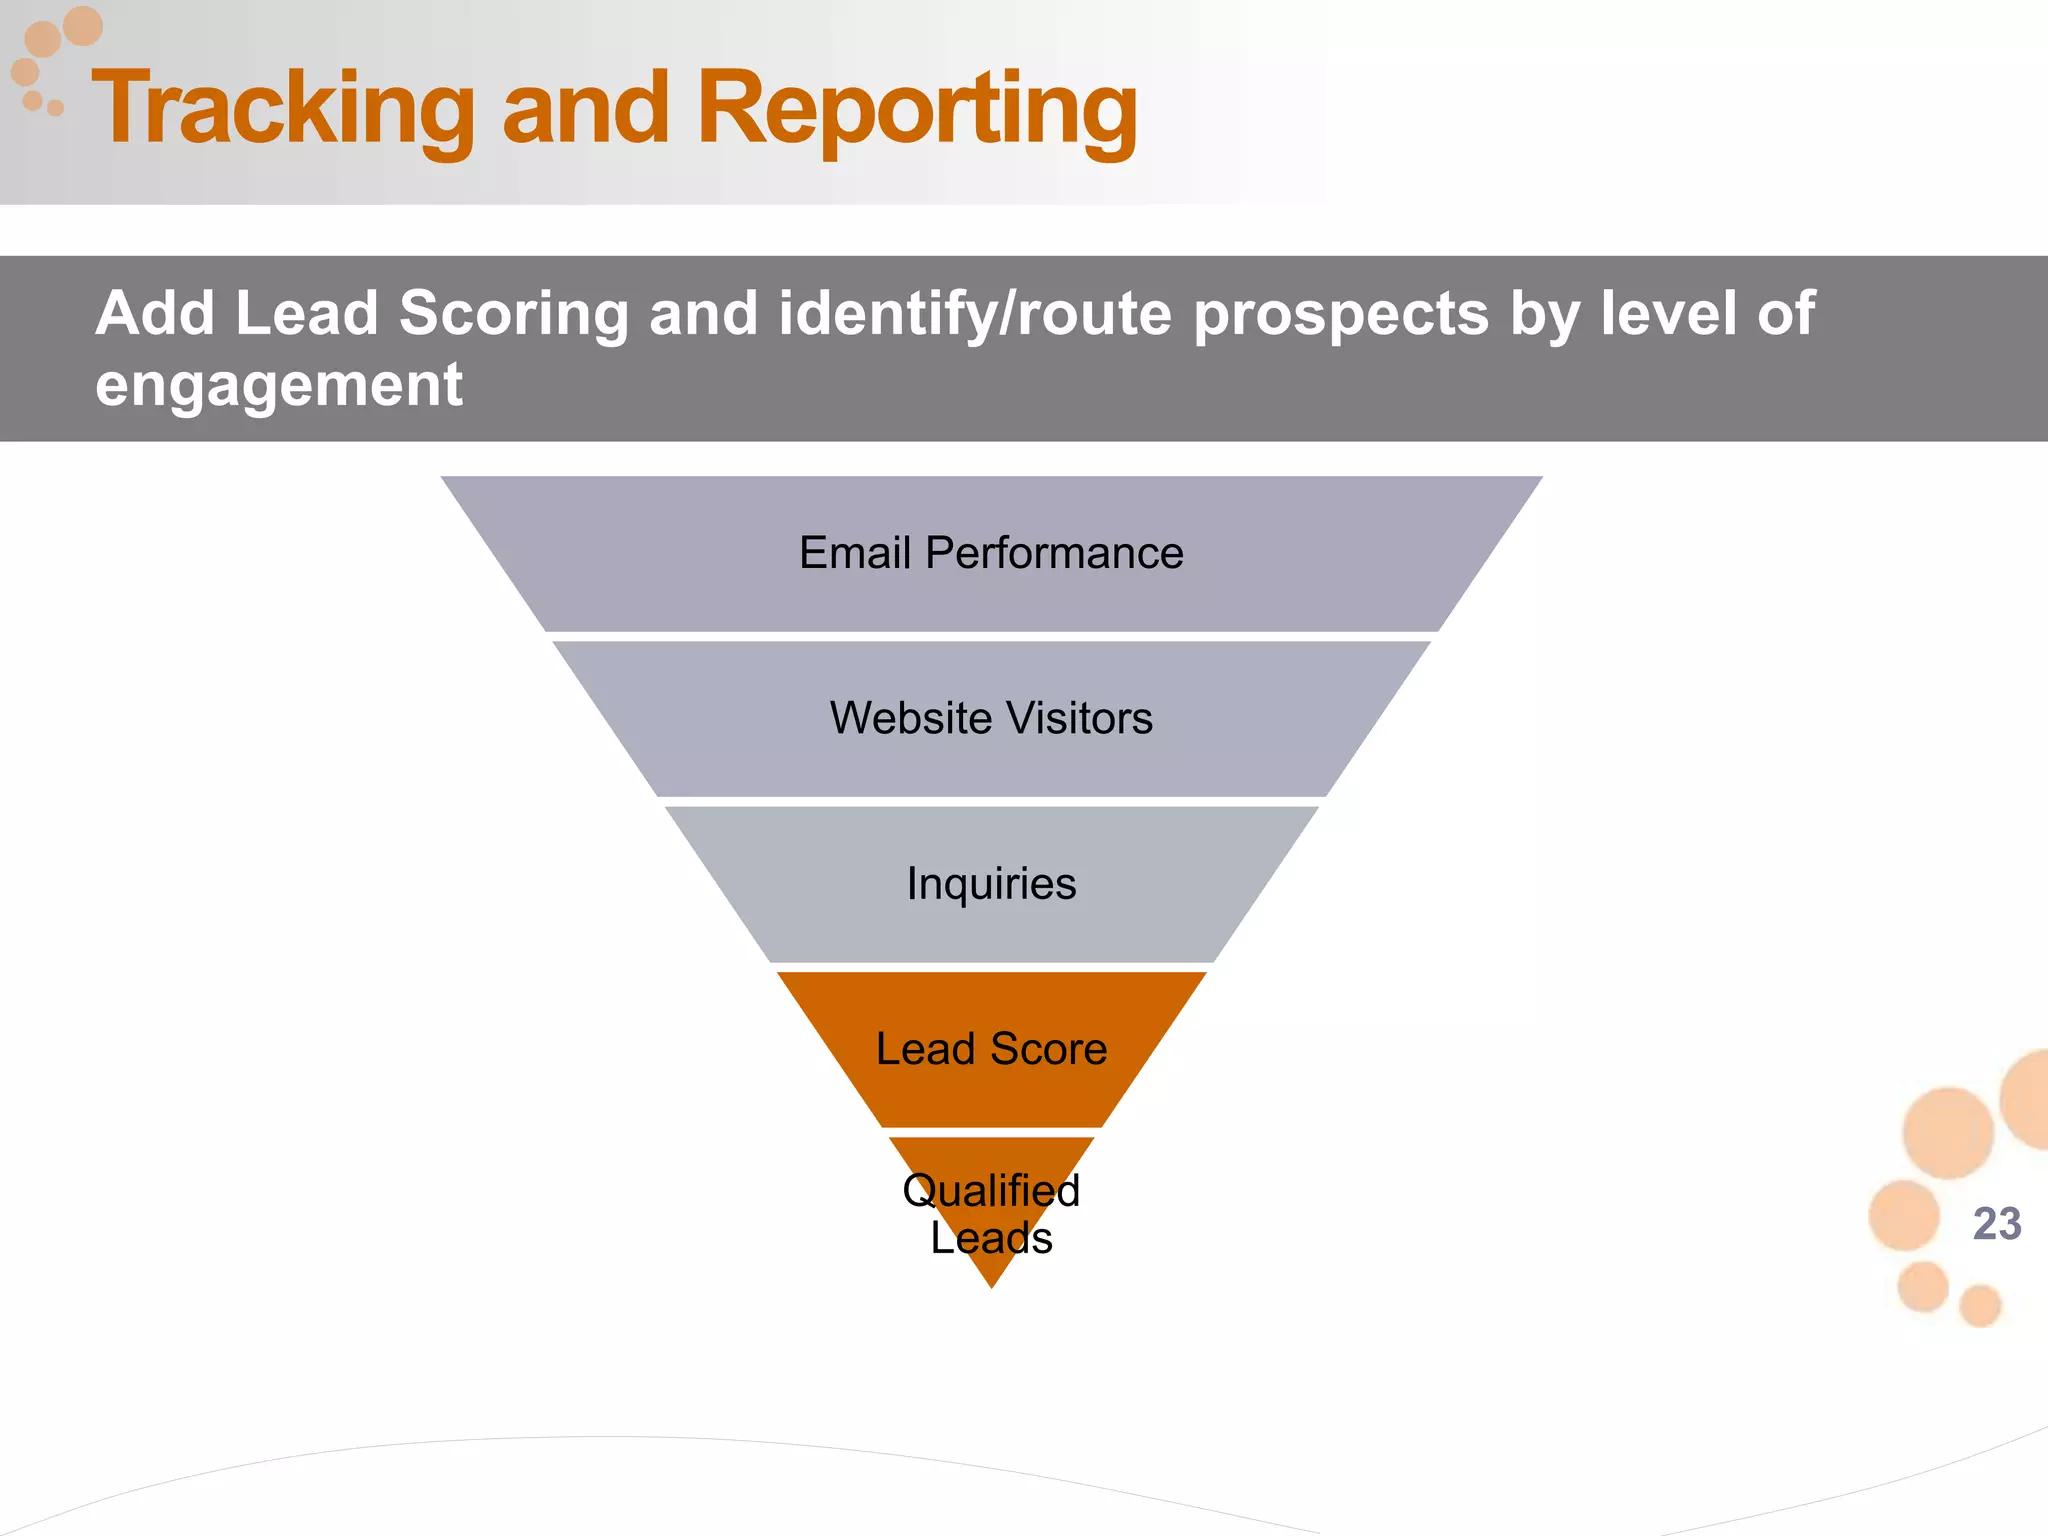
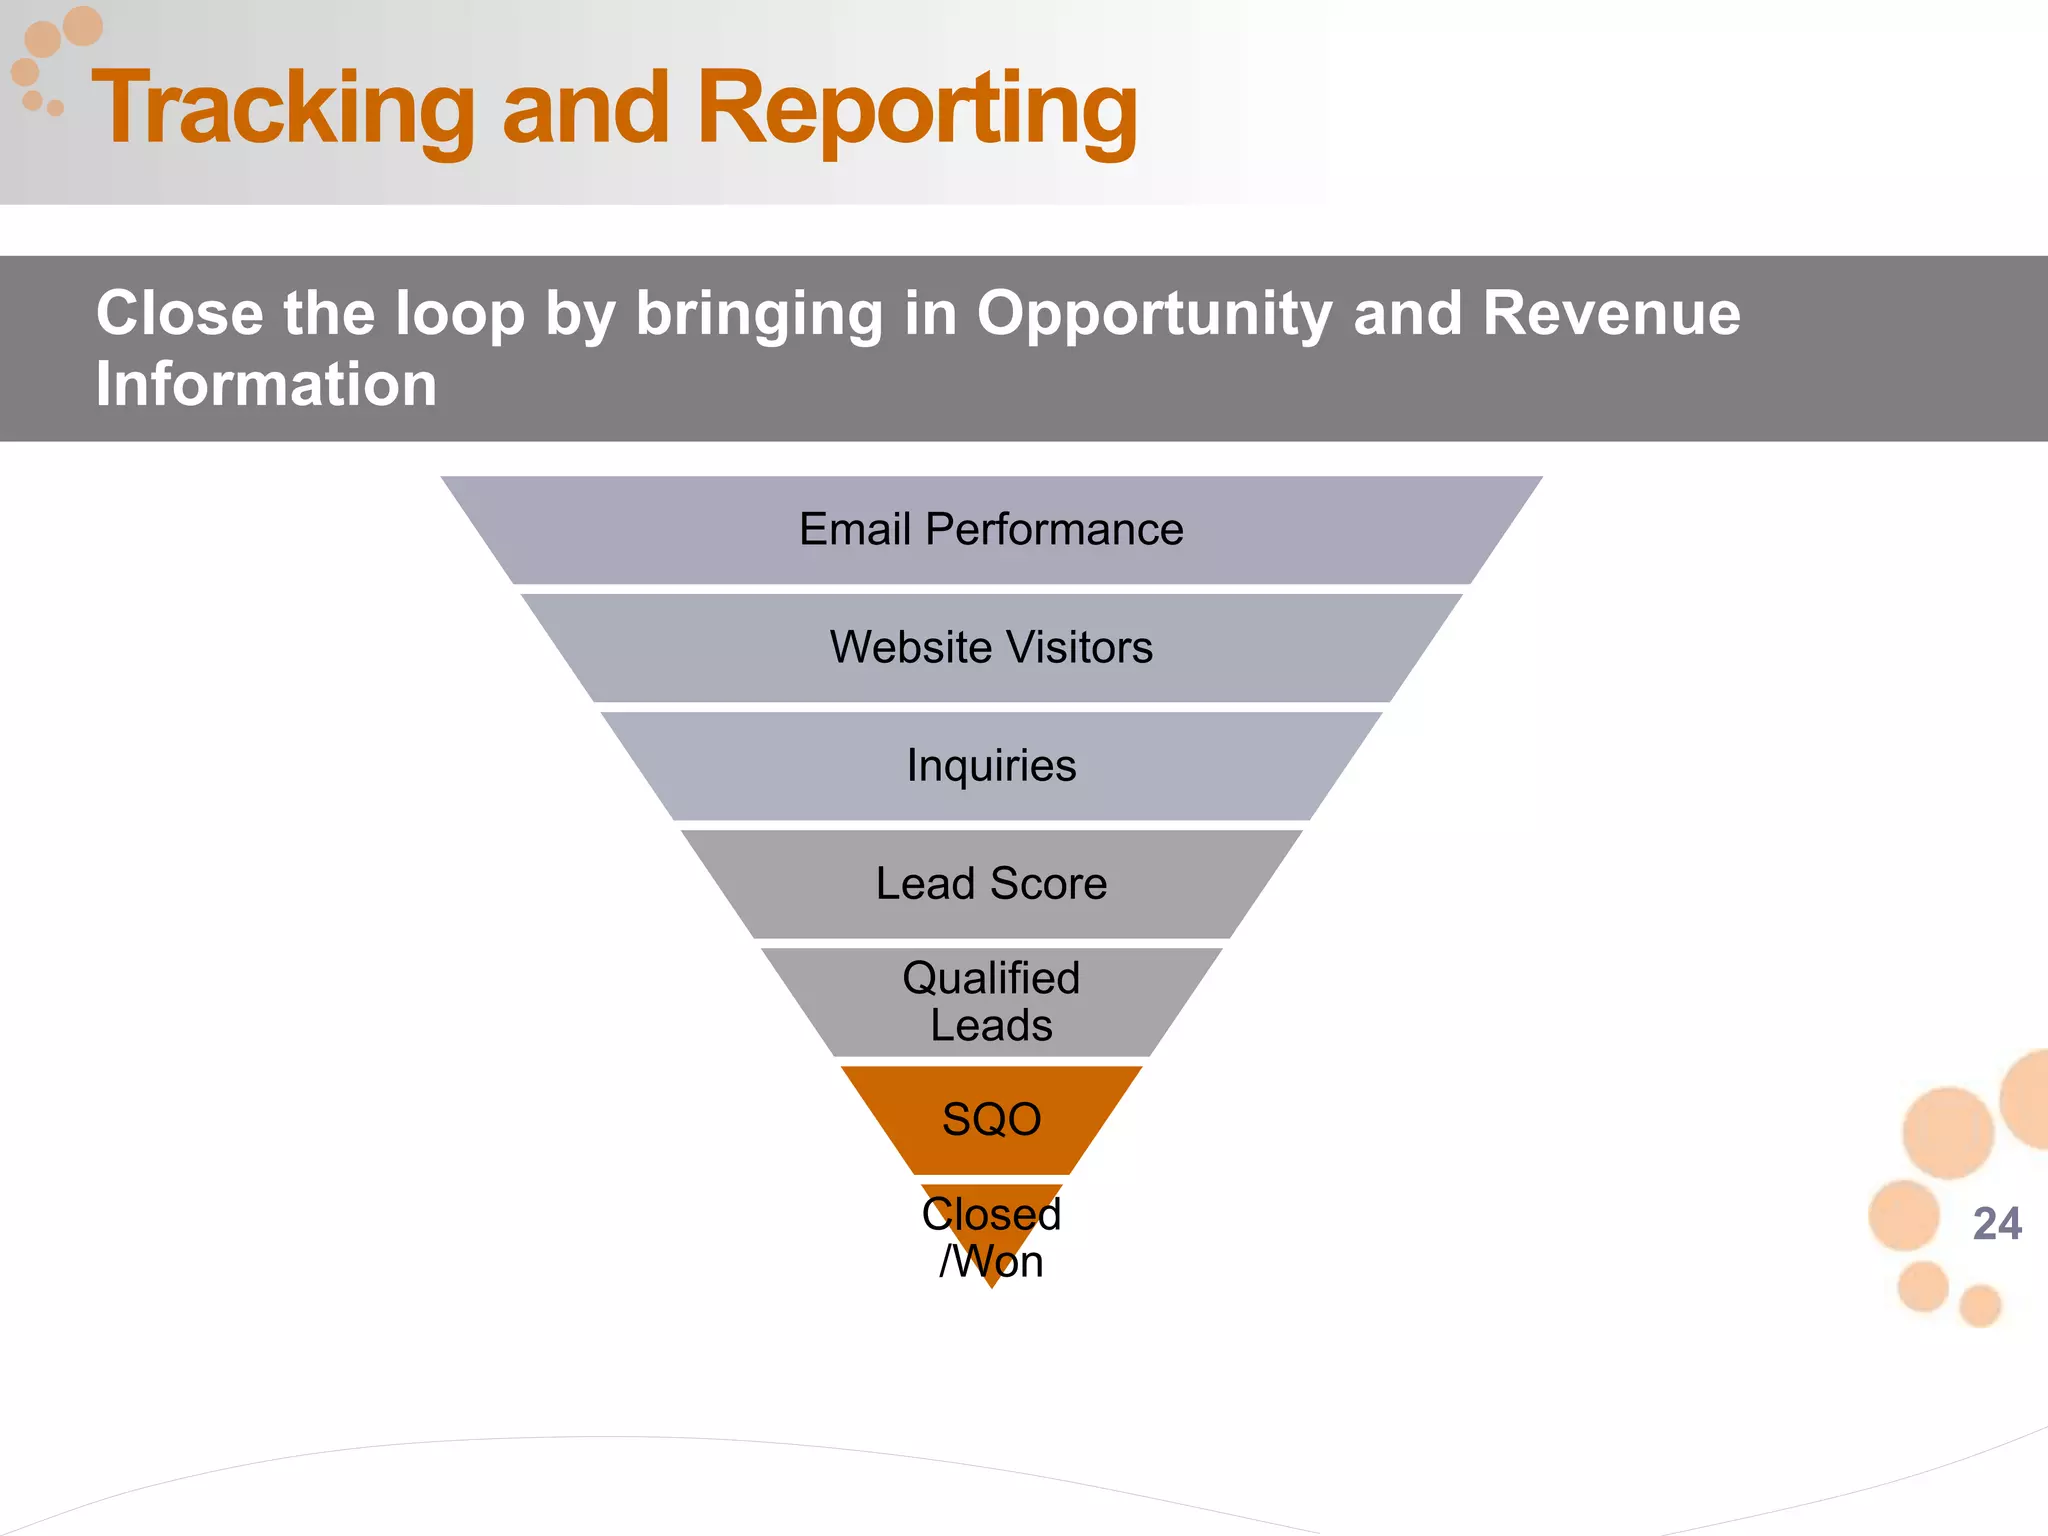
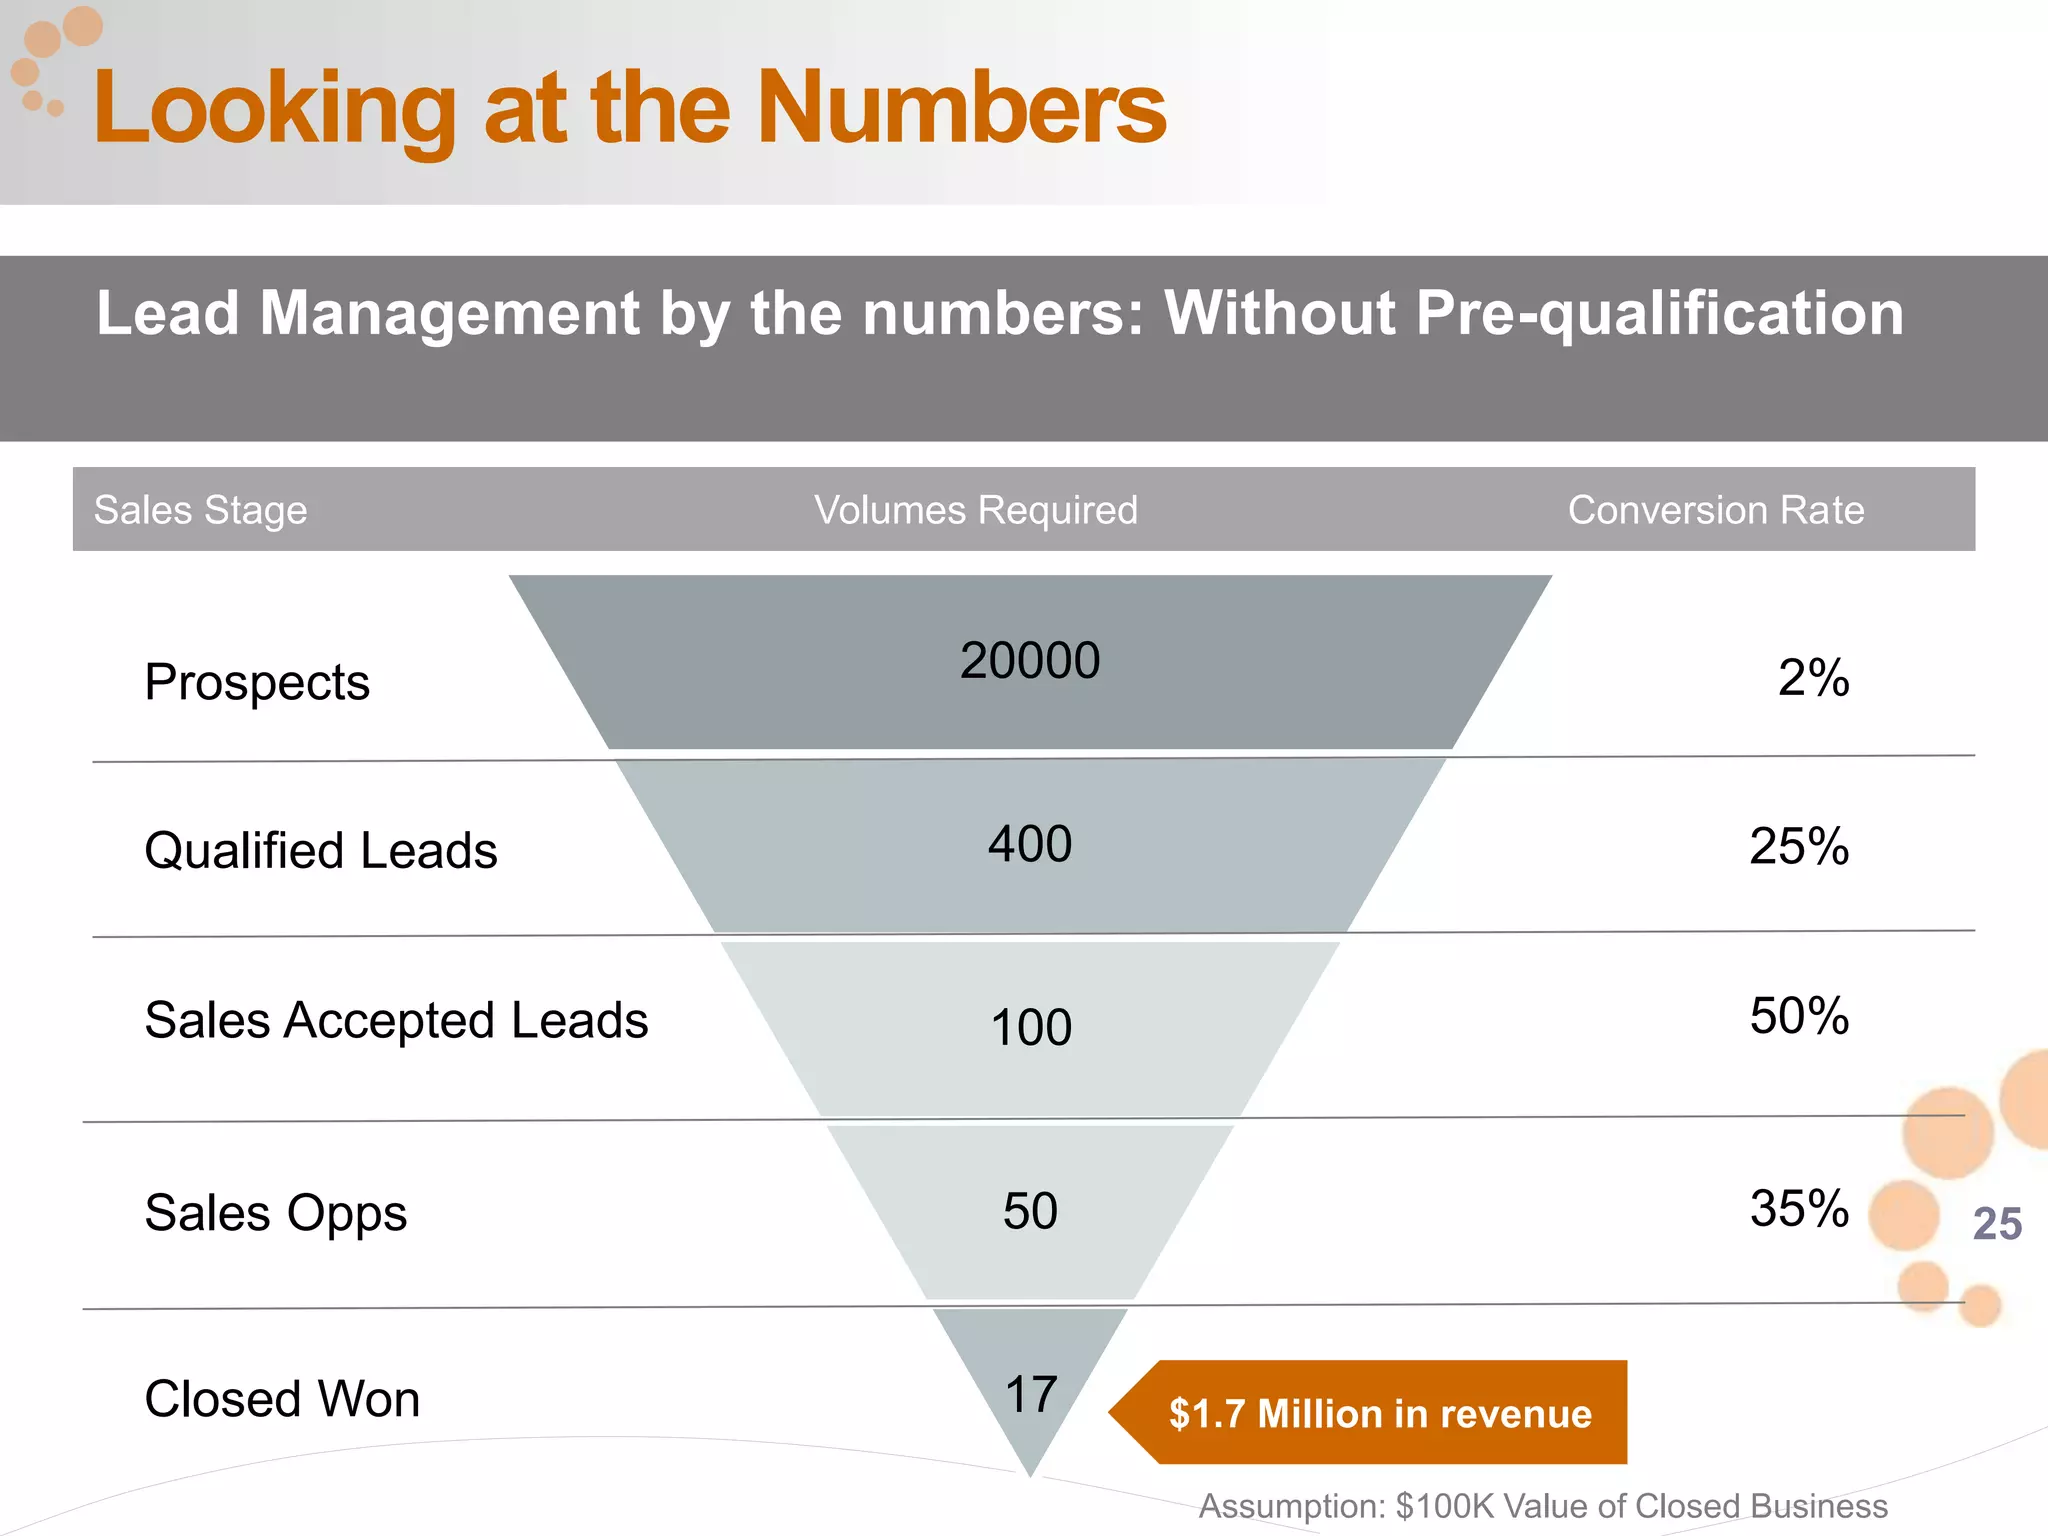
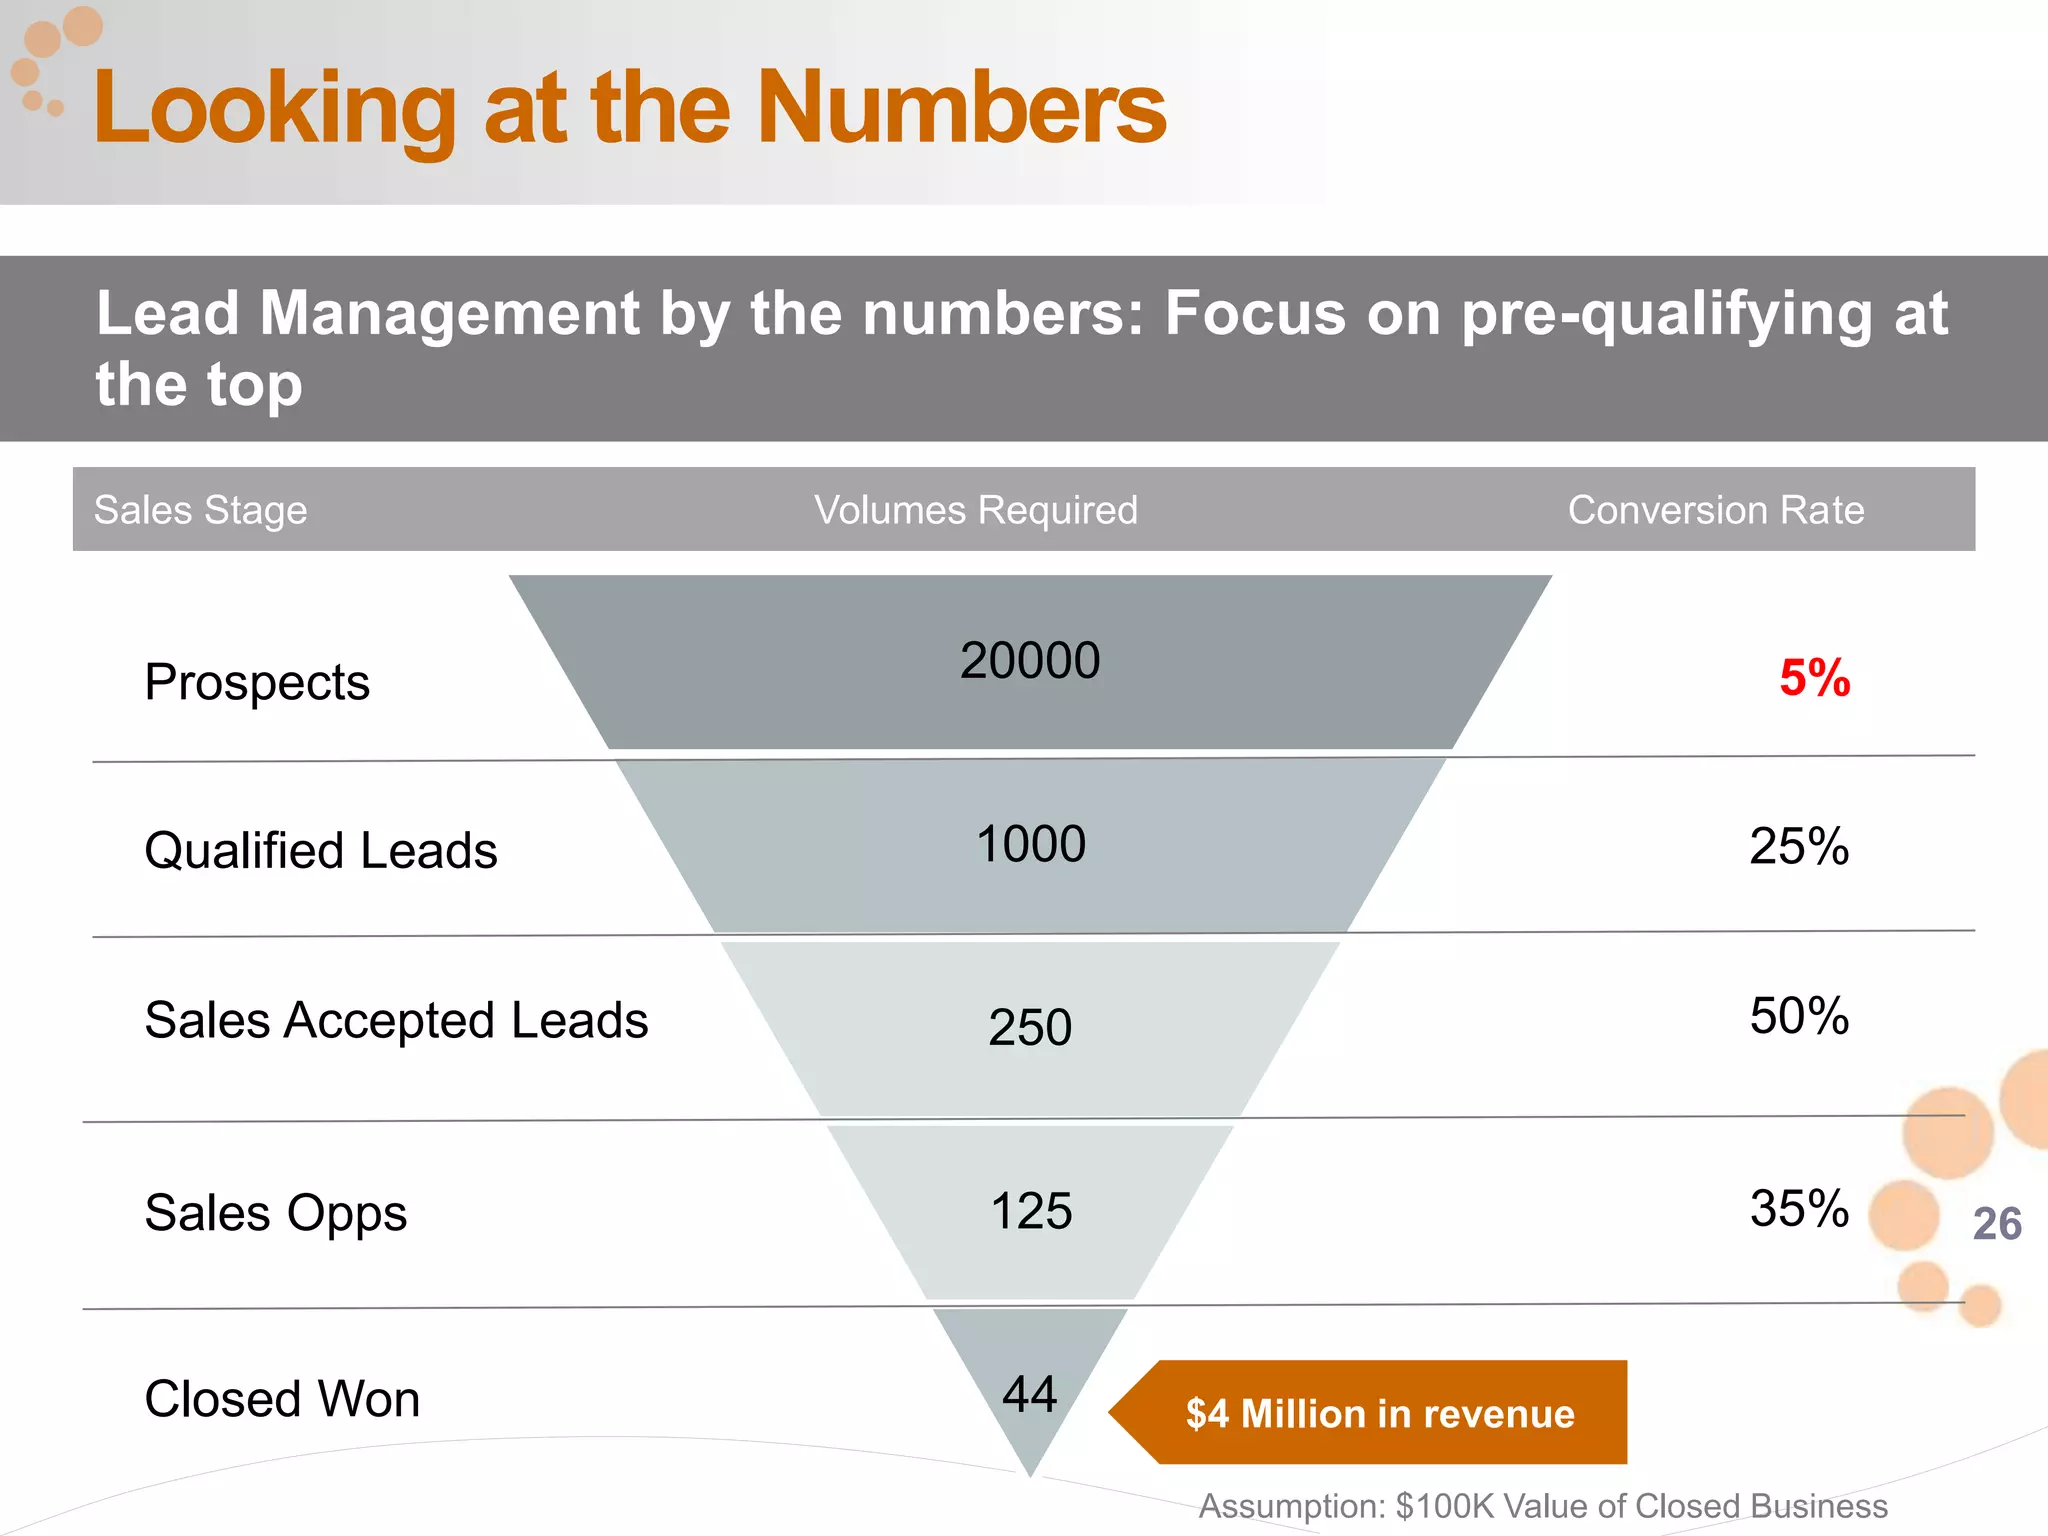
A Digital Solutions Firm delivering
Marketing and Technology Solutions
New York . Toronto . Phoenix . Los Angeles . London. Dubai . New Delhi
A Success Plan for Extracting Maximum
Value out of Marketing Automation
A Webinar
1
1. The Challenge withMarketing Automation technologies
2. Our Approach
3. Key Components ina Success Plan
Agenda
22
What the Research
is telling us
3
Pressures driving B2B Marketers to automation
4
85 The percentage of b-to-b marketers that describe themselves as
“self-taught” professionals.
81 The percentage of b-to-b organizations that spend $1,000 or less
per year on marketing skills development.
25 The percentage of organizations that have purchased marketing
automation that are utilizing it to the fullest.
7x The gap in waterfall performance (inquiry-to-close ratio) between
average and best-in-class organizations.
B2B marketing – a reality check
Only 25% of organizations are fully realizing the potential of their
Marketing Automation Platform – Sirius Decisions
- Sirius Decisions
5
The Reward of Higher Revenue
Best-in-Class Organizations deliver a 79% improved company
wide revenue growth
6
It’s a Journey!
To build a fully optimized and automated marketing machine
that drives revenue you need a roadmap
Random Acts of Marketing
Disconnected Processes and Tactics
Low visibility into effectiveness
Where you are today
Where you want to be
7
Job#1 – Blueprint and Framework
 Current State:
 Understand & document Current State
 How do your customers decide to buy today?
 How are sales leads generated today?
 What does a good lead look like to sales?
 What is marketing's role in this process?
 How are leads qualified for inside/field sales?
 What happens to dormant/inactive leads?
 Future State: Design an Achievable & Measurable Future State
 Where do you want to be in 1,2,3 years?
 Buyer Needs, Organization, Processes, Metrics, Technology
 Getting There:
Steps & Milestones along the way with measurable progress
Creating the Roadmap
8
Our Approach
Create a strong foundation for lead management based on a
deep understanding of business needs
ActivitiesDeliverables
• Project Vision
• Requirements
• Business
process
design
• Install and
integrate
systems
• Documentation
• Campaigns
• Campaigns
9
Typical Roadmap
Q1 Q2 Q3
Strategy and Planning
Plan and Design Demand Gen Framework
Campaigns
Launch
Lead Forward/Revenue Back Database Analysis
CM (Customer) Campaign Planning
Vertical-specific (Acquisition) Campaign Planning
Install and Integrate
Launch Campaigns
Evaluate and Optimize
Plan and Design Reporting/Analysis Framework
Ongoing Refinement
Lead Management
Marketing Measurement
Campaign Management
Initial Planning and Installation
Install and Configure Marketing Automation
• Data Model
• Email Templates
• Form and Landing Pages
• Lead Scoring V1.0
• Web Form Integration
• CRM Integration
Vertical-specific (Acquisition) Campaign
CM Campaign
Real-time Sales Alerts
Sales Lead Queues
Scoring and Routing
Closed-loop Reporting
Lead Scoring Review and Adjustment
Evaluate Sales Impact and Adoption
Add new campaigns
Process Adjustment
1010
Key Components
11
1. Who is the Customer?
2. What does the Buying Process look like?
3. Content Strategy
4. Lead Management Architecture
5. Where does Marketing Automation Fit? (Integration)
6. Campaign Planning
7. Track, Measure and Optimize
Key Components of the Framework
12
1. A Lead Forward, Revenue back analysis will not only
provide insights into a lead management process but will
also tell you who your ideal customer is
2. Criteria:
 Technical Buyer, Economic Buyer, User Buyer, Coach
 Job Role/Function
 Industry
 Motivations
 Pain Points
Who is Your Customer?
Define your Ideal Customer Profile
13
Understand the Buying Process
By identifying who our customers are and how they buy will
help us segment and map out the way we engage with them
$$Prospect
Qualified
Lead
Sales
Accepted
Lead (SAL)
Suspect
Sales
Qualified
Opportunity
(SQO)
Evaluate PurchaseLearn JustifyInterest
Customer’s
Buying
Process
Sales &
Marketing
Process
Marketing
validates
quality of
interest
Marketing
nurtures to
sales ready
Sales
validates and
accepts
ownership
Sales
validates
BANT criteria
Sales closes
revenue
opportunity
COLD WARM HOT
14
Develop a Content Strategy
Content…in context
15
Develop a Content Strategy
Content…with a purpose: Assemble and categorize content by
objective
Attract Qualify Nurture
16
Lead Management Architecture
Create an Automated Lead Management System that nurtures
and moves prospects through the buying cycle to close
Lead
Creation
Thank
You
Follow-up
Pre-
Qual
Score
Sales
(Qual)
Nurture
I
Nurture
II
Nurture
III
Nurture
IV
LOSS
ND
YES
NO NO
CONTACT
ME
CONTACT
ME
CONTACT
ME
CONTACT
ME
Close
CONTACT
ME
CONTACT
ME
Whitepapers
Facebook/PPC/DM/Telesales/Banners to site
General website
Outbound Programs
Online Events
Tradeshows
Intro I
CONTACT
ME
Other sources
( D&B List Buy, Association Lists, Partner Channels)
SFDC MAP
17
Lead Management Architecture
Continue to communicate to Customers with relevant,
personalized and timely communications
Data
Standardize
+ Segment Email?
Other
Channels
Drive to
Web
CM
Nurture
I
CM
Nurture
II
NO
Yes
Customer
Referral
SFDC MAPData
Feed
Data
Sign Up
CM
Nurture
III
• Communicate changes in program / product terms &
conditions via targeted email
• Execute servicing & marketing client level
communications via email
• Advocacy and Referral Campaigns
• Email Opt-in/Preference Center
• Bill Paper-off Campaigns
• Delinquency alerts
WEB
• Benefits:
• Reduce costs across all communications;
improved ROI
• Improve customer experience through
relevancy of communications to clients
18
Where does MA fit?
19
Integrate the Tools
Integrate platforms for a common view of the customer across
channels
20
Campaign Planning
Map your messages
21
Create a Calendar of Activities
Volume and Velocity of activity is critical as multiple interactions
result in better scoring and identifies highly engaged prospects
22
Email Performance
Website Visitors
Inquiries
Tracking and Reporting
Start Simple
23
Email Performance
Website Visitors
Inquiries
Lead Score
Qualified
Leads
Tracking and Reporting
Add Lead Scoring and identify/route prospects by level of
engagement
24
Email Performance
Website Visitors
Inquiries
Lead Score
Qualified
Leads
SQO
Closed
/Won
Tracking and Reporting
Close the loop by bringing in Opportunity and Revenue
Information
25
20000
400
100
50
17
Looking at the Numbers
Lead Management by the numbers: Without Pre-qualification
Sales Stage Volumes Required Conversion Rate
Prospects
Qualified Leads
Sales Accepted Leads
Sales Opps
Closed Won
2%
25%
50%
35%
$1.7 Million in revenue
Assumption: $100K Value of Closed Business
26
20000
1000
250
125
44
Looking at the Numbers
Lead Management by the numbers: Focus on pre-qualifying at
the top
Sales Stage Volumes Required Conversion Rate
Prospects
Qualified Leads
Sales Accepted Leads
Sales Opps
Closed Won
5%
25%
50%
35%
$4 Million in revenue
Assumption: $100K Value of Closed Business
27
20000
1000
650
325
114
Looking at the Numbers
Lead Management by the numbers: Common definitions of
Qualification Criteria between Marketing and Sales
Sales Stage Volumes Required Conversion Rate
Prospects
Qualified Leads
Sales Accepted Leads
Sales Opps
Closed Won
5%
65%
50%
35%
$11 Million in revenue
Assumption: $100K Value of Closed Business
28
Finally… but most important
Empower your sales team
Courtesy: Eloqua Discover for Salesforce
29
Connect with us
1-877-339-6264
www.edynamic.net
contact@edynamic.net
twitter.com/edynamic
youtube.com/1999dynamic
facebook.com/edynamic.net

Extracting Maximum Value out of Marketing Automation

  • 1.
    A Digital SolutionsFirm delivering Marketing and Technology Solutions New York . Toronto . Phoenix . Los Angeles . London. Dubai . New Delhi A Success Plan for Extracting Maximum Value out of Marketing Automation A Webinar
  • 2.
    1 1. The ChallengewithMarketing Automation technologies 2. Our Approach 3. Key Components ina Success Plan Agenda
  • 3.
  • 4.
    3 Pressures driving B2BMarketers to automation
  • 5.
    4 85 The percentageof b-to-b marketers that describe themselves as “self-taught” professionals. 81 The percentage of b-to-b organizations that spend $1,000 or less per year on marketing skills development. 25 The percentage of organizations that have purchased marketing automation that are utilizing it to the fullest. 7x The gap in waterfall performance (inquiry-to-close ratio) between average and best-in-class organizations. B2B marketing – a reality check Only 25% of organizations are fully realizing the potential of their Marketing Automation Platform – Sirius Decisions - Sirius Decisions
  • 6.
    5 The Reward ofHigher Revenue Best-in-Class Organizations deliver a 79% improved company wide revenue growth
  • 7.
    6 It’s a Journey! Tobuild a fully optimized and automated marketing machine that drives revenue you need a roadmap Random Acts of Marketing Disconnected Processes and Tactics Low visibility into effectiveness Where you are today Where you want to be
  • 8.
    7 Job#1 – Blueprintand Framework  Current State:  Understand & document Current State  How do your customers decide to buy today?  How are sales leads generated today?  What does a good lead look like to sales?  What is marketing's role in this process?  How are leads qualified for inside/field sales?  What happens to dormant/inactive leads?  Future State: Design an Achievable & Measurable Future State  Where do you want to be in 1,2,3 years?  Buyer Needs, Organization, Processes, Metrics, Technology  Getting There: Steps & Milestones along the way with measurable progress Creating the Roadmap
  • 9.
    8 Our Approach Create astrong foundation for lead management based on a deep understanding of business needs ActivitiesDeliverables • Project Vision • Requirements • Business process design • Install and integrate systems • Documentation • Campaigns • Campaigns
  • 10.
    9 Typical Roadmap Q1 Q2Q3 Strategy and Planning Plan and Design Demand Gen Framework Campaigns Launch Lead Forward/Revenue Back Database Analysis CM (Customer) Campaign Planning Vertical-specific (Acquisition) Campaign Planning Install and Integrate Launch Campaigns Evaluate and Optimize Plan and Design Reporting/Analysis Framework Ongoing Refinement Lead Management Marketing Measurement Campaign Management Initial Planning and Installation Install and Configure Marketing Automation • Data Model • Email Templates • Form and Landing Pages • Lead Scoring V1.0 • Web Form Integration • CRM Integration Vertical-specific (Acquisition) Campaign CM Campaign Real-time Sales Alerts Sales Lead Queues Scoring and Routing Closed-loop Reporting Lead Scoring Review and Adjustment Evaluate Sales Impact and Adoption Add new campaigns Process Adjustment
  • 11.
  • 12.
    11 1. Who isthe Customer? 2. What does the Buying Process look like? 3. Content Strategy 4. Lead Management Architecture 5. Where does Marketing Automation Fit? (Integration) 6. Campaign Planning 7. Track, Measure and Optimize Key Components of the Framework
  • 13.
    12 1. A LeadForward, Revenue back analysis will not only provide insights into a lead management process but will also tell you who your ideal customer is 2. Criteria:  Technical Buyer, Economic Buyer, User Buyer, Coach  Job Role/Function  Industry  Motivations  Pain Points Who is Your Customer? Define your Ideal Customer Profile
  • 14.
    13 Understand the BuyingProcess By identifying who our customers are and how they buy will help us segment and map out the way we engage with them $$Prospect Qualified Lead Sales Accepted Lead (SAL) Suspect Sales Qualified Opportunity (SQO) Evaluate PurchaseLearn JustifyInterest Customer’s Buying Process Sales & Marketing Process Marketing validates quality of interest Marketing nurtures to sales ready Sales validates and accepts ownership Sales validates BANT criteria Sales closes revenue opportunity COLD WARM HOT
  • 15.
    14 Develop a ContentStrategy Content…in context
  • 16.
    15 Develop a ContentStrategy Content…with a purpose: Assemble and categorize content by objective Attract Qualify Nurture
  • 17.
    16 Lead Management Architecture Createan Automated Lead Management System that nurtures and moves prospects through the buying cycle to close Lead Creation Thank You Follow-up Pre- Qual Score Sales (Qual) Nurture I Nurture II Nurture III Nurture IV LOSS ND YES NO NO CONTACT ME CONTACT ME CONTACT ME CONTACT ME Close CONTACT ME CONTACT ME Whitepapers Facebook/PPC/DM/Telesales/Banners to site General website Outbound Programs Online Events Tradeshows Intro I CONTACT ME Other sources ( D&B List Buy, Association Lists, Partner Channels) SFDC MAP
  • 18.
    17 Lead Management Architecture Continueto communicate to Customers with relevant, personalized and timely communications Data Standardize + Segment Email? Other Channels Drive to Web CM Nurture I CM Nurture II NO Yes Customer Referral SFDC MAPData Feed Data Sign Up CM Nurture III • Communicate changes in program / product terms & conditions via targeted email • Execute servicing & marketing client level communications via email • Advocacy and Referral Campaigns • Email Opt-in/Preference Center • Bill Paper-off Campaigns • Delinquency alerts WEB • Benefits: • Reduce costs across all communications; improved ROI • Improve customer experience through relevancy of communications to clients
  • 19.
  • 20.
    19 Integrate the Tools Integrateplatforms for a common view of the customer across channels
  • 21.
  • 22.
    21 Create a Calendarof Activities Volume and Velocity of activity is critical as multiple interactions result in better scoring and identifies highly engaged prospects
  • 23.
  • 24.
    23 Email Performance Website Visitors Inquiries LeadScore Qualified Leads Tracking and Reporting Add Lead Scoring and identify/route prospects by level of engagement
  • 25.
    24 Email Performance Website Visitors Inquiries LeadScore Qualified Leads SQO Closed /Won Tracking and Reporting Close the loop by bringing in Opportunity and Revenue Information
  • 26.
    25 20000 400 100 50 17 Looking at theNumbers Lead Management by the numbers: Without Pre-qualification Sales Stage Volumes Required Conversion Rate Prospects Qualified Leads Sales Accepted Leads Sales Opps Closed Won 2% 25% 50% 35% $1.7 Million in revenue Assumption: $100K Value of Closed Business
  • 27.
    26 20000 1000 250 125 44 Looking at theNumbers Lead Management by the numbers: Focus on pre-qualifying at the top Sales Stage Volumes Required Conversion Rate Prospects Qualified Leads Sales Accepted Leads Sales Opps Closed Won 5% 25% 50% 35% $4 Million in revenue Assumption: $100K Value of Closed Business
  • 28.
    27 20000 1000 650 325 114 Looking at theNumbers Lead Management by the numbers: Common definitions of Qualification Criteria between Marketing and Sales Sales Stage Volumes Required Conversion Rate Prospects Qualified Leads Sales Accepted Leads Sales Opps Closed Won 5% 65% 50% 35% $11 Million in revenue Assumption: $100K Value of Closed Business
  • 29.
    28 Finally… but mostimportant Empower your sales team Courtesy: Eloqua Discover for Salesforce
  • 30.

Editor's Notes

  • #7 But the benefits of doing it right are enormous. Engaging your customer with personalized messaging and timely communications generates a 2 to 3 times For best in class organizations, average performance in terms of revenue was 59%. If you look at the industry average, the average performance increase was just 9% So the question then is how do you there?