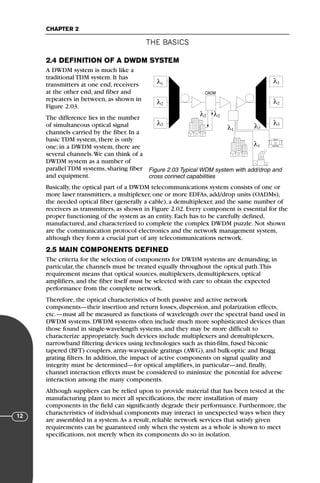
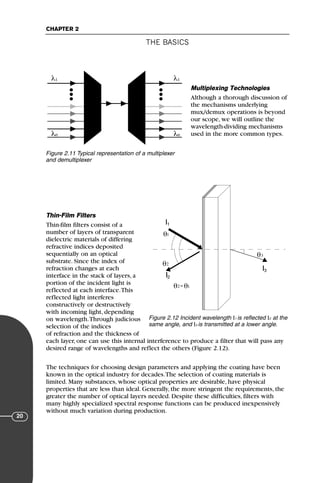
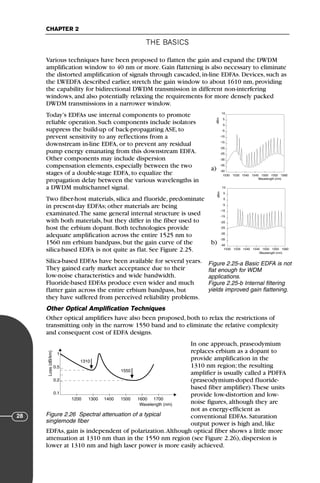
This document appears to be a chapter from a book or manual on optical communications and wavelength-division multiplexing (WDM) technology. It contains:
1) An introductory section providing background on the history and development of optical communications and WDM technology.
2) A table of contents listing the various sections and subsections within the chapter, including discussions of the basics of WDM systems, critical parameters, component testing, and more.
3) Credits for the authors and production team responsible for the publication.
The document provides an overview of the content covered in the chapter on the fundamentals and testing of WDM components and systems.


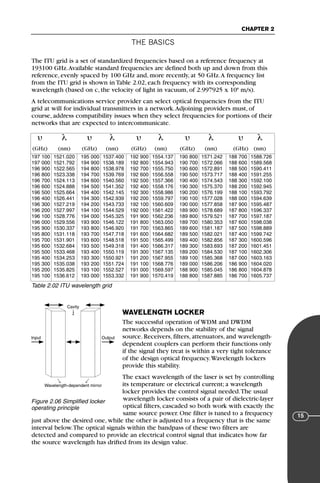


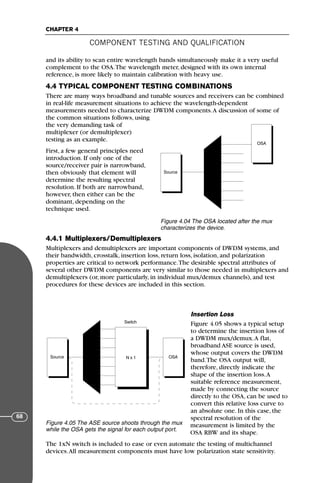
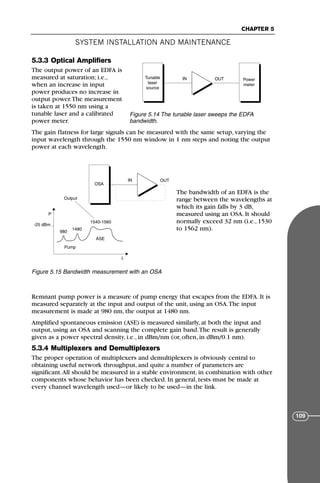
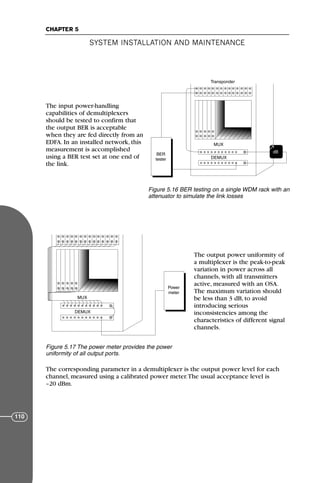
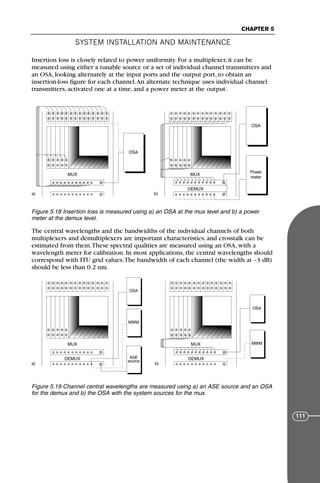
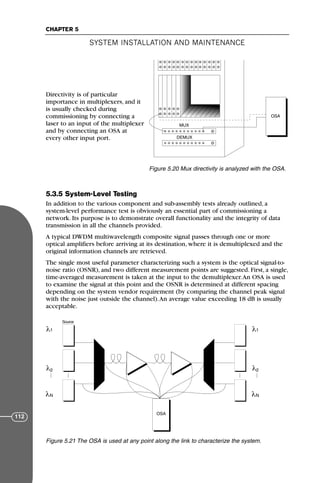
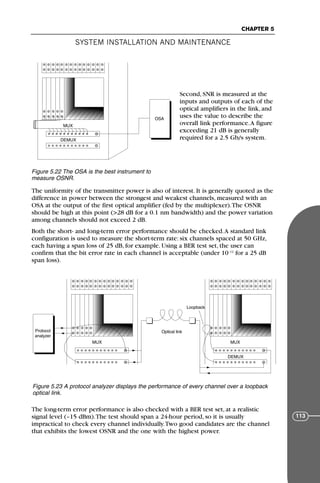
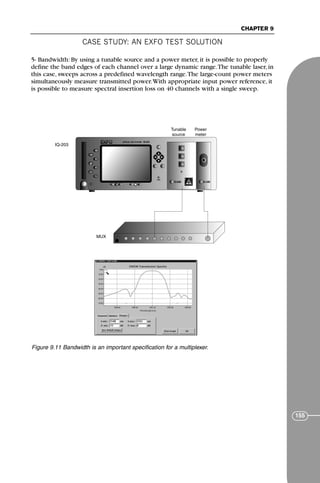
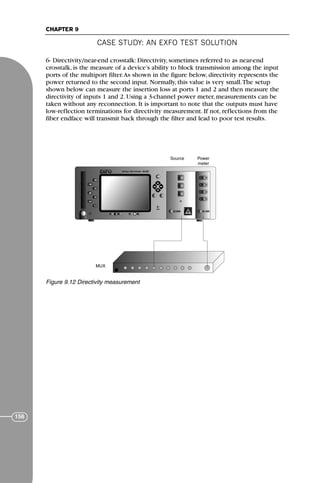
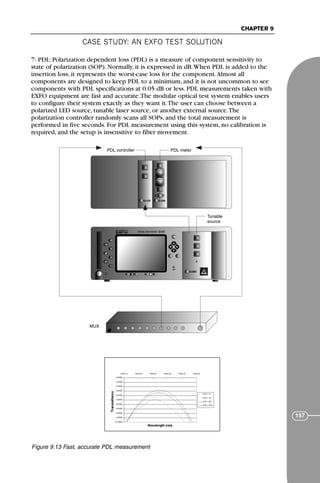
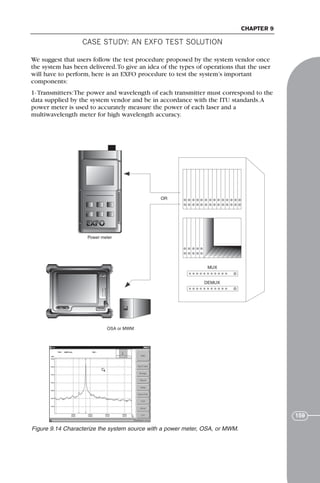
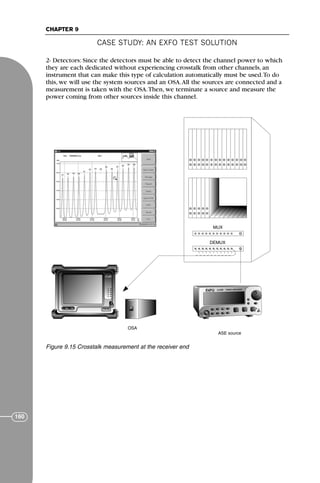
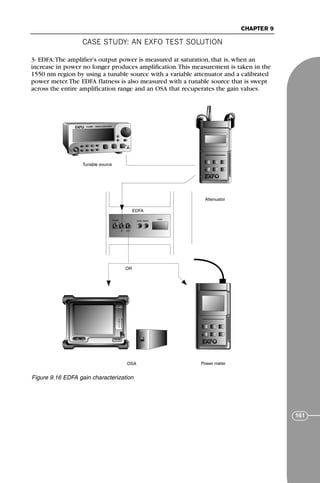
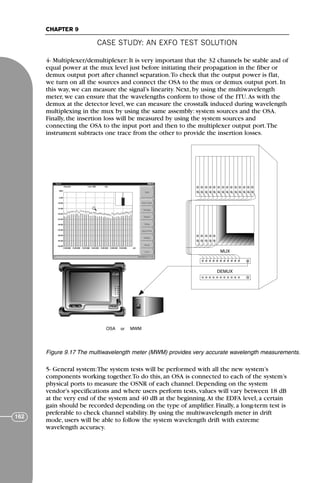
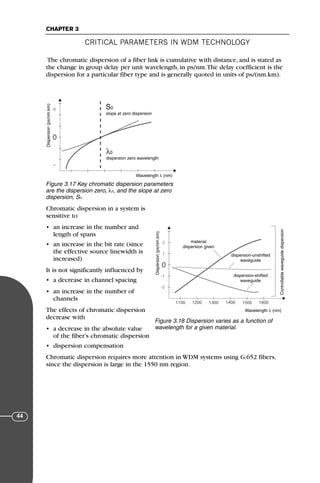
![CRITICAL PARAMETERS IN WDM TECHNOLOGY
CHAPTER 3
36
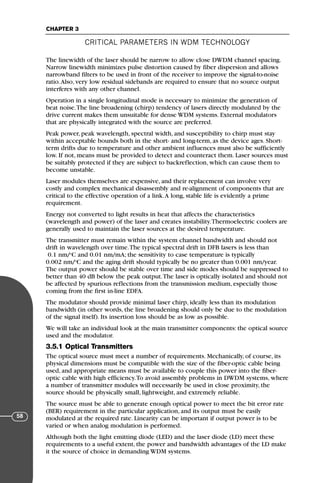
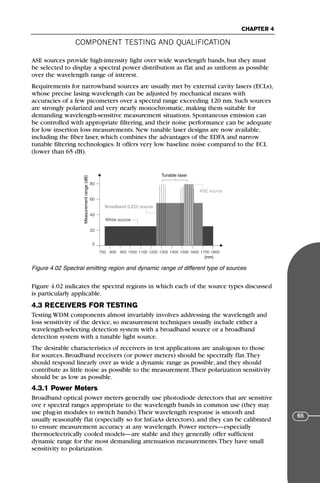
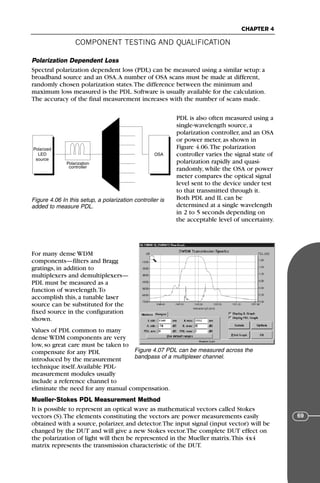
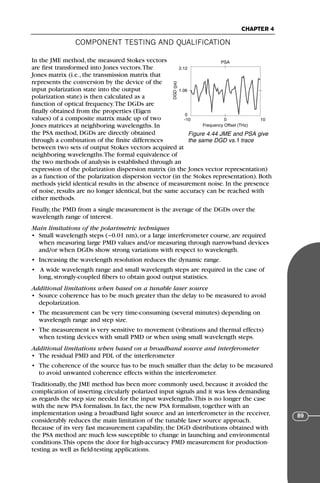
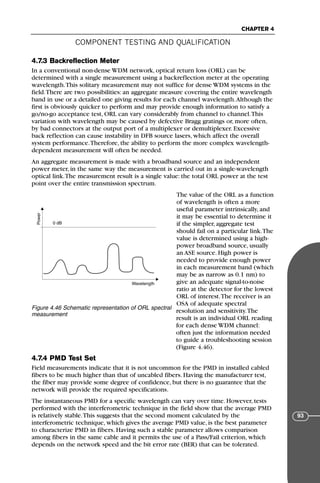
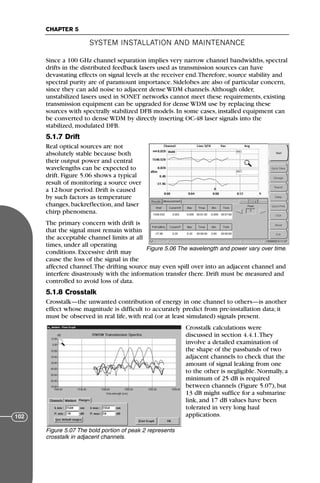
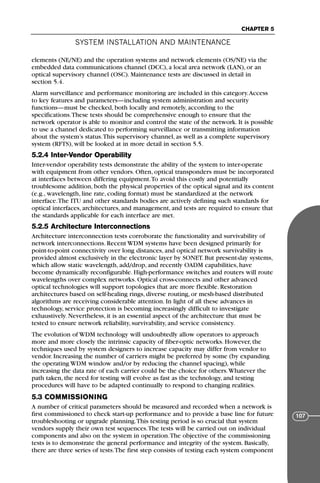
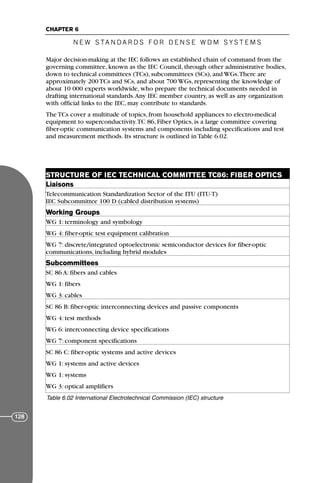
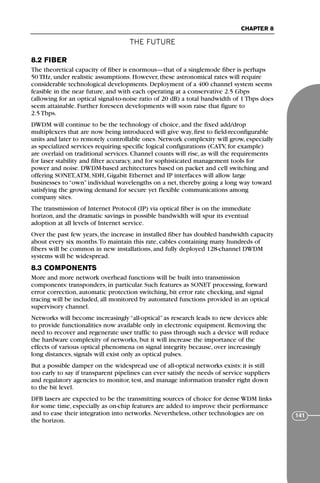
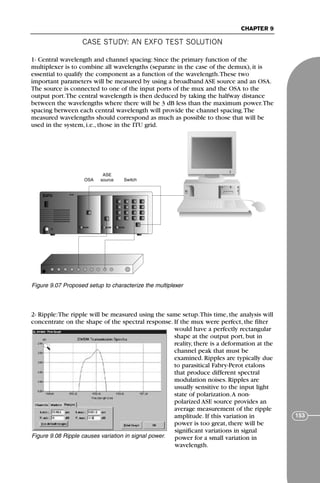
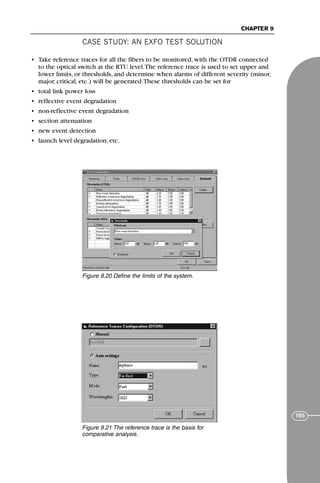
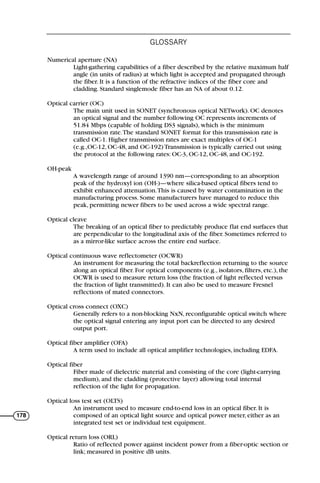
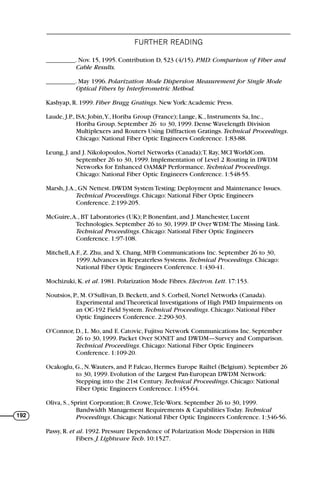
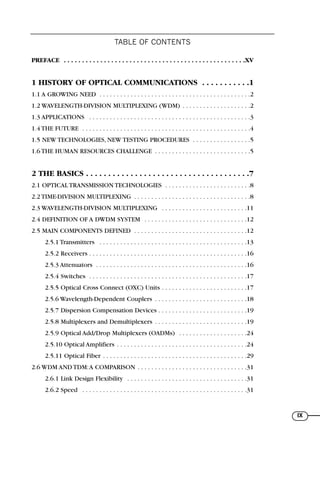
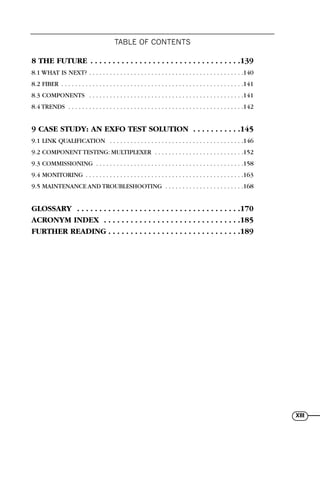
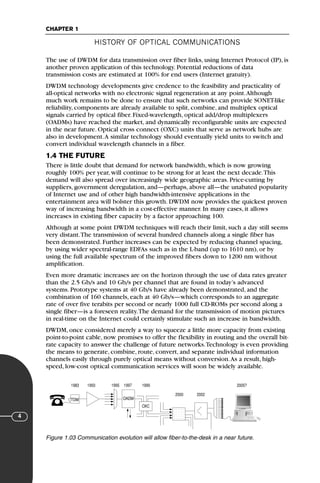
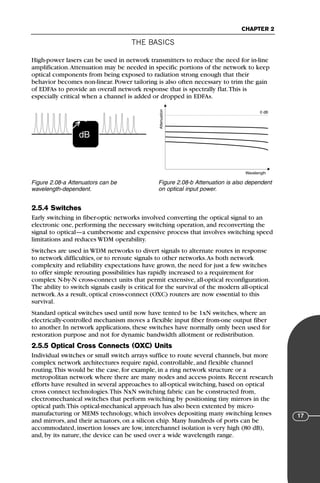
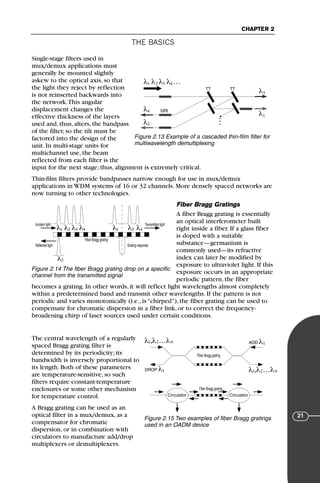
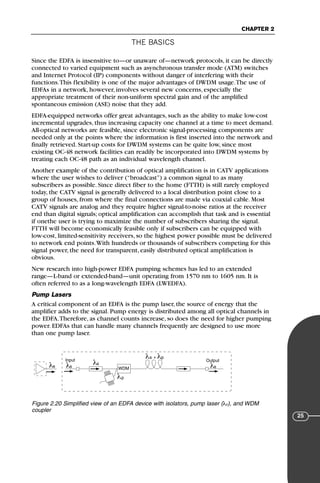
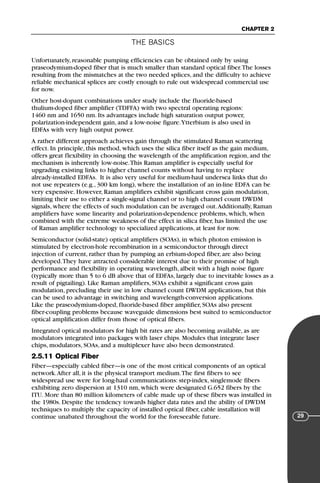
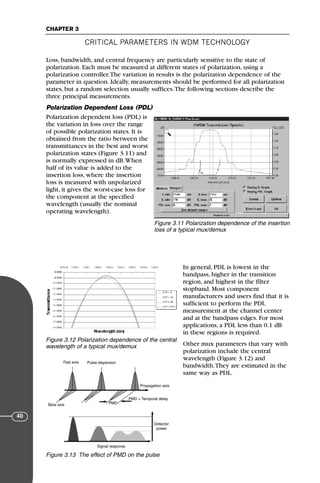
3.2.1 Channel Band
The performance of a mux/demux
depends on its ability to isolate
incoming or outgoing channels.
Each channel band is characterized
by the following parameters,
illustrated in Figure 3.04:
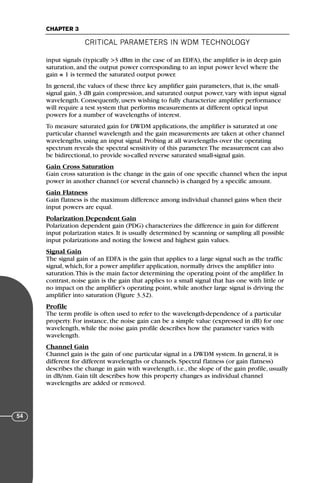
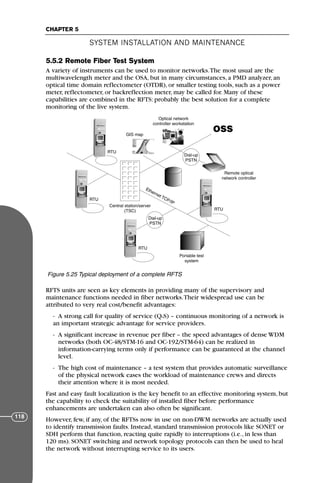
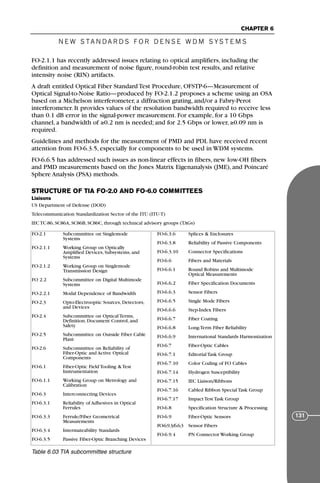
1. Channel central wavelength
The measured central wavelength is
often used to characterize a filter or
multiplexer/demultiplexer channel.
Central wavelength is the mean
wavelength, halfway between the
upper and lower cutoff wavelengths
[(λupper + λlower)/2]. It is not
necessarily the wavelength of
maximum transmission.
The central wavelength parameter is
most meaningful for filters whose
spectral shapes are symmetric or
nearly so. Generally, the central
wavelength is defined as the
midpoint between the
3 dB downward-sloping
wavelengths on either side of the
wavelength of peak transmission.
For a perfectly symmetrical
distribution, the central wavelength
would be the same as the peak
transmission wavelength, but this is
seldom the case. In fact, relatively
minor differences in the shape of
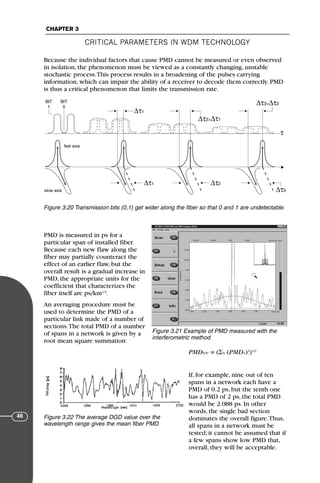
the transmission curve can lead to
marked changes in central
wavelength—compare the two
traces in Figure 3.05
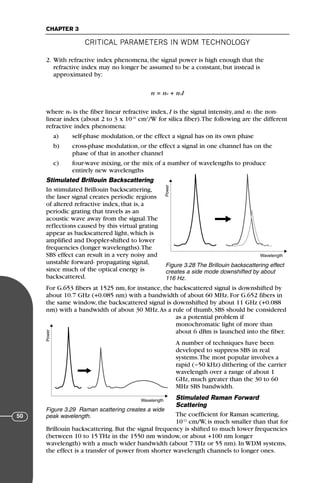
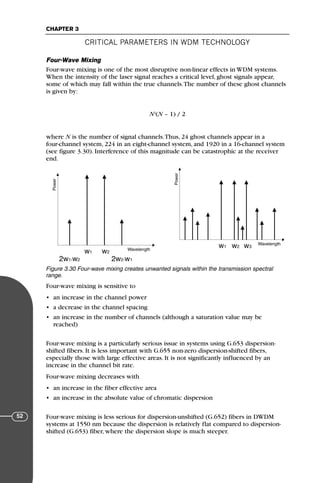
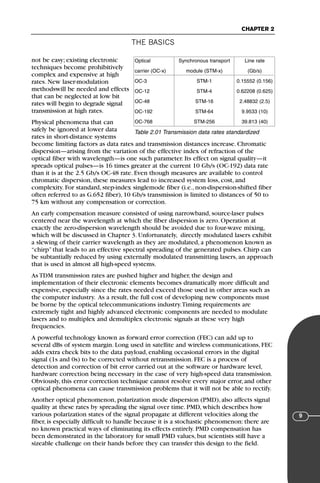
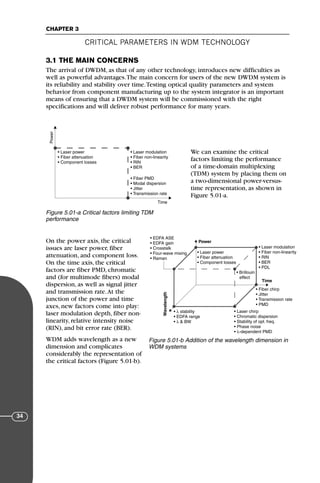
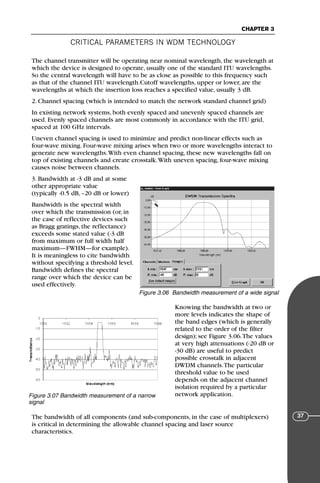
Figure 3.04 Performance criteria for a typical
mux/demux
λ
P
-3 dB
Centre
Wavelength
Channel
λ
P
-3 dB
Centre
Wavelength
Channel
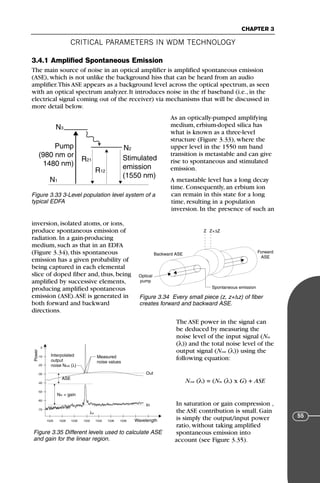
Figure 3.05 A comparison between two
traces shows how an apparently minor
change can affect the central
wavelength.
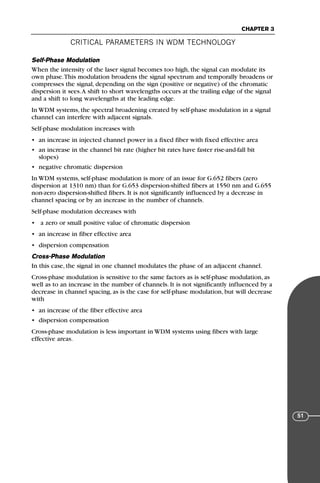
71136 001-194_cb 11/10/08 8:58 AM K 36](https://image.slidesharecdn.com/exfobookguide-wdmen-230528184505-e8526cf1/85/exfo_book_guide-wdm_en-pdf-51-320.jpg)

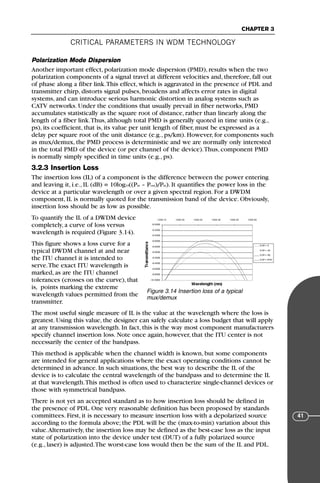

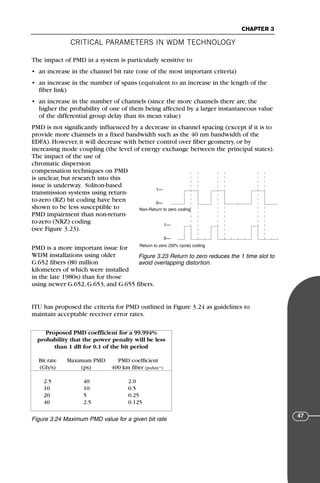

![CRITICAL PARAMETERS IN WDM TECHNOLOGY
CHAPTER 3
49
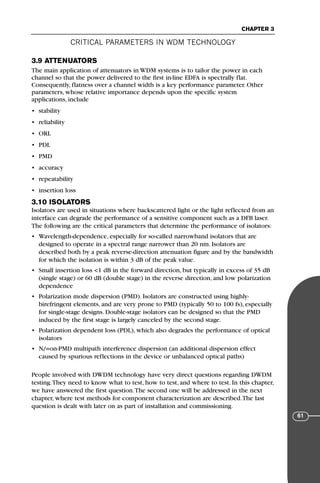
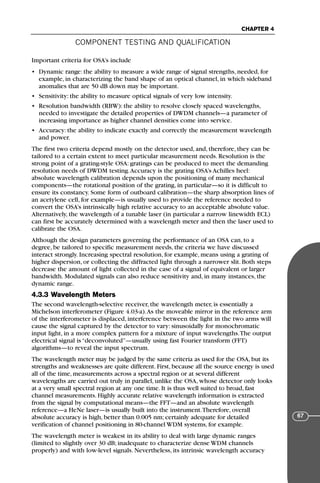
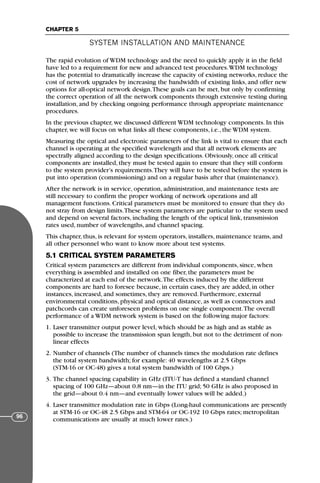
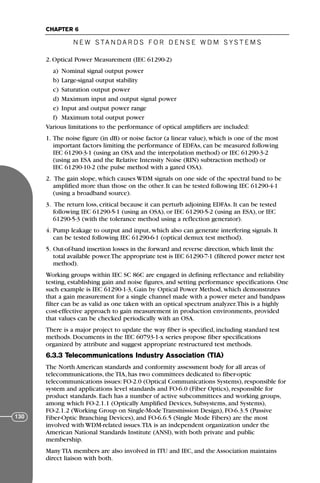
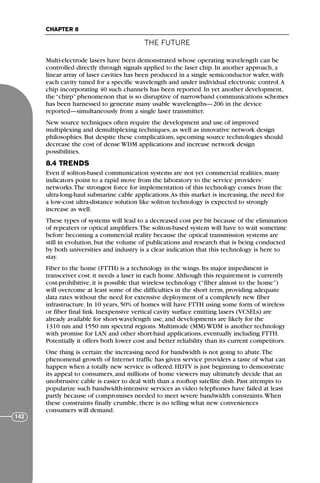
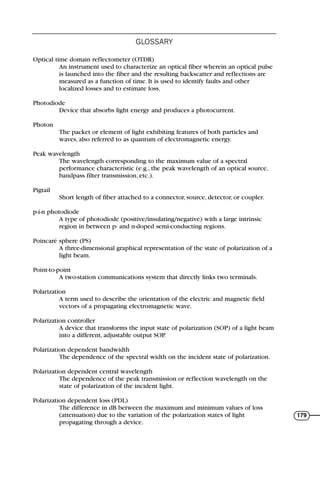
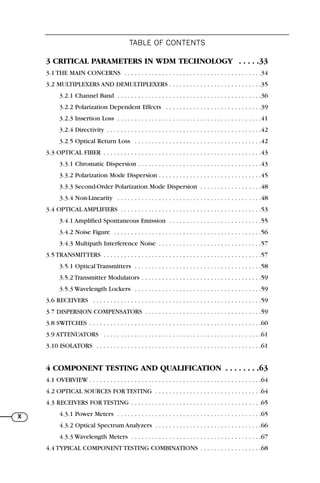
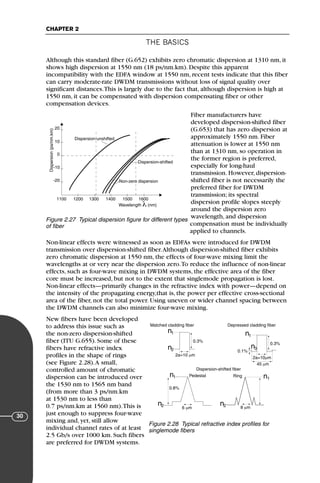
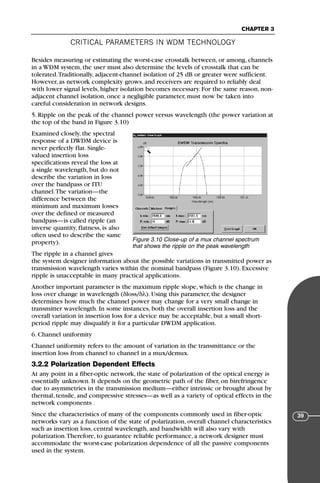
Fiber non-linearity is not a manufacturing or design defect; it is an inherent
characteristic of any electromagnetic energy passing through a physical medium. It is
of particular concern to designers and users of fiber-optic communications systems,
due to the very high coherence of laser energy these systems use.The strength of the
electric field needed for a given level of transmitted power increases with the level of
coherence in the wave.Thus, even moderate power levels in highly coherent WDM
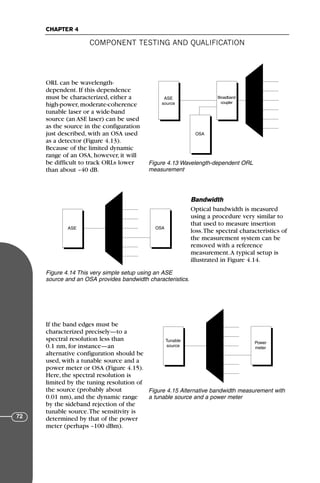
systems lead to electric field levels sufficient to produce non-linear effects.
Fiber non-linearity becomes noticeable when the laser signal intensity (the power per
unit area) reaches a threshold value.Also, non-linear effects generally become evident
after signals have passed through a length of fiber, depending on the characteristics of
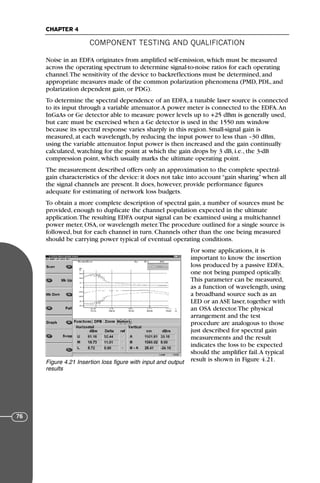
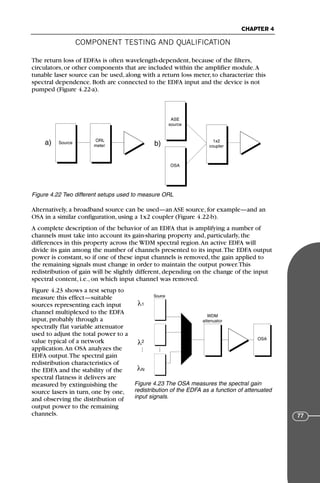
its construction and the operating conditions under which it is placed.
In fact, the electric field (E) of the
propagating signal is proportional to the
signal power P times the fiber non-linear
index n2 divided by the fiber core
effective area Aeff as expressed in:
E(z + dz) = E(z) exp [(-α/2 +iβ +
γP(z,t)/2) dz]
where α is the fiber attenuation, β is the
phase of the propagating wave, and γ is
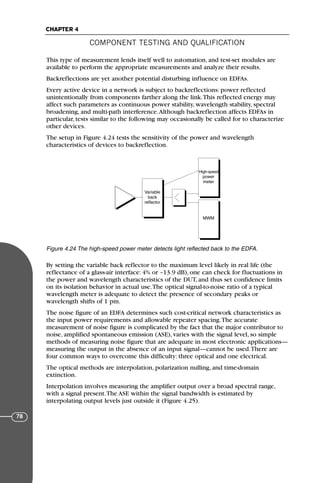
the non-linear coefficient equal to
(2π/λ)(n2/Aeff). If we assume that the light
beam propagates in a Gaussian form,
then:
Aeff = π(MFD)2
where MFD is the mode field diameter. For G.653 dispersion-shifted fibers and G.655
non-zero dispersion-shifted fibers,Aeff is approximately equal to 50 to 60 µm2
, while
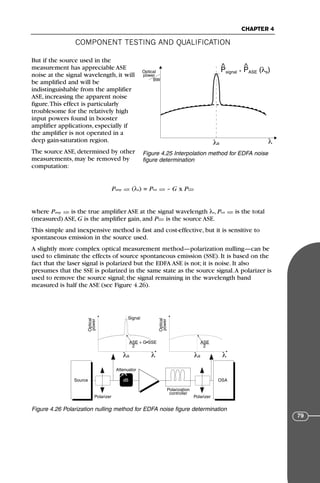
G.652 dispersion-unshifted fibers have Aeff approximately equal to 80 µm2
.The
effective fiber length Leff has the same effect as Aeff. For typical singlemode fibers, Leff is
typically equal to 20 km.
Non-linear effects fall into two categories, depending on the behavior of the non-linear
coefficient γ.These are scattering phenomena (when g is a real number and gives rise
to gain or loss) and refractive index phenomena (when g is an imaginary number and
gives rise to phase modulation).
1. With scattering phenomena, the laser signal is scattered by sound waves
(acoustic phonons) or fiber molecular vibrations (optical phonons) and is shifted
to longer wavelengths.The following are two different types of scattering
phenomena:
a) stimulated Brillouin backscattering (acoustic phonon phenomenon)
b) stimulated Raman scattering (optical phonon phenomenon)
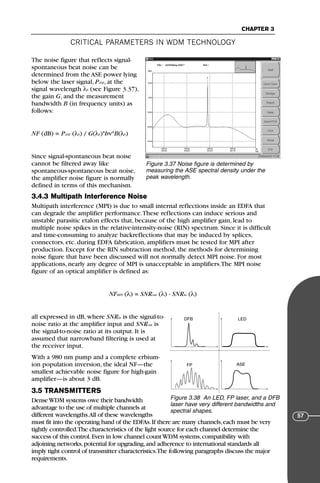
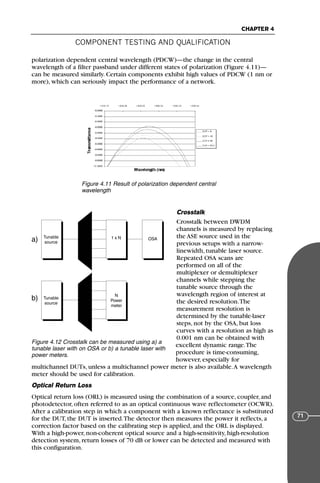
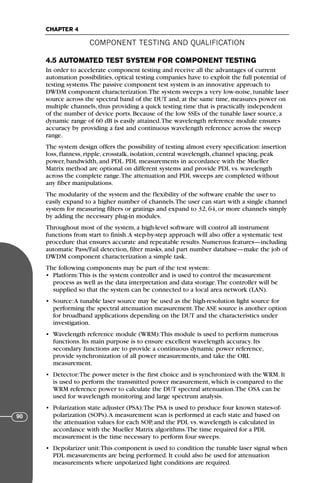
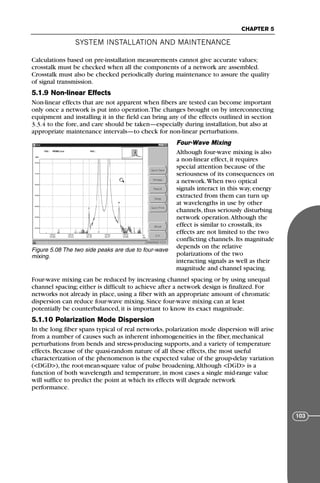
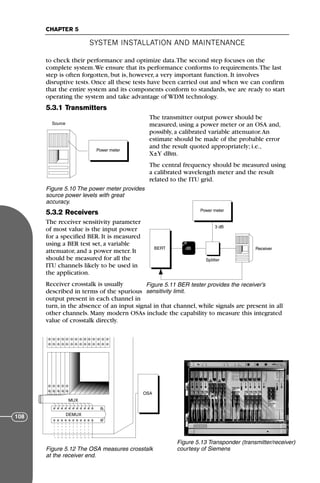
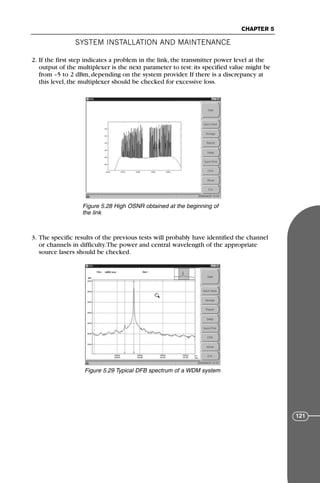
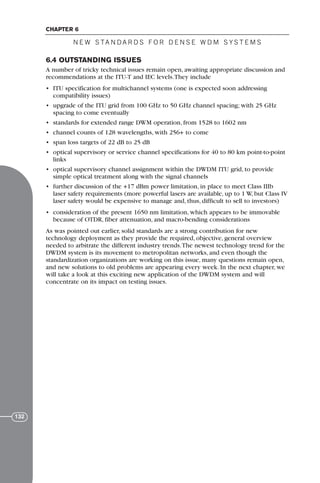
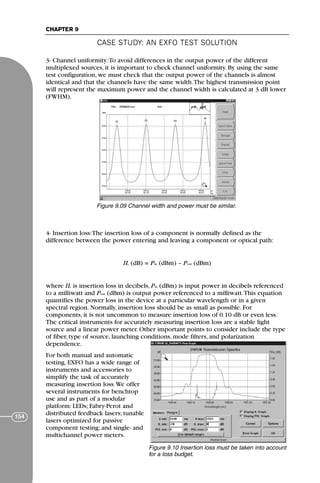
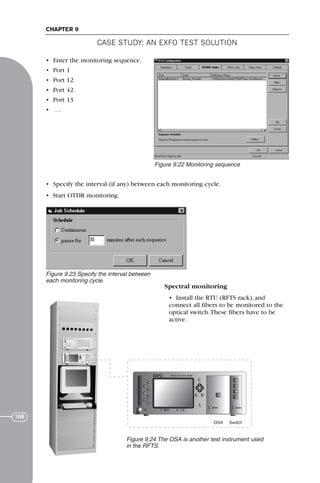
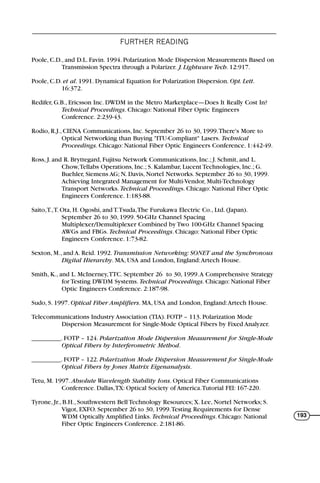
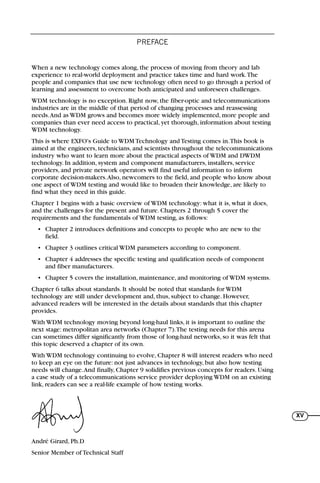
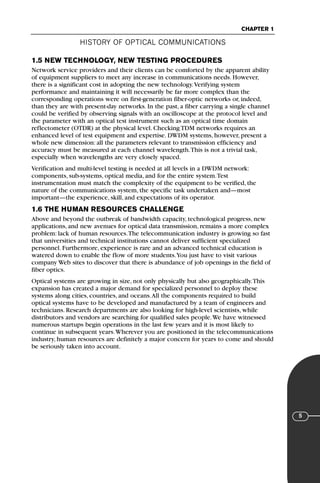
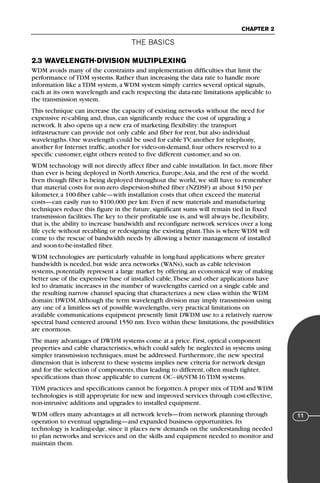
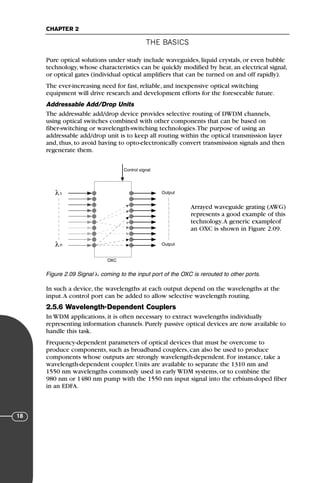
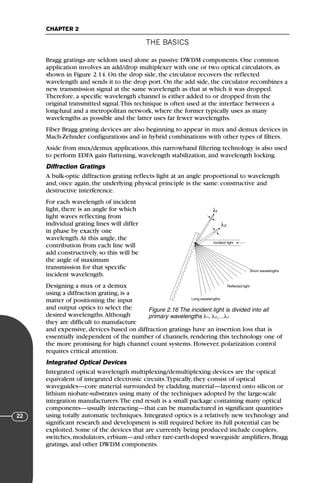
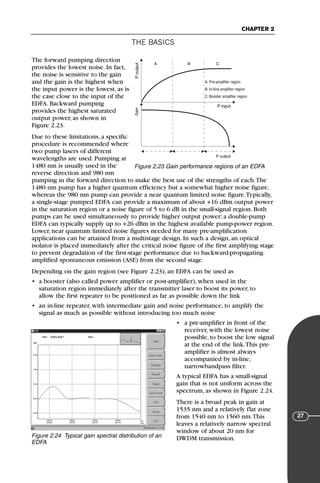
Power
at
the
output
Power at the input
Non-linear region
Linear region
Figure 3.27 Non-linearity appears at high
power level.
71136 001-194_cb 11/10/08 8:58 AM K 49](https://image.slidesharecdn.com/exfobookguide-wdmen-230528184505-e8526cf1/85/exfo_book_guide-wdm_en-pdf-64-320.jpg)