This front matter provides information about the authors and copyright of the 4th edition of the textbook "Essentials of Exercise Physiology". It lists the authors and their academic affiliations. It also provides details about the copyright, including that many figures are copyrighted by Fitness Technologies Press, Frank I. Katch, and Victor L. Katch. The front matter outlines the organization of the textbook and highlights new and expanded content for this 4th edition.


![Acquisitions Editor: Emily Lupash
Product Manager: Andrea M. Klingler
Marketing Manager: Christen Murphy
Designer: Joan Wendt
Art by: Dragonfly Media Grou
Compositor: Aptara, Inc.
Printer: C&C Offset Printing Co. Ltd.
Fourth Edition
Copyright © 2011 Lippincott Williams & Wilkins, a Wolters Kluwer business
351 West Camden Street Two Commerce Square, 2001 Market Street
Baltimore, MD 21201 Philadelphia, PA 19103
Printed in China
First Edition, 1994
Second Edition, 2000
Third Edition, 2006
Unless otherwise indicated, all photographs are Copyright © Fitness Technologies Press, Frank I. Katch, and Victor L. Katch, 50
43
Via Lara Lane, Santa Barbara, CA, 93111. This material is protected by copyright. No photograph may be reproduced in any form o
r
by any means without permission from the copyright holders.
Appendix B Copyright © 1991, 1999, 2010 by Fitness Technologies, Inc. 5043 Via Lara Lane, Santa Barbara, CA, 93111. This
material is protected by copyright. No part of it may be reproduced in any manner or by any means without written permission fr
om
the copyright holder.
Appendices C and D Copyright © 1991, 1999, 2010 by William D. McArdle, Frank L. Katch, Victor L. Katch and Fitness
Technologies, Inc. This material is protected by copyright. No part of it may be reproduced in any manner or by any means witho
ut
written permission from the copyright holder.
All rights reserved. This book is protected by copyright. No part of this book may be reproduced in any form or by any means, i
ncluding
photocopying, or utilized by any information storage and retrieval system without written permission from the copyright owner.
The publisher is not responsible (as a matter of product liability, negligence, or otherwise) for any injury resulting from any
material
contained herein. This publication contains information relating to general principles of medical care that should not be const
rued as
specific instructions for individual patients. Manufacturers’ product information and package inserts should be reviewed for curent
information, including contraindications, dosages, and precautions.
Library of Congress Cataloging-in-Publication Data
Katch, Victor L.
Essentials of exercise physiology / Victor L. Katch, William D. McArdle, Frank I. Katch.— 4th ed.
p. ; cm.
William D. McArdle is first named author on previous edition
Abridgement of: Exercise physiology / William D. McArdle, Frank I. Katch, Victor L. Katch. 7th ed. c2010.
Includes bibliographical references and index.
Summary: “This is a textbook for undergraduate Exercise Physiology courses”—Provided by publisher.
Summary: “The fourth edition of Essentials of Exercise Physiology represents a compact version of the seventh edition of Exerci
se
Physiology: Nutrition, Energy, and Human Performance, ideally suited for an undergraduate l introductory course in exercise
physiology”—Provided by publisher.
ISBN 978-1-60831-267-2 (alk. paper)
1. Exercise—Physiological aspects. I. McArdle, William D. II. Katch, Frank I. III. McArdle, William D. Exercise physiology.
IV. Title.
[DNLM: 1. Exercise—physiology. 2. Physical Fitness—physiology. 3. Sports Medicine. QT 260]
QP301.M1149 2011
612'.044—dc22
2010031304
The publishers have made every effort to trace the copyright holders for borrowed material. If they have inadvertently overlook
ed any, they
will be pleased to make the necessary arrangements at the first opportunity
To purchase additional copies of this book, call our customer service department at(800) 638-3030 or fax orders to (301) 223-2320.
International customers should call (301) 223-2300.
Visit Lippincott Williams & Wilkins on the Internet: http://www.lww.com. Lippincott Williams & Wilkins customer service represen-
tatives are available from 8:30 am to 6:00 pm, EST.
LWBK710-FM_i-xii.qxd 18/09/2010 00:26 Page ii Aptara](https://image.slidesharecdn.com/essentialsofexercisephysiology4aedkatchmcardlekatch-220619181003-c34e0a40/85/Exercise-Physiology-4-320.jpg)


![received his MD degree from Harvard Medical School in 1891. One year later, Fitz
developed the first formal exercise physiology laboratory, where students investi
gated the effects of exercise on cardiorespiratory function, including muscular
fatigue, metabolism, and nervous system functions. Fitz, uniquely qualified t
teach this course based on his sound experimental training at Harvard’s Medical
School under the tutelage of well-known physiologists, also designed new record-
ing and measuring devices. Fitz published his research in the prestigious Boston
Medical and Surgical Journal, including studies on muscle cramping, the efficac
of protective clothing, spinal curvature, respiratory function, carbon dioxide
measurement, and speed and accuracy of simple and complex movements. He
also wrote a textbook ( Principles of Physiology and Hygiene [New York: Holt,
1908] and revised physiologist HN Martin’s The Human Body. Textbook of
Anatomy, Physiology and Hygiene; with Practical Exercises [Holt, 1911]). Well-
known researchers in the new program included distinguished Harvard Medical
School physiologists Henry Pickering Bowditch (1840–1911), whose research
produced the “all or none principle” of cardiac contraction and “treppe” (staircase
Chapter 1 Origins of Exercise Physiology: Foundations for the Field of Study • 11
Figure 1.9 The United States Sanitary Commission first used the andrometer a
numerous military installations along the Atlantic seaboard during the early 1860s to
properly size soldiers for their military uniforms.
Figure 1.10 George Wells Fitz, MD, physician and pioneer exercise physiology
researcher.
Questions & Notes
Describe possible practical uses of anthro-
pometric data.
Discuss why George Wells Fitz is consid-
ered an important exercise physiology
pioneer.
Where was the first exercise physiolog
laboratory located?
LWBK710-c01_01-30.qxd 9/15/10 9:18 AM Page 11 Aptara](https://image.slidesharecdn.com/essentialsofexercisephysiology4aedkatchmcardlekatch-220619181003-c34e0a40/85/Exercise-Physiology-25-320.jpg)
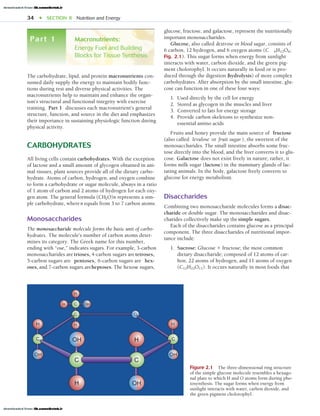
![12 • SECTION I Introduction to Exercise Physiology
BOX 1.1
Course of Study: Department of Anatomy, Physiology, and Physical
Training, Lawrence Scientific School, Harvard University, 1893
Few of today’s undergraduate physical education major
programs could match the strong science core required at
Harvard in 1893. The accompanying table lists the 4-year
course of study of the department’s fourth-year require-
ments listed in the 1893 course catalog. Along with core
courses, Professor Fitz established an exercise physiology
laboratory. The following describes the laboratory’s
objectives:
“A well-equipped laboratory has been organized for the
experimental study of the physiology of exercise. The object
of this work is to exemplify the hygiene of the muscles, the
conditions under which they act, the relation of their action
to the body as a whole affecting blood supply and general
hygienic conditions, and the effects of various exercises on
muscular growth and general health.”
CLOSE UP
First Year
Experimental Physics
Elementary Zoology
Morphology of Animals
Morphology of Plants
Elementary Physiology and Hygiene (taught by Fitz1
)
General Descriptive Chemistry
Rhetoric and English Composition
Elementary German
Elementary French
Gymnastics and Athletics (taught by Sargent and Lathrop)
Second Year
Comparative Anatomy of Vertebrates
Geology
Physical Geography and Meteorology
Experimental Physics
General Descriptive Physics
Qualitative Analysis
English Composition
Gymnastics and Athletics (taught by Sargent and
Lathrop)
Third Year (at Harvard Medical School)
General Anatomy and Dissection
General Physiology (taught by Bowditch and Porter)
Histology (taught by Minot and Quincy)
Hygiene
Foods and Cooking [Nutrition] (at Boston Cooking
School)
Medical Chemistry
Auscultation and Percussion
Gymnastics and Athletics (taught by Sargent and
Lathrop)
Fourth Year
Psychology (taught by James)
Anthropometry (Sargent2
)
Applied Anatomy and Animal Mechanics [Kinesiology]
(taught by Sargent3
)
Physiology of Exercise (taught by Fitz4
)
Remedial Exercise (taught by Fitz5
)
History of Physical Education (taught by Sargent and Fitz
6
)
Forensics
Gymnastics and Athletics (Sargent and Lathrop7
)
COURSE EXPLANATION
1
The Elementary Physiology of and Hygiene of Common Life, Personal Hygiene, Emergencies. Half-course. One lecture and one
laboratory hour each week throughout the year (or three times a week, first half-year). Dr. G.W. Fitz. This is a general introd
ctory
course intended to give the knowledge of human anatomy, physiology, and hygiene, which should be possessed by every student;
it is suitable also for those not intending to study medicine or physical training.
2
Anthropometry. Measurements and Tests of the Human Body, Effects of Age, Nurture and Physical Training. Lectures and practi-
cal exercises. Half-course. Three times a week (first half-year). Dr. Sargent. This course affords systematic training in makinmeas-
urements and tests of persons for the purpose of determining individual strength and health deficiencies. Practice is also give in
classifying measurements, forming typical groups, etc., and in determining the relation of the individual to such groups. This
course
must be preceded by the course in General Anatomy at the Medical School, or its equivalent.
3
Applied Anatomy and Animal Mechanics. Action of Muscles in Different Exercises. Lectures and Demonstrations. Half-course.
Three times a week (second half-year). Dr. Sargent. The muscles taking part in the different exercises and the mechanical condi
tions
under which they work are studied. The body is considered as a machine. The development of force, its utilization and the adapt
a-
tion of the different parts to these ends are made prominent in the work. This course must be preceded by the course in General
Anatomy at the Medical School, or its equivalent.
4
Physiology of Exercise. Experimental work, original work and thesis. Laboratory work six hours a week. Dr. G.W. Fitz. This cour
se
is intended to introduce the student to the fundamental problems of physical education and to give him the training in use of a
ppa-
ratus for investigation and in the methods in such work. This course is preceded by the course in General Physiology at the Med
ical
School, or its equivalent.
LWBK710-c01_01-30.qxd 9/15/10 9:18 AM Page 12 Aptara](https://image.slidesharecdn.com/essentialsofexercisephysiology4aedkatchmcardlekatch-220619181003-c34e0a40/85/Exercise-Physiology-26-320.jpg)


![working capacity during arm and leg exercise, changes in
oxidative response of muscle during exercise, comparisons
of positive and negative work, hormonal and core tempera-
ture response during different intensities of exercise, and
respiratory function in response to decreased ambient oxy-
gen levels.
Christensen became Lindhard’s student in Copenhagen
in 1925. In his 1931 doctoral thesis, Christensen reported
studies of cardiac output, body temperature, and blood
sugar concentration during intense exercise on a cycle
ergometer, compared arm versus leg exercise, and quanti-
fied the effects of training. Together with Krogh and Lind
hard, Christensen published an important 1936 review
article describing physiological dynamics during maximal
exercise. With J.W. Hansen, he used oxygen uptake and
the respiratory quotient to describe how diet, state of train-
ing, and exercise intensity and duration affected carbohy-
drate and fat utilization. Discovery of the concept of
“carbohydrate loading” actually occurred in 1939. Experi-
ments by physician Olé Bang in 1936, inspired by his men-
tor Ejar Lundsgaard, described the fate of blood lactate
during exercise of different intensities and durations. The
research of Christensen, Asmussen, Nielsen, and Hansen
took place at the Laboratory for the Theory of Gymnastics
at the University of Copenhagen. Today, the August Krogh
Institute continues the tradition of basic and applied
research in exercise physiology. Since 1973, Swedish-
trained scientist Bengt Saltin (Fig. 1.16) (the only Nordic
researcher besides Erling Asmussen to receive the ACSM
Citation Award [1980] and ACSM Honor Award [1990];
former student of Per-Olof Åstrand, discussed in the next
section) continues his noteworthy scientific studies at th
Muscle Research Institute in Copenhagen.
Swedish Influence
Modern exercise physiology in Sweden can be traced to Per
Henrik Ling (1776–1839), who in 1813 became the firs
director of Stockholm’s Royal Central Institute of Gymnas-
tics (RCIG). Ling, in addition to his expertise in exercise and
movement and as a fencing master, developed a system of
“medical gymnastics” that incorporated his studies of
anatomy and physiology, which became integral to Sweden’s
school curriculum in 1820. Ling’s son, Hjalmar Ling
(1820–1886), published an important textbook about the
“kinesiology of body movements” in 1866 (from a transla-
tion in Swedish: The First Notions of Movement Science. Out-
line Regarding the Teaching at RCIG and an Introduction with
References to the Elementary Principles of Mechanics and Joint-
Science). As a result of Per Henrik and his son Hjalmar’s phi-
losophy and pioneering influences, physical educatio
graduates from the RCIG were extremely well schooled in
the basic biological sciences in addition to proficiency i
many sports and games. The RCIG graduates were all men
until 1864 when women were first admitted. Ling’s earl
teachings and curriculum advances consisted of four
branches of his System of Gymnastics—the most influentia
and long lasting being medical gymnastics that has evolved
into the discipline of physiotherapy. Course work included
anatomy and physiology, pathology with dissections, and
basic study in movement science ( Rörelselära in Swedish).
One of Ling’s lasting legacies was his steadfast insistence that
RCIG graduates have a strong science background. This was
carried out by Ling’s disciples, who assumed positions of
leadership in predominantly Germany, France, Denmark,
Belgium, and England, with the influence extending to th
United States beginning in the 1830s. Founded in 1813, the
Gymnastik-Och Idrottshögskolan or Swedish School of
Sport and Health Sciences (GIH) has the distinction as the
oldest University College in the world within its field. GI
along with the Department of Physiology in the Karolinska
Institute Medical School in Stockholm, the Royal Institute
of Technology, Stockholm University, and Örebro Univer-
sity conduct research in exercise physiology and muscu-
loskeletal health and disease.
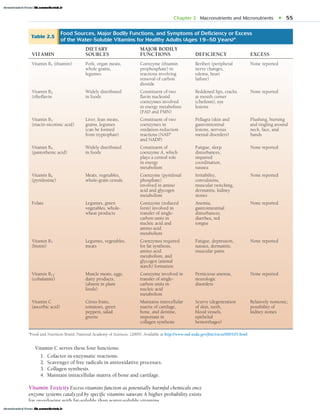
Per-Olof Åstrand, MD, PhD (b. 1922; Fig. 1.17) is the
most famous graduate of the College of Physical Education
(1946); in 1952, he presented his doctoral thesis at the
Karolinska Institute Medical School. Åstrand taught in the
Department of Physiology in the College of Physical Edu-
cation from 1946 to 1977; it then became a department at
18 • SECTION I Introduction to Exercise Physiology
Figure 1.16 Swedish researcher Dr. Bengt Saltin taking a
muscle biopsy of gastrocnemius muscle after an endurance
training program. (Photo courtesy of Dr. David Costill.)
Figure 1.17 Dr. Per-Olof Åstrand, Department of Physiology,
Karolinska Institute, Stockholm, was instrumental in charting
the modern course of exercise physiology research.
LWBK710-c01_01-30.qxd 9/15/10 9:18 AM Page 18 Aptara](https://image.slidesharecdn.com/essentialsofexercisephysiology4aedkatchmcardlekatch-220619181003-c34e0a40/85/Exercise-Physiology-32-320.jpg)
![the Karolinska Institute, where he served as professor and department head from
1977 to 1987. Christensen, Åstrand’s mentor, supervised his thesis, which eval-
uated physical working capacity of men and women ages 4 to 33 years. This
important study, among others, established a line of research that propelled
Åstrand to the forefront of experimental exercise physiology for which he
achieved worldwide fame. Four of his papers, published in 1960 with Chris-
tensen as coauthor, stimulated further studies on the physiological responses to
intermittent exercise. Åstrand has mentored an impressive group of exercise
physiologists, including “superstar” Dr. Bengt Saltin.
Two Swedish scientists from the Karolinska Institute, Drs. Jonas Bergström
and Erik Hultman (Fig. 1.18), conducted important needle biopsy experiments
in the mid 1960s. With this procedure, muscle could be studied under various
conditions of exercise, training, and nutritional status. Collaborative work with
other Scandinavian researchers (Saltin and Hultman from Sweden and Her-
mansen from Norway) and researchers in the United States (e.g., Gollnick [d.
1994], Washington State University) provided new vistas from which to view
the physiology of exercise.
Norwegian and Finnish Influence
The new generation of exercise physiologists trained in the late 1940s analyzed
respiratory gases with a highly accurate sampling apparatus that measured
minute quantities of carbon dioxide and oxygen in expired air. Norwegian sci-
entist Per Scholander (1905–1980) developed the method of analysis (and ana-
lyzer that bears his name) in 1947.
Another prominent Norwegian researcher,Lars A. Hermansen(1933–1984:
Fig. 1.19; ACSM Citation Award, 1985), from the Institute of Work Physiology
Chapter 1 Origins of Exercise Physiology: Foundations for the Field of Study • 19
Figure 1.18 Drs. Jonas Bergström (left) and Eric Hultman (right), Karolinska Insti-
tute, Stockholm, pioneered needle biopsy techniques to assess the ultrastructural
architecture of muscle fibers and their biochemical functions
Figure 1.19 Lars A. Hermansen (1933–1984), Institute of Work Physiology, Oslo.
Questions & Notes
Who was Per Henrik Ling and why is he
an important historical figure
Name 2 famous Danish exercise
physiologists.
1.
2.
Name 2 famous Swedish exercise
physiologist.
1.
2.
Name a famous Norwegian exercise
physiologist.
LWBK710-c01_01-30.qxd 9/15/10 9:18 AM Page 19 Aptara](https://image.slidesharecdn.com/essentialsofexercisephysiology4aedkatchmcardlekatch-220619181003-c34e0a40/85/Exercise-Physiology-33-320.jpg)


![symptoms of thiamin deficiency occur after only 2 week
on a thiamin-free diet, and symptoms of vitamin C defi
ciency appear after 3 or 4 weeks. At the other extreme,
consuming the fat-soluble vitamins A, D, E, and K in
excess can produce a toxic overdose manifested by hair
loss, irregularities in bone formation, fetal malformation,
hemorrhage, bone fractures, abnormal liver function, and
ultimately death.
Classification of Vitamins
Thirteen different vitamins have been isolated, analyzed,
classified, and synthesized and have had their recom
mended intake levels established. Vitamins are classified a
either fat-soluble (vitamins A, D, E, and K) orwater-soluble
(vitamin C and the B-complex vitamins: vitamin B 6 [pyri-
doxine], vitamin B1 [thiamin], vitamin B2 [riboflavin], niaci
[nicotinic acid], pantothenic acid, biotin, folic acid, and vita-
min B12 [cobalamin]).
Fat-Soluble Vitamins Fat-soluble vitamins dissolve
and store in the body’s fatty tissues and do not require daily
intake. In fact, symptoms of a fat-soluble vitamin insuffi
ciency may not appear for years. Dietary lipid provides the
source of fat-soluble vitamins. Whereas the liver stores
vitamins A, D, and K, vitamin E distributes throughout the
body’s fatty tissues. Prolonged intake of a “fat-free” diet
accelerates a fat-soluble vitamin insufficiency. Table 2.4
lists the major bodily functions, dietary sources, and symp-
toms of a deficiency or excess for the fat-soluble vitamin
for men and women ages 19 to 50 years. Chapter 3 dis-
cusses the dietary reference intakes (DRIs), including tol-
erable upper intake levels for all vitamins (and minerals)
for different life-stage groups.
Water-Soluble Vitamins Vitamin C (ascorbic
acid) and the B-complex group constitute the nine water-
soluble vitamins. They act largely as coenzymes—small
molecules that combine with a larger protein compound
(apoenzyme) to form an active enzyme that accelerates
interconversion of chemical compounds. Coenzymes par-
ticipate directly in chemical reactions; when the reaction
runs its course, coenzymes remain intact and participate
in further reactions. Water-soluble vitamins play an essen-
tial role as part of coenzymes in the cells’ energy-generat-
ing reactions.
Because of their solubility in water, water-soluble vita-
mins disperse in the body fluids without appreciable stor
age, with the excess voided in urine. If the diet regularly
contains less than 50% of the recommended values for
water-soluble vitamins, marginal deficiencies may develo
within 4 weeks. Table 2.5 summarizes food sources,
major bodily functions, and symptoms from an excess and
deficiency of water-soluble vitamins. The B-complex vita
mins serve as coenzymes in energy-yielding reactions dur-
ing carbohydrate, fat, and protein breakdown. They also
contribute to hemoglobin synthesis and red blood cell
formation.
54 • SECTION II Nutrition and Energy
DIETARY MAJOR BODILY
VITAMIN SOURCES FUNCTIONS DEFICIENCY EXCESS
Vitamin A Provitamin A (beta– Constituent of Xeropthalmia Headache,
(retinol) carotene) widely rhodopsin (visual (keratinization of vomiting, peeling
distributed in pigment); ocular tissue), of skin, anorexia,
green vegetables; maintenance night blindness, swelling of long
retinol present in of epithelial permanent bones
milk, butter, tissues; role in blindness
cheese, fortifie mucopolysaccharide
margarine synthesis
Vitamin D Cod-liver oil, eggs, Promotes growth Rickets (bone Vomiting, diarrhea,
dairy products, and mineralization deformities) in weight loss,
fortified milk, an of bones; increases children; kidney damage
margarine absorption of calcium osteomalacia in
adults
Vitamin E Seeds, green leafy Functions as an Possibly anemia Relatively nontoxic
(tocopherol) vegetables, margarines, antioxidant to
shortenings prevent cell
damage
Vitamin K Green leafy vegetables, Important in blood Conditioned Relatively nontoxic;
(phylloquinone) small amount in clotting (helps deficiencie synthetic forms
cereals, fruits, and form active associated with at high doses
meats prothrombin) severe bleeding, may cause
internal jaundice
hemorrhages
a
Food and Nutrition Board, National Academy of Sciences. (2009). Available at http://www.nal.usda.gov/fnic/etext/000105.html. This website provides
interactive dietary reference intakes for health professionals.
Table 2.4
Food Sources, Major Bodily Functions, and Symptoms of Deficiency or Excess of the
Fat-Soluble Vitamins for Healthy Adults (Ages 19–50 Years)a
LWBK710-c02_31-80.qxd 9/15/10 9:19 AM Page 54 Aptara](https://image.slidesharecdn.com/essentialsofexercisephysiology4aedkatchmcardlekatch-220619181003-c34e0a40/85/Exercise-Physiology-68-320.jpg)


![62 • SECTION II Nutrition and Energy
Increased
calcium
resorption
from bone
Lining of
intestine
Calcium stored
in bone
Calcium
Normal
bone
Osteoporotic
bone
Normal
absorption
of calcium by
small intestine
Ineffective
absorption
of calcium by
small intestine
Figure 2.17 (1) Calcium buildup by its efficient transport from the small intestines for storage in the bone matrix (note that th
large blue arrowhead points into the bone) and (2) the opposing process of ineffective calcium intestinal absorption, where calcium
leaches from the bones (largeblue arrowhead points into blood stream), leaving them brittle and likely to fracture.
CO
CO2 + H
+ H2O
CATABOLISM (breakdown)
CATABOLISM (breakdown)
CO2 + H2O
Energy
Glucose
Calcium
Cobalt
Copper
Iron
Magnesium
Manganese
Potassium
Sulfur
Zinc
Fatty
acids
Amino
acids
ANABOLISM (buildup)
ANABOLISM (buildup)
Glucose Glycogen
Fatty acids Fats
Amino acids Proteins
Calcium
Chlorine
Magnesium
Manganese
Potassium
Figure 2.16 Minerals contribute to macronutrient catabolism
(breakdown) and anabolism (buildup).
cium), calcium is involved in these six important func-
tions:
1. Muscle action
2. Blood clotting
3. Nerve impulse transmission
4. Activation of several enzymes, (e.g., tissue transglu-
taminase, mitochondrial glycerol phosphate dehy-
drogenase [mGPD])
5. Synthesis of calciferol (active form of vitamin D)
6. Fluid transport across cell membranes
Osteoporosis: Calcium Intake, and Exercise The skele-
ton contains more than 99% of the body’s total calcium. With
calcium deficiency, the body draws on its calcium reserves i
bone to replace the deficit. With prolonged negative imbal
ance, osteoporosis (literally meaning “porous bones”) even-
tually develops as the bones lose calcium mass (mineral
content) and calcium concentration (mineral density) and
progressively become porous and brittle. Figure 2.17 illus-
trates two opposing processes: (1) the buildup of calcium by
its efficient transport from the small intestine for storage i
the bone matrix (note that the blue arrowhead points into the
bone) and (2) inadequate calcium intake or the ineffective
absorption of calcium by the intestinal mucosa, where cal-
cium travels in the opposite direction from the bone into
bodily fluids, called calcium resorption. Leaching of calcium
from the bones remains a destructive process that leaves
bones hollow and fenestrated. The end result, osteoporosis,
negatively impacts males and females of all ages.
Calcium Calcium, the most abundant mineral in the
body, combines with phosphorus to form bones and
teeth. These two minerals represent about 75% of the
body’s total mineral content of about 2.5% of body mass.
In ionized form ( 1% of the body’s 1200 mg of cal-
LWBK710-c02_31-80.qxd 9/15/10 10:40 PM Page 62 Aptara](https://image.slidesharecdn.com/essentialsofexercisephysiology4aedkatchmcardlekatch-220619181003-c34e0a40/85/Exercise-Physiology-76-320.jpg)
![Osteoporosis currently affects 44 million Americans, or
55% of people 50 years of age and older, with 68% women.
Today in the United States, approximately 10 million indi-
viduals already live with the disease, and almost 34 million
more are estimated to have low bone mass (
osteopenia). Fifty
percent of all women eventually develop osteoporosis, pri-
marly from their relatively low calcium intake and the loss of
the calcium-conserving hormone estrogen at menopause.
Men are not immune; men with osteoporosis totalled 2 mil-
lion in 2009. This number is expected to exceed 20 million
in 2020 ( www.nof.org/). Osteoporosis, a silent disease that
sometimes goes undetected for years until a bone fracture
occurs. It accounts for more than 1.6 million fractures yearly,
including about 700,000 spinal fractures, 250,000 wrist frac-
tures, 300,000 hip fractures, and 300,000 fractures at other
sites. Among women older than age 60 years, osteoporosis
has reached near-epidemic proportions. On average, 24% of
hip fracture patients older than 50 years of age die in the year
following their fracture.
Dietary Calcium Crucial. As a general guideline, adolescent
boys and girls (ages 9–13 years of age) and young adult men
and women (14–18 years of age) require 1300 mg of calcium
daily or about as much calcium in six 8-oz glasses of milk. For
adults between the ages of 19 and 50 years, the daily require-
ment decreases to 1000 mg. Although growing children require
more calcium per unit body mass on a daily basis than adults,
many adults remain deficient in calcium intake. For example
the typical adult’s daily calcium intake ranges between 500 and
700 mg. More than 75% of adults consume less than the recom-
mended amount, and about 25% of women in the United States
consume less than 300 mg of calcium daily. Athletes, female
dancers, gymnasts, and endurance competitors are the most
prone to calcium dietary insufficiency
Exercise Helps. Regular exercise slows the rate of skeletal aging.Regardless of
age or gender, young children and adults who maintain physically active
lifestyles achieve greater bone mass compared with sedentary counterparts.
For men and women who remain physically active, even at ages 70 and
80 years, bone mass exceeds that of sedentary individuals of similar age. The
decline in vigorous exercise as one ages closely parallels the age-related loss of
bone mass.
Exercise of moderate intensity provides a safe and potent stimulus to main-
tain and even increase bone mass.Weight-bearing exercise represents a partic-
ularly desirable form of exercise; examples include walking,
running, dancing, and rope skipping. Resistance training,
which generates considerable muscular force against the
body’s long bones, also proves beneficial. Exercise benefi
depend on adequate calcium availability for the bone-
forming process.
Female Athlete Triad: An Unexpected Problem
for Women Who Train Intensely A paradox exists
between exercise and bone dynamics for athletic pre-
menopausal women. Women who train intensely and empha-
size weight loss often engage indisordered eating behaviors,
which in the extreme, cause life-threatening complications
(see How to Recognize Warning Signs of Disordered Eating in
Chapter 2 Macronutrients and Micronutrients • 63
For Your Information
FIFTEEN RISK FACTORS FOR OSTEOPOROSIS
1. Advancing age
2. History of fracture as an adult, independent of cause
3. History of fracture in a parent or sibling
4. Cigarette smoking
5. Slight build or tendency toward being underweight
6. White or Asian female
7. Sedentary lifestyle
8. Early menopause
9. Eating disorder
10. High protein intake (particularly animal protein)
11. Excess sodium intake
12. Alcohol abuse
13. Calcium-deficient diet before and after menopause
14. High caffeine intake (equivocal)
15. Vitamin D deficiency (prevalent in 40% of adults)
For Your Information
BONE HEALTH DIAGNOSTIC CRITERIA BASED ON
VARIATION (STANDARD DEVIATION [SD]) OF OBSERVED
BONE DENSITY VALUES COMPARED WITH VALUES FOR
A GENDER-MATCHED YOUNG ADULT POPULATION
Normal 1.0 SD below mean
Osteopenia 1.0 to 2.5 SD below mean
Osteoporosis 2.5 SD below mean
Severe 2.5 SD below mean plus one
osteoporosis or more fragility fractures
For Your Information
REGULAR EXERCISE AND INCREASED MUSCLE
STRENGTH SLOW SKELETAL AGING
Moderate- to high-intensity aerobic exercise (weight
bearing) performed 3 days per week for 50 to 60 minutes
each builds bone and retards its rate of loss. Muscle-
strengthening exercises also benefit bone mass. Individuals
with greater back strength and those who train regularly
with resistance exercise have a greater spinal bone mineral
content than weaker and untrained individuals.
LWBK710-c02_31-80.qxd 9/15/10 9:20 AM Page 63 Aptara](https://image.slidesharecdn.com/essentialsofexercisephysiology4aedkatchmcardlekatch-220619181003-c34e0a40/85/Exercise-Physiology-77-320.jpg)


![CALORIE—A MEASUREMENT
OF FOOD ENERGY
One kilogram–calorie (kilocalorie [kCal], or simply calo-
rie) expresses the quantity of heat necessary to raise the
temperature of 1 kg (1 L) of water 1 C (from 14.5 to
15.5C). For example, if a particular food contains 300 kCal,
then releasing the potential energy trapped within this
food’s chemical structure increases the temperature of 300 L
of water by 1C. Different foods contain different amounts
of potential energy. For example, one Triple Whopper
hamburger with medium French fries and a CocaCola from
Burger King (www.bk.com) contains 1930 kCal (about 60%
of fat kCal from the burger and fries). The equivalent heat
energy increases the temperature of 1930 L of water by 1
C.
Gross Energy Value of Foods
Laboratories usebomb calorimeters,similar to the one illus-
trated in Figure 3.1, to measure the total or gross energy
value of various food macronutrients. Bomb calorimeters
operate on the principle of direct calorimetry, measuring
the heat liberated as the food burns completely. The bomb
calorimeter works as follows:
• A small, insulated chamber filled with oxygen unde
pressure contains a weighed portion of food.
• The food literally explodes and burns when an
electric current ignites an electric fuse within the
chamber.
• A surrounding water bath absorbs the heat released
as the food burns (termed theheat of combustion).
An insulating water jacket surrounding the bomb
prevents heat loss to the outside.
• A sensitive thermometer measures the heat absorbed
by the water. For example, the complete combustion
of one beef, skinless, 20oz hot dog and a 1.4-oz bun
with mustard and small French fries (2.4 oz)
liberates 512 kCal of heat energy. This would raise
5.12 kg (11.3 lb) of ice water to the boiling point.
Heat of Combustion The heat liberated by the
burning or oxidation of food in a bomb calorimeter repre-
sents its heat of combustion (total energy value of the
food). Burning 1 g of pure carbohydrate yields a heat of com-
bustion of 4.20 kCal, 1 g of pure protein releases 5.65 kCal,
and 1 g of pure lipid yields 9.45 kCal.Because most foods in
the diet consist of various proportions of these three
macronutrients, the caloric value of a given food reflects th
sum of the heats of combustion for these three macronutri-
ents. This value demonstrates that complete lipid oxida-
tion in the bomb calorimeter liberates about 65% more
energy per gram than protein oxidation and 120% more
energy than carbohydrate oxidation.
Net Energy Value of Foods
Differences exist in the energy value of foods when com-
paring the heat of combustion (gross energy value) deter-
mined by direct calorimetry with thenet energy available
to the body. This pertains particularly to protein because
its nitrogen component does not oxidize. In the body,
nitrogen atoms combine with hydrogen to form urea,
which excretes in urine. Elimination of hydrogen in this
manner represents a loss of approximately 19% of pro-
tein’s potential energy. The hydrogen loss reduces pro-
tein’s heat of combustion in the body to about 4.6 kCal
per gram instead of 5.65 kCal per gram in the bomb
calorimeter. In contrast, identical physiologic fuel values
exist for carbohydrates and lipids (neither contains nitro-
gen) compared with their heats of combustion in the
bomb calorimeter.
Digestive Efficiency
The ingested macronutrient availability to the body deter-
mines their ultimate caloric yield. Availability refers to
82 • SECTION II Nutrition and Energy
Part 1 Food as Energy
Electrical
ignition
Thermometer
Oxygen inlet
Water bath
mixer
Food
sample
Pressurized
oxygen
Bomb
Electric
fuse
Air space
Insulating
container
Water
bath
Oxygen
source
Mixing
motor
Figure 3.1 Bomb calorimetry directly measures the energy
value of food.
LWBK710-c03_81-108.qxd 9/15/10 9:21 AM Page 82 Aptara](https://image.slidesharecdn.com/essentialsofexercisephysiology4aedkatchmcardlekatch-220619181003-c34e0a40/85/Exercise-Physiology-98-320.jpg)


![population groups, the EAR provides a useful value for determining the
prevalence of inadequate nutrient intake by the proportion of the popu-
lation with intakes below this value.
2. RDA: The average daily nutrient intake level sufficient to meet th
requirement of nearly 97% to 98% of healthy individuals in a particular
life stage and gender group. For most nutrients, this value represents the
EAR plus two standard deviations of the requirement.
3. AI: The AI provides a nutritional goal when no RDA exists. It represents
a recommended average daily nutrient intake level based on observed or
experimentally determined approximations or estimates of nutrient
intake by a group (or groups) of apparently healthy people that are
assumed as adequate; the AI is used when an RDA cannot be
determined. The risk is low when intake is at or above the AI level.
4. UL: The highest average daily nutrient intake level likely to pose no risk
of adverse health effects to almost all individuals in the specified gende
and life stage group of the general population. The potential risk of
adverse effects increases as intake increases above the UL.
The DRI report reveals that fruits and vegetables yield about one-half as
much vitamin A as previously believed. This means that individuals who do not
eat vitamin A–rich, animal-derived foods should upgrade their intake of
carotene-rich fruits and vegetables. The report also sets a daily maximum intake
level for vitamin A in addition to boron, copper, iodine, iron, manganese,
molybdenum, nickel, vanadium, and zinc. Specific recommended intakes ar
provided for vitamins A and K, chromium, copper, iodine, manganese, molyb-
denum, and zinc. The report concludes that one can meet the daily requirement
for the nutrients examined without supplementation. The exception is iron
intake for which most pregnant women need supplements to meet their
increased daily requirements.
Table 3.3 presents the RDIs for the vitamins for different life stage groups.
Well-balanced meals provide an adequate quantity of all vitamins, regardless of
a person’s age and physical activity level. Similarly, mineral supplements gener-
ally confer little benefit because the required minerals occur readily in food an
water. Individuals who expend considerable energy exercising generally donot
need to consume special foods or supplements that increase their micronutrient
intake above recommended levels. Also, at high levels of daily physical activity,
Chapter 3 Food Energy and Optimum Nutrition for Exercise • 89
Intake Needed to Meet Requirements
EAR RDA
Number
of
People
2 sd
3% of
population
needs more
than RDA
Figure 3.2 Theoretical distribution of the number of people adequately nourished
by a given nutrient intake. For example, the number of people receiving adequate
nutrition with 50 units of the nutrient is greater than those receiving only 15 units or
who require 75 units. The Recommended Dietary Allowance (RDA) is set at an intake
level that would meet the nutrient needs of 97% to 98% of the population (2 standard
deviations [SD] above the mean). The Estimated Average Requirement (EAR)
represents a nutrient intake value estimated to meet the requirement of 50% of the
healthy individuals in a gender and life stage group.
Questions Notes
Briefly explain how the DRIs differ fro
the RDAs.
Name the 4 different parts of the DRIs.
1.
2.
3.
4.
Explain the difference between “RDA” and
“EAR.”
For Your Information
HEART-DIET LINKS
Research published in the Archives of
Internal Medicine based on analysis
of more than 200 studies involving
millions of people indicates that veg-
etables, nuts, and the Mediterranean
diet (rich in vegetables, nuts, whole
grains, fish, and olive oil) make the
list of “good” heart-healthy foods.
Foods on the “bad” list include
starchy carbohydrates such as white
bread, and the trans fats in many
cookies and French fries. Insufficient
evidence exists to conclude that meat,
eggs, and milk are either good or bad
for the heart.
LWBK710-c03_81-108.qxd 9/15/10 9:21 AM Page 89 Aptara](https://image.slidesharecdn.com/essentialsofexercisephysiology4aedkatchmcardlekatch-220619181003-c34e0a40/85/Exercise-Physiology-105-320.jpg)


![effects of exogenous glutamine have promoted specula-
tion that supplementation might benefit resistance
training effects. Daily glutamine supplementation (0.9 g
per kg lean tissue mass) during 6 weeks of resistance
training in healthy young adults did not affect muscle
performance, body composition, or muscle protein
degradation compared with a placebo. Any objective
decision about glutamine supplements for ergogenic
purposes must await supportive research studies, which
presently are lacking.
Phosphatidylserine
Phosphatidylserine (PS) represents a glycerophospho-
lipid typical of a class of natural lipids that comprise the
structural components of biological membranes, partic-
ularly the internal layer of the plasma membrane that
surrounds all cells. Speculation exists that PS, through
its potential for modulating functional events in cell
membranes (e.g., number and affinity of membrane
receptor sites), modifies the body’s neuroendocrine
response to stress.
In one study, nine healthy men received 800 mg of PS
derived from bovine cerebral cortex in oral form daily for
10 days. Three 6-minute intervals of cycle ergometer exer-
cise of increasing intensity induced physical stress. Com-
pared with the placebo condition, the PS treatment
diminished ACTH and cortisol release without affecting
growth hormone (GH) release. These results confirme
earlier findings by the same researchers that a single
intravenous PS injection counteracted hypothalamic–
pituitary–adrenal axis activation with exercise. Soybean
lecithin provides the majority of PS supplementation by
athletes, yet the research showing physiologic effects has
used bovine-derived PS. Subtle differences in the chemical
structure of these two forms of PS may create differences in
physiologic action, including the potential ergogenic
effects of this compound.
-HYDROXY--METHYLBUTYRATE
-Hydroxy--methylbutyrate (HMB), a bioactive metabo-
lite generated in the breakdown of the essential branched-
chain amino acid leucine, decreases protein loss during
stress by inhibiting protein catabolism. In rats and chicks,
less protein breakdown and a slight increase in protein
synthesis occurred in muscle tissue (in vitro) exposed to
HMB. An HMB-induced increase occurred in fatty acid oxi-
dation in mammalian muscle cells exposed to HMB.
Depending on the quantity of HMB in food (relatively rich
sources include catfish, grapefruit, and breast milk)
humans synthesize between 0.3 and 1.0 g of HMB daily,
with about 5% from dietary leucine catabolism. HMB sup-
plements are taken because of their potential nitrogen-
retaining effects to prevent or slow muscle damage and
inhibit muscle breakdown (proteolysis) with intense phys-
ical effort.
Research has studied the effects of exogenous HMB on
skeletal muscle response to resistance training. In part one
of a two-part study ( Fig. 4.3), young men participated in
two randomized trials. In the first study, 41 subject
received either 0, 1.5, or 3.0 g of HMB daily at two protein
levels, either 117 g or 175 g daily, for 3 weeks. The men
resistance trained during this time for 1.5 hours, 3 days a
week. In the second study, 28 subjects consumed either 0
or 3.0 g of HMB daily and resistance trained for 2 to
3 hours, 6 days a week, for 7 weeks. In the first study, HM
supplementation depressed the exercise-induced increase
in muscle proteolysis reflected by urinary 3-methylhisti
dine and plasma creatine phosphokinase [CPK] levels
during the first 2 weeks of training. These biochemica
indices of muscle damage were 20% to 60% lower in the
HMB-supplemented group. In addition, the supplemented
116 • SECTION II Nutrition and Energy
800
0
200
400
600
-200
-1.5
Fat-free
body
mass
gain
(kg)
Change
in
total
body
strength
(kg)
Week 1 Week 3
10
0 20 30 40 50
3.5
-0.5
0.5
1.5
2.5
1.5g HMB
3.0g HMB
Placebo
Control
HMB + nutrient
powder
Day of study
A
B
Figure 4.3 A. Change in muscle strength (total weight lifted
in upper- and lower-body exercises) during study 1 (week 1–
week 3) in subjects who supplemented with-hydroxy--
methylbutyrate (HMB). Each group of bars represents one com-
plete set of upper- and lower-body workouts.B. Total-body
electrical conductivity-assessed change in fat-free mass (FFM)
during study 2 for a control group that received a carbohydrate
drink (placebo) and a group that received 3 g of Ca-HMB each
day mixed in a nutrient powder (HMB nutrient powder).
(From Nissen, S., et al.: Effect of leucine metabolite-
hydroxy–-methylbutyrate on muscle metabolism during
resistance-exercise training. J. Appl. Physiol., 81:2095,1996.)
LWBK710-c04_109-148.qxd 9/15/10 9:23 AM Page 116 Aptara](https://image.slidesharecdn.com/essentialsofexercisephysiology4aedkatchmcardlekatch-220619181003-c34e0a40/85/Exercise-Physiology-134-320.jpg)
![group lifted more total weight during each training week (see Fig. 4.3A), with
the greatest effect in the group receiving the largest HMB supplement. Muscu-
lar strength increased 8% in the unsupplemented group and more in the HMB-
supplemented groups (13% for the 1.5-g group and 18.4% for the 3.0-g group).
Added protein (not indicated in the graph) did not affect any of the measure-
ments; one should view this lack of effect in proper context—the “lower” pro-
tein quantity (115 gd1
) equaled twice the RDA.
In the second study, individuals who received HMB supplementation had
higher fat-free mass (FFM) than the unsupplemented group at 2 and 4 to 6
weeks of training (seeFig. 4.3B). At the last measurement during training, how-
ever, the difference between groups decreased and failed to differ from the dif-
ference between pretraining baseline values.
The mechanism for any HMB effect on muscle metabolism, strength
improvement, and body composition remains unknown. Perhaps this metabo-
lite inhibits normal proteolytic processes that accompany intense muscular
overload. Although the results demonstrate an ergogenic effect for HMB sup-
plementation, it remains unclear just what component of the FFM (protein,
bone, water) HMB affects. Furthermore, the data inFigure 4.3B indicate poten-
tially transient body composition benefits of supplementation that tend t
revert toward the unsupplemented state as training progresses.
N ot all research shows beneficial effects of HMB supplementation wit
resistance training. One study evaluated the effects of variations in HMB
supplementation (approximately 3 g d1
vs. 6 g d1
) on muscular strength
during 8 weeks of whole-body resistance training in untrained young men. The
study’s primary finding indicated that HMB supplementation, regardless o
dosage, produced no difference in most of the strength data (including 1-repeti-
tion maximum [1-RM] strength) compared with the placebo group. Additional
studies must assess the long-term effects of HMB supplements on body compo-
sition, training response, and overall health and safety.
CHROMIUM
The trace mineral chromium serves as a cofactor for potentiating insulin func-
tion, although its precise mechanism of action remains unclear. Chronic
chromium deficiency may trigger an increase in blood cholesterol and decreas
the body’s sensitivity to insulin, thus increasing the risk of type 2 diabetes. In all
likelihood, some adult Americans consume less than the 50 to 200 mg of
chromium, which is considered by the National Research Council Food and
N utrition Board’s the Estimated Safe and Adequate Daily Dietary Intake
(ESADDI). This occurs largely because chromium-rich foods such as brewer’s
yeast, broccoli, wheat germ, nuts, liver, prunes, egg yolks, apples with skins,
asparagus, mushrooms, wine, and cheese do not usually constitute part of the
regular daily diet. Food processing removes chromium from foods in natural
form, and strenuous exercise and associated high carbohydrate intake also
promote urinary chromium losses to increase the potential for chromium
deficiency. For athletes with documented chromium-deficient diets, dieta
modifications or use of chromium supplements to increase chromium intak
seem prudent.
Chromium’s Alleged Benefits
Chromium, touted as a “fat burner” and “muscle builder,” represents one of
the largest selling mineral supplements in the United States, second only to
calcium. Supplement intake of chromium, usually as chromium picolinate,
often achieves 600 g daily. This picolinic acid combination supposedly
improves chromium absorption compared with the inorganic salt chromium
chloride.
Chapter 4 Nutritional and Pharmacologic Aids to Performance • 117
For Your Information
POTENTIAL RISKS OF CHROMIUM
EXCESS
Concerning the bioavailability of
trace minerals in the diet, excessive
dietary chromium inhibits zinc and
iron absorption. At the extreme, this
could induce iron-deficiency anemia,
blunt the ability to train intensely,
and negatively affect exercise
performance requiring high-level
aerobic metabolism.
Further potential bad news
emerges from studies in which human
tissue cultures that received extreme
doses of chromium picolinate showed
eventual chromosomal damage. Crit-
ics contend that such high laboratory
dosages would not occur with supple-
ment use in humans. Nonetheless,
one could argue that cells continually
exposed to excessive chromium (e.g.,
long-term supplementation) accumu-
late this mineral and retain it for years.
Questions Notes
Briefly describe the ergogenic benefits
HMB ingestion.
LWBK710-c04_109-148.qxd 9/15/10 9:23 AM Page 117 Aptara](https://image.slidesharecdn.com/essentialsofexercisephysiology4aedkatchmcardlekatch-220619181003-c34e0a40/85/Exercise-Physiology-135-320.jpg)


![performance and training responses. Besides benefitin
weight lifting and body building, improved immediate
anaerobic power output capacity benefits sprint running
cycling; swimming; jumping; and all-out, repetitive rapid
movements in football and volleyball. Increased intra-
muscular PCr concentrations should also enable individ-
uals to increase training intensity in strength and power
activities.
Oral supplements of creatine monohydrate (20–25 g
per day) increase muscle creatine and performance in
high-intensity exercise, particularly repeated intense mus-
cular effort. The ergogenic effect does not vary between
vegetarians and meat eaters. Even daily low doses of 6 g
for 5 days improve repeated power performance. For Divi-
sion I football players, creatine supplementation during
resistance training increased body mass, lean body mass,
cellular hydration, and muscular strength and perform-
ance. Similarly, supplementation augmented muscular
strength and size increases during 12 weeks of resistance
training.
Taking a high dose of creatine helps replenish muscle
creatine levels after intense exercise. Such metabolic
“reloading” should facilitate recovery of muscle contrac-
tile capacity, thus enabling athletes to sustain repeated
efforts of intense exercise. Also, only limited information
exists about long-term high doses of creatine supplemen-
tation in healthy individuals, particularly the effects on
cardiac muscle and kidney function (creatine degrades to
creatinine before excretion in urine). Short-term use (e.g.,
20 g per day for 5 consecutive days) in healthy men does
not detrimentally impact blood pressure, plasma creatine,
plasma creatine kinase (CK) activity, or renal responses
assessed by glomerular filtration rate and rates of tota
protein and albumin excretion. For healthy subjects, no
differences emerged in plasma content and urine excre-
tion rate for creatinine, urea, and albumin between con-
trol subjects and those consuming creatine for between 10
months and 5 years.
Creatine supplementation does not improve exercise
performance that requires high levels of aerobic energy
transfer or cardiovascular and metabolic responses. It also
exerts little effect on isometric muscular strength or
dynamic muscle force during a single movement.
Effects on Body Mass and Body Composition
Body mass increases of between 0.5 and 2.4 kg often
accompany creatine supplementation independent of
short-term changes in testosterone or cortisol concentra-
tions. It remains unclear how much of the weight gain
occurs from anabolic effects of creatine on muscle tissue
120 • SECTION II Nutrition and Energy
Post-loading
Pre-loading
220
240
260
280
200
Work
done
(kJ)
300
Creatine Placebo
Hydration
status of cell
Pre-exercise
PCr availability
Exogenous
Cr monohydrate
Intramuscular
Cr and PCr
Delay onset
of fatigue
pH
[Lactate] [H+]
Dependence
on glycolysis Pre-exercise
Cr availability
Short-term
muscular
performance
[PCr] at start of
next exercise bout
PCr resynthesis
Flux through Cr
kinase reaction
Training
intensity
Fat-free mass
Diameter of
Type II fibers
Protein synthesis
Figure 4.4 Effects of creatine loading versus placebo on total
work accomplished during long-term (80-min) repetitive sprint-
cycling performance. (From Preen, C.D., et al.: Effect of creatine
loading on long-term sprint exercise performance and metabo-
lism. Med. Sci. Sports Exerc., 33:814, 2001.)
Figure 4.5 Possible mechanisms for how elevating intracellu-
lar creatine (Cr) and phosphocreatine (PCr) might enhance
intense, short-term exercise performance and the exercise train-
ing response. (Modified from Volek, J.S., Kraemer, W.J.: Creatin
supplementation: Its effect on human muscular performance and
body composition. J. Strength Cond. Res., 10:200, 1996.)
LWBK710-c04_109-148.qxd 9/15/10 9:23 AM Page 120 Aptara](https://image.slidesharecdn.com/essentialsofexercisephysiology4aedkatchmcardlekatch-220619181003-c34e0a40/85/Exercise-Physiology-138-320.jpg)

![A rapid and effective way to “creatine load” skeletal muscle
requires ingesting 20 g of creatine monohydrate daily for 6
days and then switching to 2 gd1
. This keeps levels elevated
for up to 28 days.If rapidity of “loading” is not a considera-
tion, supplementing 3 g daily for 28 days achieves approx-
imately the same high levels.
RIBOSE: AN ALTERNATIVE
TO CREATINE ON THE
SUPPLEMENT SCENE
Ribose has emerged as a competitor supplement to creatine
to increase power and replenish high-energy compounds
after intense exercise. The body readily synthesizes ribose,
and the diet provides small amounts in ripe fruits and veg-
etables. Metabolically, the 5-carbon ribose sugar serves as an
energy substrate for ATP resynthesis. Consuming exoge-
nous ribose has been touted to quickly restore depleted
ATP. To maintain optimal ATP levels and thus provide its
ergogenic effect, recommended ribose doses range from 10
to 20 g per day. A compound that either increases ATP levels
or facilitates its resynthesis could certainly benefit short
term, high-power output physical activities, yet only limited
data have assessed this potential. A double-blind random-
ized experiment evaluated the effects of four doses of oral
ribose daily at 4 g per dose on repeated bouts of maximal
exercise and ATP replenishment after intermittent maximal
muscle contractions. No difference in intermittent isokinetic
knee extension force, blood lactate, or plasma ammonia con-
centration emerged between ribose and placebo trials. The
exercise decreased intramuscular ATP and total adenine
nucleotide content immediately after exercise and 24 hours
later, yet oral ribose administration proved ineffective to
facilitate recovery of these compounds.
GINSENG AND EPHEDRINE
The popularity of herbal and botanical remedies has soared
as possible ways to improve health, control body weight,
and improve exercise performance.Ginseng and ephedrine
are marketed as nutritional supplements to “reduce stress,”
“revitalize,” and “optimize mental and physical perform-
ance,” particularly during times of fatigue and stress. Gin-
seng also is touted to play a role as an alternative therapy to
treat diabetes, stimulate immune function, and improve
male fertility. Clinically, 1 to 3 g of ginseng administered 40
minutes before an oral glucose challenge reduces postpran-
dial glycemia in subjects without diabetes. As with caffeine,
ephedrine and ginseng occur naturally and, for decades,
have been used in folk medicine to enhance “energy.”
Ginseng
Used in Asian medicine to prolong life, strengthen and
restore sexual functions, and invigorate the body, the gin-
seng root (often sold as Panax or Chinese or Korean gin-
seng), serves no recognized medical use in the United
States except as a soothing agent in skin ointments. Com-
mercial ginseng root preparations usually take the form of
powder, liquid, tablets, or capsules. Widely marketed
foods and beverages also contain various types and
amounts of ginsenosides. Because dietary supplements
need not meet the same quality control for purity and
potency as pharmaceuticals, considerable variation exists
in the concentrations of marker compounds for ginseng,
including levels of potentially harmful impurities, toxic
pesticides, and heavy metal contamination like lead, cad-
mium, mercury, arsenic. N either the Food and Drug
Administration (FDA; www.fda.gov) nor state or federal
agencies routinely test ginseng-containing products or
other supplements for quality.
Reports of ginsing’s ergogenic possibilities often appear
in the lay literature, but a review of the research provides
little evidence to support its effectiveness for these pur-
poses. For example, volunteers consumed either 200 or
400 mg of the standardized ginseng concentrate every day
for 8 weeks in a double-blind research protocol. Neither
treatment affected submaximal or maximal exercise per-
formance, ratings of perceived exertion, heart rate, oxygen
consumption, or blood lactate concentrations. Similarly,
no ergogenic effects emerged on diverse physiologic and
performance variables after a 1-week treatment with a gin-
seng saponin extract administered in two doses of either 8
or 16 mg per kg of body mass. When effectiveness has been
demonstrated, the research has failed to use adequate con-
trols, placebos, or double-blind testing protocols. At pres-
ent, no compelling scientific evidence exists that ginsen
supplementation offers any ergogenic benefit for physiologi
function or exercise performance.
Ephedrine
Unlike ginseng, Western medicine had recognized the
potent amphetamine-like compound ephedrine (with sym-
pathomimetic physiologic effects) found in several species
of the plant ephedra (dried plant stem called ma huang [ma
wong, ephedra sinica]). The ephedra plant contains
ephedrine and pseudoephedrine, the two major active
components first isolated by a Japanese researcher in 1928
The medicinal role of this herb has included treating
asthma, symptoms of the common cold, hypotension, and
urinary incontinence and as a central stimulant to treat
depression. Physicians in the United States discontinued
ephedrine’s use as a decongestant and asthma treatment in
the 1930s in favor of safer medications.
Ephedrine exerts both central and peripheral effects,
with the latter reflected in increased heart rate, cardiac out
put, and blood pressure. Because of its-adrenergic effect,
ephedrine causes bronchodilation in the lungs. High
ephedrine dosages can produce hypertension, insomnia,
hyperthermia, and cardiac arrhythmias. Other possible
side effects include dizziness, restlessness, anxiety, irri-
tability, personality changes, gastrointestinal symptoms,
and difficulty concentrating
122 • SECTION II Nutrition and Energy
LWBK710-c04_109-148.qxd 9/15/10 9:23 AM Page 122 Aptara](https://image.slidesharecdn.com/essentialsofexercisephysiology4aedkatchmcardlekatch-220619181003-c34e0a40/85/Exercise-Physiology-140-320.jpg)
![The potent physiologic effects of ephedrine have led researchers to investi-
gate its potential as an ergogenic aid. No effect of a 40-mg dose of ephedrine
occurred on indirect indicators of exercise performance or ratings of perceived
exertion (RPE; see Chapter 13). The less concentrated pseudoephedrine also
produced no effect on V
.
O2max, RPE, aerobic cycling efficiency, anaerobic powe
output (Wingate test), time to exhaustion on a bicycle and a 40-km cycling
trial, or physiologic and performance measures during 20 minutes of running at
70% of V
.
O2max followed by a 5000-m time trial.
FDA Bans Ephedrine In early 2004, the United States federal govern-
ment announced a ban on the sale of ephedra, the latest chapter in a long story
that gained national prominence after the deaths of two football players (a pro-
fessional National Football League [NFL] all-pro player and a university ath-
lete) were linked to ephedra use in 2001. A little more than 1 month after the
death of one of its players, the NFL was the first sports governing body to ba
ephedra. In February 2003, the FDA announced a series of measures that
included strong enforcement actions against firms making unsubstantiate
claims for their ephedra-containing products. In early 2004, the ban on
ephedrine took effect (www.fda.gov/ola/2003/dietarysupplements1028.html and
www.cfsan.fda.gov/dms/ds-ephed.html). A Utah judge then countered and
blocked the FDA’s action against Nutraceutical Corporation (a Utah-based cor-
poration), and the banned herbal compound ephedra could again be marketed
and sold to the general public. Nutraceutical had argued that ephedra was “safe”
at recommended doses and accused the FDA of failing to adequately assess
ephedra’s effects at lower dosage levels. Finally, the U.S. Supreme Court in 2007
issued a “certiorari denied” without comment in the case, rejecting the lower
court’s challenge to the FDA’s ban of ephedra. This final decision should onc
and for all curtail this product from being sold to an eager public looking for an
“edge” in health and fitness
AMINO ACID SUPPLEMENTS AND
OTHER DIETARY MODIFICATIONS
FOR AN ANABOLIC EFFECT
Many athletes and the lay public regularly consume amino acid supplements
believing they boost testosterone, GH, insulin, and insulin-like growth factor I
(IGF-I) to improve muscle size and strength and decrease body fat. The rationale for
trying such nutritional ergogenic stimulants comes from the clinical use of amino
acid infusion or ingestion in deficient patients to regulate anabolic hormones
Research on healthy subjects does not provide convincing evidence for an
ergogenic effect of the generalized use of amino acid supplements on hormone secre-
tion, responsiveness to workouts, or exercise performance. In studies with appro-
priate design and statistical analysis, supplements of arginine, lysine, ornithine,
tyrosine, and other amino acids, either singularly or in combination, produced
no effect on GH levels or insulin secretion or on diverse measures of anaerobic
power and all-out running performance at V
.
O2max. Furthermore, elite junior
weight lifers who supplemented with all 20 amino acids did not improve their
physical performance or resting or exercise-induced responses of testosterone,
cortisol, or GH. The indiscriminate use of amino acid supplements at dosages
considered pharmacologic rather than nutritional increases risk of direct toxic
effects or creation of an amino acid imbalance.
Prudent Means to Possibly Augment
an Anabolic Effect
With resistance training, muscle hypertrophy occurs from a shift in the body’s nor-
mal dynamic state of protein synthesis and degradation to greater tissue synthesis.
Chapter 4 Nutritional and Pharmacologic Aids to Performance • 123
LWBK710-c04_109-148.qxd 9/15/10 9:23 AM Page 123 Aptara](https://image.slidesharecdn.com/essentialsofexercisephysiology4aedkatchmcardlekatch-220619181003-c34e0a40/85/Exercise-Physiology-141-320.jpg)


![Chapter 5 Fundamentals of Human Energy Transfer • 161
Muscle contraction
Nerve
transmission
Circulation
Tissue synthesis
Glandular
secretion
Digestion
ADENOSINE O P O P P OH
O
OH
O
OH
O
OH
Amino acids
Hypothalamus
O
Protein
Figure 5.7 Adenosine triphosphate (ATP) represents the energy currency that powers all forms of biologic work.
anaerobic energy resources invariably provides the energy to perform these rel-
atively short-duration activities.
Adenosine Triphosphate: A Limited Currency
A limited quantity of ATP serves as the energy currency for all cells. In fact, at any
one time, the body stores only 80 to 100 g (3.5 oz) of ATP. This provides enough
intramuscular stored energy for several seconds of explosive, all-out exercise. A
limited quantity of “stored” ATP represents an additional advantage because of its
molecule’s heaviness. Biochemists estimate that a sedentary person each day uses
an amount of ATP approximately equal to 75% of body mass. For an endurance
athlete running a marathon race and generating 20 times the resting energy
expenditure over 3 hours, the total equivalent ATP usage could amount to 80 kg.
Cells store only a small quantity of ATP so it must be resynthesized continu-
ally at its rate of use. This provides a biologically useful mechanism for regulat-
ing energy metabolism. By maintaining only a small amount of ATP, its relative
concentration and corresponding concentration of ADP changes rapidly with
any increase in a cell’s energy demands. An ATP:ADP imbalance at the start of
exercise immediately stimulates the breakdown of other stored energy-containing
compounds to resynthesize ATP. As one might expect,
increases in cellular energy transfer depend on exercise
intensity. Energy transfer increases about fourfold in the
transition from sitting in a chair to walking. Changing
from a walk to an all-out sprint rapidly accelerates energy
transfer rate within active muscle about 120 times within
active muscle. Generating considerable energy output
almost instantaneously demands ATP availability and a
means for its rapid resynthesis.
PHOSPHOCREATINE: ENERGY RESERVOIR
The hydrolysis of a phosphate from another intracellular high-energy phos-
phate compound—phosphocreatine (PCr) (also known as creatine phosphate
[CP]), provides some energy for ATP resynthesis. PCr, similar to ATP, releases
For Your Information
TRAINING THE IMMEDIATE ENERGY SYSTEM
Exercise training increases the muscles’ quantity of high-
energy phosphates. The most effective training uses repeat
6- to 10-second intervals of maximal exercise in the specific
activity requiring improved sprint-power capacity.
Questions Notes
List the 6 forms of biologic work powered
by ATP.
1.
2.
3.
4.
5.
6.
LWBK710-c05_149-184.qxd 9/15/10 10:46 PM Page 161 Aptara](https://image.slidesharecdn.com/essentialsofexercisephysiology4aedkatchmcardlekatch-220619181003-c34e0a40/85/Exercise-Physiology-179-320.jpg)


![168 • SECTION III Energy Transfer
5. The central nervous system requires an uninterrupted
stream of carbohydrates to function optimally.
The complete breakdown of one mole of glucose (180 g)
to carbon dioxide and water yields a maximum of 686 kCal
of chemical-free energy available for work.
C6H12O6 6 O2 S 6 CO2 6 H2O G 686 kCalmol1
In the body, glucose breakdown liberates the same quan-
tity of energy, with a large portion conserved as ATP. Syn-
thesizing 1 mole of ATP from ADP and phosphate ion
requires 7.3 kCal of energy. Therefore, coupling all of the
energy from glucose oxidation to phosphorylation could
theoretically form 94 moles of ATP per mole of glucose
(686 kCal 7.3 kCal per mole 94 moles). In the muscles,
however, the phosphate bonds only conserve 34% or 233 kCal
of energy, with the remainder dissipated as heat. This loss
of energy represents the body’s metabolic inefficienc for
converting stored potential energy into useful energy. In
summary, glucose breakdown regenerates a net gain of
32 moles of ATP (net gain because 2 ATPs degrade to initiate
glucose breakdown) per mole of glucose (233 kCal 7.3 kCal
per mole 32 ATP). An additional ATP forms if carbohy-
drate breakdown begins with glycogen.
Anaerobic versus Aerobic
Two forms of the initial phase of carbohydrate breakdown
exist, collectively termed glycolysis (process of converting
glucose to pyruvate and generating ATP). In one stage of
glycolysis, lactate (formed from pyruvate) becomes the end
product. In another stage, pyruvate remains the end sub-
strate, and carbohydrate catabolism proceeds and couples
to further breakdown (citric acid cycle) and electron trans-
port production of ATP. Carbohydrate breakdown of this
form (sometimes termedaerobic [with oxygen]glycolysis)
is a relatively slow process resulting in substantial ATP for-
mation. In contrast, glycolysis that results in lactate forma-
tion (referred to asanaerobic [without oxygen] glycolysis)
represents rapid but limited ATP production. The net for-
mation of either lactate or pyruvate depends more on the
relative glycolytic and mitochondrial activities than on the
presence of molecular oxygen. The relative demands for
rapid or slow ATP production determines the form of gly-
colysis. The glycolytic process itself, from beginning sub-
strate (glucose) to end substrate (lactate or pyruvate), does
not involve oxygen. It has become common to call these
two stages rapid (anaerobic) and slow (aerobic) glycolysis.
Anaerobic Energy From Glucose:
Rapid Glycolysis
The first stage of rapidglycolysis, during which glucose is
the substrate, is termed the Embden-Meyerhoff pathway
(named for the two German scientist discoverers); the term
glycogenolysis describes these reactions when they initi-
ate from stored glycogen. These series of reactions, sum-
marized in Figure 5.13, occur in the cell’s cytoplasm, the
watery medium outside of the mitochondrion. In a way,
glycolytic reactions represent a more primitive form of
energy transfer that is well developed in amphibians, rep-
tiles, fish, and marine mammals. In humans, the cells’ lim
ited capacity for rapid glycolysis assumes a crucial role
during physical activities that require maximal effort for up
to 90 seconds in duration.
In the first reaction, ATP acts as a phosphate donor t
phosphorylate glucose toglucose 6-phosphate.In most cells,
this reaction “traps” the glucose molecule. In the presence of
glycogen synthase, glucose links become polymerized with
other glucose molecules to form glycogen. In energy metab-
olism, glucose 6-phosphate changes to fructose 6-phos-
phate. At this stage, no energy extraction occurs, yet energy
incorporates into the original glucose molecule at the
expense of one ATP molecule. In a sense, phosphorylation
“primes the pump” for continued energy metabolism. The
fructose 6-phosphate molecule gains an additional phos-
phate and changes to fructose 1, 6-diphosphate under con-
trol of phosphofructokinase (PFK). The activity level of
this enzyme probably limits the rate of glycolysis during
maximum-effort exercise. Fructose 1, 6-diphosphate then
splits into two phosphorylated molecules with 3-carbon
chains; these further decompose to pyruvate in five suc
cessive reactions.
Figure 5.14 provides an overview of the glucose-to-
pyruvate sequence in terms of carbon atoms. Essentially,
the 6-carbon glucose compound splits into two inter-
changeable 3-carbon compounds. This ultimately pro-
duces two 3-carbon pyruvate molecules and generates
useful energy as ATP.
Most of the energy generated in glycolysis does not resyn-
thesize ATP but instead dissipates as heat. In reactions 7 and
10 in Figure 5.13, however, the energy released from the
glucose intermediates stimulates the direct transfer of phos-
phate groups to ADPs, generating four molecules of ATP.
Because two molecules of ATP were lost in the initial phos-
phorylation of the glucose molecule, glycolysis generates a
net gain of 2 ATP molecules. Note that these specific energ
transfers from substrate to ADP do not require molecular
oxygen. Rather, energy directly transfers via phosphate
bonds in the anaerobic reactions. Energy conservation dur-
ing rapid glycolysis operates at an efficiency of about 30%
Rapid glycolysis generates only about 5% of the total
ATP during the glucose molecule’s complete degradation.
Examples of activities that rely heavily on ATP generated
by rapid glycolysis include sprinting at the end of a mile
run, swimming all-out from start to finish in a 50- and 100
m swim, routines on gymnastics apparatus, and sprint run-
ning up to 200 m.
Hydrogen Release During Rapid Glycolysis
During rapid glycolysis, two pairs of hydrogen atoms are
stripped away from the substrate (glucose), and their elec-
trons are passed to NAD
to form NADH (see Fig. 5.13).
Normally, if the respiratory chain processed these elec-
trons directly, 2.5 molecules of ATP would generate for
each N ADH molecule oxidized. The mitochondrion in
LWBK710-c05_149-184.qxd 9/15/10 10:46 PM Page 168 Aptara](https://image.slidesharecdn.com/essentialsofexercisephysiology4aedkatchmcardlekatch-220619181003-c34e0a40/85/Exercise-Physiology-186-320.jpg)


![aerobic and anaerobic metabolism. Five to 10 minutes of
intense middle-distance running and swimming or stop-
and-go sports such as basketball and soccer, demands
greater aerobic energy transfer. Longer duration marathon
running, distance swimming and cycling, recreational jog-
ging, cross-country skiing, and hiking and backpacking
require continual energy from aerobic resources without
reliance on lactate’s contribution.
Intensity and duration determine the energy system and
metabolic mixture used during exercise.The aerobic system
predominates in low-intensity exercise, with fat serving
as the primary fuel source. The liver markedly increases
its release of glucose to active muscle as exercise pro-
gresses from low to high intensity. Simultaneously, glyco-
gen stored within muscle serves as the predominant
carbohydrate energy source during the early stages of
exercise and when exercise intensity increases. The
advantage of selective dependence on carbohydrate metabo-
lism during near-maximum aerobic exercise lies in its two
times more rapid energy transfer capacity compared with fat
and protein fuels. Compared with fat, carbohydrate also
generates close to 6% greater energy per unit of oxygen
consumed. As exercise continues with accompanying
muscle glycogen depletion, progressively more fat (intra-
muscular triacylglycerols and circulating free fatty acids
[FFAs]) serves as the substrate for ATP production. In
maximal anaerobic effort, carbohydrate serves as the sole
contributor to ATP production in mainstream glycolytic
reactions.
A sound approach to exercise training first analyzes a
activity for its specific energy components and then estab
lishes a task-specific training regimen to ensure that optima
physiologic and metabolic adaptations occur. Improved
capacity for energy transfer should translate to improved
exercise performance.
Nutrient-Related Fatigue Severe depletion of
liver and muscle glycogen during intense aerobic exercise
induces fatigue despite sufficient oxygen availability t
muscle and an almost unlimited energy supply from
stored fat. Endurance athletes commonly refer to this
extreme sensation of fatigue as “bonking” or hitting the
wall. The image of hitting the wall suggests an inability to
continue exercising, which in reality does not occur,
although pain exists in the active muscles and exercise
intensity decreases markedly. Skeletal muscle does not
contain the phosphatase enzyme present in the liver that
helps release glucose from liver cells; this means that rela-
tively inactive muscle retains all of its glycogen. Contro-
versy exists as to why liver and muscle glycogen depletion
during prolonged exercise reduces exercise capacity.
Three factors are involved:
1. The central nervous system’s use of blood glucose
for energy.
2. Muscle glycogen’s role as a “primer” in fat
catabolism.
3. Significantly slower rate of energy release from fa
compared with carbohydrate oxidation.
OXYGEN UPTAKE DURING
RECOVERY: THE SO-CALLED
“OXYGEN DEBT”
Bodily processes do not immediately return to resting
levels after exercise. In light exercise (e.g., golf, archery,
bowling), recovery to a resting condition takes place rap-
idly and often progresses unnoticed. Intense physical
activity (e.g., running full speed for 800 m or trying to
swim 200 m as fast as possible) requires considerable
194 • SECTION III Energy Transfer
O2
Deficit
Recovery VO2
VO2max
Slow component
Exercise VO2
Rest Exercise Recovery
F
a
s
t
c
o
m
p
o
n
e
n
t
C All-out maximal exercise (aerobic – anaerobic)
B Moderate to heavy aerobic exercise
A Light aerobic exercise
Slow component
F
a
s
t
c
o
m
p
o
n
e
n
t
Rest Exercise Recovery
Exercise VO2
Recovery VO2
Rest
Exercise VO2
Recovery VO2
Steady-rate VO2 = energy requirement of exercise
Steady-rate VO2 = energy requirement of exercise
Energy requirement of exercise exceeds VO2max
Exercise Recovery
F
a
s
t
c
o
m
p
o
n
e
n
t
O2
Deficit
O2
Deficit
Figure 6.7 Oxygen uptake during exercise and recovery from
light steady-rate exercise (A), moderate to intense steady-rate
exercise (B), and exhaustive exercise with no steady rate of aero-
bic metabolism (C). The first phase (fast component) of recover
occurs rapidly; the second phase (slow component) progresses
more slowly and may take considerable time to return to resting
conditions. In exhaustive exercise, the oxygen requirement of
exercise exceeds the measured exercise oxygen uptake.
LWBK710-c06_185-202.qxd 9/16/10 5:58PM Page 194 LWBK710-Ind_685-698.qxd](https://image.slidesharecdn.com/essentialsofexercisephysiology4aedkatchmcardlekatch-220619181003-c34e0a40/85/Exercise-Physiology-212-320.jpg)


![210 • SECTION III Energy Transfer
BOX 7.2
Predicting Anaerobic Power and Capacity Using
the Wingate Cycle Ergometer Test
A mechanically braked bicycle ergometer serves as the
testing device. After warming-up (3–5 min), the subject
begins pedaling as fast as possible without resistance.
Within 3 seconds, a fixed resistance is applied to the fl
wheel; the subject continues to pedal “all out” for 30 sec-
onds. An electrical or mechanical counter continuously
records flywheel revolutions in 5-second intervals
RESISTANCE
Flywheel resistance equals 0.075 kg per kg body mass. For
a 70-kg person, the flywheel resistance equals 5.25 kg
(70 kg 0.075). Higher resistances (1.0 to 1.3 kg body
mass) are often used to test power- and sprint-type athletes.
TEST SCORES
1. Peak power output (PP): The highest power output,
observed during the first 5-second exercise interval
indicates the energy-generating capacity of the imme-
diate energy system (intramuscular high-energy
phosphates ATP and PCr). PP, expressed in watts
(1 W 6.12 kg-mmin1
), computes as Force
Distance (Number of revolutions Distance per rev-
olution) Time in minutes (5 s 0.0833 min).
2. Relative peak power output (RPP):Peak power out-
put relative to body mass: PP Body mass (in kg).
3. Anaerobic fatigue (AF): Percentage decline in power
output during the test; AF represents the total capac-
ity to produce ATP via the immediate and short-term
energy systems. AF computes as Highest 5-s
PP Lowest 5-s PP Highest 5-s PP 100.
4. Anaerobic capacity (AC): Total work accomplished
over 30 seconds; AC computes as the sum of each
5-second PP, or Force Total distance in 30seconds.
Example
A man weighing 73.3 kg (161.6 lb) performs the Wingate
test on a Monark cycle ergometer (6.0 m traveled per
pedal revolution) with an applied resistance of 5.5 kg
(73.3 kg body mass 0.075 5.497, rounded to 5.5 kg);
pedal revolutions for each 5-second interval equal 12, 10,
8, 7, 6, and 5 (48 total revolutions in 30 s).
Calculations
1. Peak power output (PP)
PP Force Distance Time
5.5 (12 rev 6 m) 0.0833
396 0.0833
4753.9 kg-mmin1
or 776.8 W
2. Relative Peak Power Output (RPP)
RPP PP Body mass, kg
776.8 W 73.3 kg
10.6 Wkg1
3. Anaerobic Fatigue (AF)
AF Highest PP Lowest PP
Highest PP 100
[Highest PP Force Distance
Time: 5.5 kg (12 rev 6 m)
0.0833 min 4753.9 kg-mmin1
or
776.8 W]
[Lowest PP Force Distance
Time: 5.5 kg (5 rev 6 m)
0.0833 min 1980.8 kg-mmin1
or
323.7 W]
776.8 W 323.7 W 776.8 W 100
58.3%
4. Anaerobic Capacity (AC)
AC Force Total Distance (in 30 s)
5.5 [(12 rev 10 rev 8 rev
7 rev 6 rev 5 rev) 6 m]
1584 kg-mmin1
or 258.8 W
CLOSE UP
LWBK710-c07_203-236.qxd 9/16/10 6:01PM Page 210 LWBK710-Ind_685-698.qxd](https://image.slidesharecdn.com/essentialsofexercisephysiology4aedkatchmcardlekatch-220619181003-c34e0a40/85/Exercise-Physiology-228-320.jpg)


![fixed, dedicated desktop systems or the traditional bag system. Figure 7.10
shows applications of a commerically available portable metabolic collections
system. New systems on the horizon include a miniaturized system that can be
worn on the wrist. In these applications, an onboard computer performs the
metabolic calculations based on electronic signals it receives from micro-
designed instruments that measure oxygen and carbon dioxide in expired air
and repiratory flow dynamics and volumes. Data are stored on microchips fo
later analyses. More advanced systems include automated blood pressure, heart
rate, and temperature monitors and preset instructions to regulate speed, dura-
tion, and workload of a treadmill, bicycle ergometer, stepper, rower, swim
flume, resistance device, or other exercise apparatus
Chapter 7 Measuring and Evaluating Human Energy-Generating Capacities During Exercise • 215
Questions Notes
Briefly describe the major differenc
between open- and closed-circuit spirome-
try procedures.
Give the percentage composition of oxygen,
carbon dioxide, and nitrogen in ambient air.
Figure 7.9 Oxygen uptake measurement by open-circuit spirometry (bag technique)
during stationary cycle ergometer exercise.
A B
Figure 7.10 Portable micro-metabolic collection system using the latest in miniature computer technology. Built-in oxygen and
carbon dioxide analyzer cells coupled with a highly sensitive micro-flow meter measure oxygen uptake by the open-circuit metho
during different activities such as (A) in-line skating and (B) wall climbing. (Photos courtesy of CareFusion Corporation, formerly
VIASYS Healthcare [SensorMedics, Jaeger]).
For Your Information
KILOCALORIE EQUIVALENT FOR 1 L
OXYGEN
Assuming the combustion of a mixed
diet, a rounded value of 5.0 kCal per
liter of oxygen consumed designates
the appropriate conversion factor for
estimating energy expenditure from
oxygen uptake under steady-rate con-
ditions of aerobic metabolism.
LWBK710-c07_203-236.qxd 9/16/10 6:01PM Page 215 LWBK710-Ind_685-698.qxd](https://image.slidesharecdn.com/essentialsofexercisephysiology4aedkatchmcardlekatch-220619181003-c34e0a40/85/Exercise-Physiology-233-320.jpg)
![216 • SECTION III Energy Transfer
BOX 7.3
How to Calibrate an Instrument
Most measuring instruments exhibit two types of errors,
variable error and constant error.
Variable errors are unpredictable and produce incon-
sistent scores (i.e., scores fluctuate randomly in both pos
itive and negative directions). Variable errors are caused
by (1) instrument reading errors, (2) effects of uncon-
trolled environmental influences (temperature or baro
metric pressure), and (3) variable functioning inherent to
the instrument’s operation.
Constant errors include systematic errors that either
add or subtract a consistent amount from the resulting
score. Many scientific instruments exhibit a consistent drif
of the zero so that it always reads consistently several units
higher (or lower) than an established, criterion value.
CALCULATING ERRORS
Suppose you want to calibrate a new ventilation meter
(NM) that can record expired air volumes (V E) in
Lmin1
during rest and up to maximum ventilation
(e.g., from 12 to 120 Lmin1
). Calculating constant and
variable errors involves comparing volumes obtained
using the NM versus volumes obtained using a criterion
device (instrument known to yield correct values). In this
example, a Tissot gasometer ( TG) (see Fig. 1) serves as
the criterion device for assessing gas volume.
To calibrate the NM, a subject breathes in ambient air
through a two-way respiratory value, and the expired air
passes into the NM and then into the TG, connected in
series with low-resistance corrugated tubing.
Minute ventilation volumes are measured for 8 min-
utes under the following conditions: rest and light, mod-
erate, and intense exercise. Table 1 presents the V
.
E
(Lmin1
) for NM and TG and the difference between
the two during the light exercise condition.
Constant Error
The mean absolute difference between the two methods
(5.13 Lmin1
; last column, Table 1) represents the
Figure 1 Tissot gasometer (water-filled and weight-balance
spirometer) capable of measuring up to 125 L of gas. The
contents of a meteorologic balloon containing expired air are
being transferred to the gasometer for precise measurement.
constant error (i.e., the N M, on average, consistently
records 5.13 Lmin1
higher than the criterion TG). The
constant error can be subtracted from each NM record-
ing to more closely approximate TG values. The constant
error is sometimes referred to as acalibration factor.
Variable Error
The standard deviation of the differences (
1.38 Lmin1
;
last column, Table 1) represents the variable error of the
NM. Expressed as a percentage of the mean criterion gas
volume [(1.38 L min1
32.99 Lmin1
) 100], the
variable error represents4.2% of the actual gas volume.
Because the variable error represents a random inconsis-
tency in recording an accurate volume, it cannot be added
or subtracted to more closely approximate the “true” TG
volume; it will have to be determined whether this mag-
nitude of variable error for the NM is small enough to
warrant its use.
CLOSE UP
TISSOT (TG) VOLUME, NEW METER (NM) VOLUME, TG NM VOLUME,
MINUTE Lmin1
Lmin1
Lmin1
1 29.6 35.9 6.2
2 33.8 38.5 4.7
3 31.2 36.3 5.1
4 31.2 34.7 3.5
5 30.6 36.9 6.3
6 40.5 43.0 2.5
7 39.5 45.9 6.4
8 27.5 33.8 6.3
X
_
32.99 X
_
38.13 X
_
diff 5.13
SD 4.37 SD 3.95 SDdiff 1.38
Table 1 Ventilation Data for the New Meter (NM) and Criterion Tissot Gasometer (TG)
LWBK710-c07_203-236.qxd 9/16/10 6:01PM Page 216 LWBK710-Ind_685-698.qxd](https://image.slidesharecdn.com/essentialsofexercisephysiology4aedkatchmcardlekatch-220619181003-c34e0a40/85/Exercise-Physiology-234-320.jpg)


![220 • SECTION III Energy Transfer
PERCENTAGE KCAL GRAMS PER LITER O2
DERIVED FROM UPTAKE
CARBOHYDRATE FAT CARBOHYDRATE FAT
0.707 4.686 0.0 100.0 0.000 .496
.71 4.690 1.1 98.9 .012 .491
.72 4.702 4.8 95.2 .051 .476
.73 4.714 8.4 91.6 .900 .460
.74 4.727 12.0 88.0 .130 .444
.75 4.739 15.6 84.4 .170 .428
.76 4.750 19.2 80.8 .211 .412
.77 4.764 22.8 77.2 .250 .396
.78 4.776 26.3 73.7 .290 .380
.79 4.788 29.9 70.1 .330 .363
.80 4.801 33.4 66.6 .371 .347
.81 4.813 36.9 63.1 .413 .330
.82 4.825 40.3 59.7 .454 .313
.83 4.838 43.8 56.2 .496 .297
.84 4.850 47.2 52.8 .537 .280
.85 4.862 50.7 49.3 .579 .263
.86 4.875 54.1 45.9 .621 .247
.87 4.887 57.5 42.5 .663 .230
.88 4.887 60.8 39.2 .705 .213
.89 4.911 64.2 35.8 .749 .195
.90 4.924 67.5 32.5 .791 .178
.91 4.936 70.8 29.2 .834 .160
.92 4.948 74.1 25.9 .877 .143
.93 4.961 77.4 22.6 .921 .125
.94 4.973 80.7 19.3 .964 .108
.95 4.985 84.0 16.0 1.008 .090
.96 4.998 87.2 12.8 1.052 .072
.97 5.010 90.4 9.6 1.097 .054
.98 5.022 93.6 6.4 1.142 .036
.99 5.035 96.8 3.2 1.186 .018
1.00 5.047 100.0 0 1.231 .000
From Zuntz, N.: Ueber die Bedeutung der verschiedenen Nährstoffe als Erzeuger der Muskelkraft. [Arch. Gesamta Physiol., Bonn, Ger.: LXXXIII, 557–571,
1901], Pflügers Arch. Physiol. 83:557, 1901.
Table 7.1
Thermal Equivalents of Oxygen for the Non-Protein Respiratory Quotient, Including
Percentage kCal and Grams Derived From Carbohydrate and Fat
NON-
PROTEIN KCAL PER LITER
RQ O2 UPTAKE
nutrient metabolism. This assumption is reasonably valid
for rest and during steady-rate mild to moderate aerobic
exercise conditions without lactate accumulation. Vari-
ous factors can alter the exchange of oxygen and carbon
dioxide in the lungs so that the gas exchange ratio no
longer reflects only the substrate mixture in cellular
energy metabolism. For example, carbon dioxide elimi-
nation increases during hyperventilation because breath-
ing increases to disproportionately high levels compared
with the intrinsic metabolic demands. By overbreathing,
the normal level of CO 2 in the blood decreases because
the gas “blows off” in expired air. A corresponding
increase in oxygen uptake does not accompany additional
CO2 elimination. Consequently, the exchange ratio often
exceeds 1.00. Respiratory physiologists refer to the ratio of
carbon dioxide produced to oxygen consumed under such
conditions as the respiratory exchange ratio, R or RER.
This ratio computes in exactly the same manner as RQ.
An increase in the respiratory exchange ratio above 1.00
cannot be attributed to foodstuff oxidation.
Exhaustive exercise presents another situation in which
R usually increases above 1.00. To maintain proper
acid–base balance, sodium bicarbonate in the blood buffers
or “neutralizes” the lactate generated during anaerobic
metabolism in the following reaction:
HLa NaHCO3 S NaLa H2CO3 S
H2O CO2 S Lungs
Lactate buffering produces the weaker carbonic acid. In the
pulmonary capillaries, carbonic acid breaks down to its
components carbon dioxide and water to allow carbon
dioxide to readily exit through the lungs. The R increases
above 1.00 because buffering adds “extra” CO2 to expired
air above the quantity normally released during cellular
energy metabolism.
Relatively low R values occur after exhaustive exercise
when carbon dioxide remains in body fluids to replenis
bicarbonate that buffered the accumulating lactate. This
action reduces expired carbon dioxide without affecting
oxygen uptake; this decreases R to below 0.70.
LWBK710-c07_203-236.qxd 9/16/10 6:01PM Page 220 LWBK710-Ind_685-698.qxd](https://image.slidesharecdn.com/essentialsofexercisephysiology4aedkatchmcardlekatch-220619181003-c34e0a40/85/Exercise-Physiology-238-320.jpg)


![Chapter 7 Measuring and Evaluating Human Energy-Generating Capacities During Exercise • 231
BOX 7.7
The Weir Method of Calculating Energy Expenditure
In 1949, J.B. Weir, a Scottish physician and physiologist
from Glasgow University, presented a simple method to
estimate caloric expenditure (kCal. min1
) from measures
of pulmonary ventilation and expired oxygen percentage,
accurate to within 1% of the traditional RQ method.
BASIC EQUATION
Weir showed the following formula could calculate
energy expenditure if total energy production from pro-
tein breakdown equaled 12.5% (a reasonable percentage
for most people):
kCalmin1
V
.
E(STPD) (1.044 0.0499 %O2E)
where V
.
E(STPD) represents expired minute ventilation
(Lmin1
)corrected to STPD conditions, and %O
2E repre-
sents expired oxygen percentage. The value in parentheses
(1.044 0.0499 %O2E) represents the “Weir factor.”
The table displays Weir factors for different %O 2E values.
To use the table, locate the %O2E and corresponding Weir
factor. Compute energy expenditure in kCal min1
by
multiplying the Weir factor by V
.
E(STPD).
Example
A person runs on a treadmill and V
.
E(STPD) 50 Lmin1
and %O2E 16.0%. Compute energy expenditure by the
Weir method as follows:
kCalmin1
V
.
E(STPD) (1.044 [0.0499 %O2E])
50 (1.044 [0.0499 16.0])
50 0.2456
12.3
Weir also derived the following equation to calculate
kCalmin1
from RQ and V
.
O2 in Lmin1
:
kCalmin1
([1.1 RQ] 3.9) V
.
O2
CLOSE UP
WEIR %O2E FACTOR WEIR %O2E FACTOR
14.50 0.3205 17.00 0.1957
14.60 0.3155 17.10 0.1907
14.70 0.3105 17.20 0.1857
14.80 0.3055 17.30 0.1807
14.90 0.3005 17.40 0.1757
15.00 0.2955 17.50 0.1707
15.10 0.2905 17.60 0.1658
15.20 0.2855 17.70 0.1608
15.30 0.2805 17.80 0.1558
15.40 0.2755 17.90 0.1508
15.50 0.2705 18.00 0.1468
15.60 0.2656 18.10 0.1408
15.70 0.2606 18.20 0.1368
15.80 0.2556 18.30 0.1308
15.90 0.2506 18.40 0.1268
16.00 0.2456 18.50 0.1208
16.10 0.2406 18.60 0.1168
16.20 0.2366 18.70 0.1109
16.30 0.2306 18.80 0.1068
16.40 0.2256 18.90 0.1009
16.50 0.2206 19.00 0.0969
16.60 0.2157 19.10 0.0909
16.70 0.2107 19.20 0.0868
16.80 0.2057 19.30 0.0809
16.90 0.2007 19.40 0.0769
If %O2E (expired oxygen percentage) does not appear in the table, compute individual Weir factors as
1.044 0.0499 %O2E.
From Weir, J.B.: New methods for calculating metabolic rates with special reference to protein
metabolism. J. Physiol., 109:1, 1949.
Weir Factors
LWBK710-c07_203-236.qxd 9/16/10 6:01PM Page 231 LWBK710-Ind_685-698.qxd](https://image.slidesharecdn.com/essentialsofexercisephysiology4aedkatchmcardlekatch-220619181003-c34e0a40/85/Exercise-Physiology-249-320.jpg)


![Example BSA computations for a man 70 inches tall
(1.778 m) who weighs 165.3 lb (75 kg):
BSA 0.20247 1.7780.725
750.425
0.20247 1.51775 6.2647
1.925 m2
For a 20-year-old man the estimated BMR equals
36.5 kCalm2
h1
. If his surface area were 1.925 m
2
as
in the calculation above, the hourly energy expenditure
would equal 70.3 kCal (36.5 1.925 m2
). On a 24-hour
basis, this amounts to an RDEE of 1686 kCal (70.3
24).
PREDICTING RESTING ENERGY
EXPENDITURE
Body mass (BM), stature (S in centimeters), and age (A
in years) can successfully predict RDEE with sufficient
accuracy using the following equations.
Equations for women and men are:
Women: RDEE 655 (9.6 BM) (1.85 S)
(4.7 A)
Men: RDEE 66.0 (13.7 BM) (5.0 S)
(6.8 A)
Examples
Woman
Man
FACTORS AFFECTING TOTAL DAILY
ENERGY EXPENDITURE
The three most important factors that affect total daily
energy expenditure (TDEE) include physical activity,
dietary-induced thermogenesis, and climate. Pregnancy
also affects TDEE through its impact on the energy cost of
many forms of physical activity.
Physical Activity
Physical activity profoundly affects human energy
expenditure. World-class athletes nearly double their
BM 80 kg; S 189.0 cm; A 30 y.
RDEE 66.0 (13.7 80) (5.0 189.0)
(6.8 30.0)
66.0 1096 945 204
1903 kCal
BM 62.7 kg; S 172.5 cm; A 22.4 y.
RDEE 655 (9.6 62.7)
(1.85 172.5) (4.7 22.4)
655 601.92 319.13 105.28
1471 kCal
daily caloric outputs with 3 or 4 hours of physical train-
ing. Most people can sustain metabolic rates that average
10 times the resting value during “big muscle” exercises
such as fast walking, running, cycling, and swimming.
Physical activity generally accounts for between 15% and
30% of TDEE.
Dietary-Induced Thermogenesis
Consuming food increases energy metabolism from the
energy-requiring processes of digesting, absorbing, and
assimilating nutrients. Dietary-induced thermogenesis
(DIT; also termed thermic effect of food [TEF]) typically
reaches maximum 1 hour after feeding, depending on
food quantity and types of food consumed. The magni-
tude of DIT ranges between 10% and 35% of the ingested
food energy. A meal of pure protein, for example, pro-
duces a thermic effect often equaling 25% of the meal’s
total energy content.
Advertisements routinely tout the high thermic effect
of protein consumption to promote a high-protein diet for
weight loss. Advocates maintain that fewer calories ulti-
mately become available to the body compared with a
lipid- or carbohydrate-rich meal of similar caloric value.
This point has some validity, but other factors must be
considered in formulating a prudent weight loss program.
These include the potentially harmful strain on kidney
and liver function induced by excessive protein and the
cholesterol-stimulating effects of considerable saturated
fatty acids contained in higher protein foods. Well-bal-
anced nutrition requires a blend of macronutrients with
appropriate quantities of vitamins and minerals. When
combining exercise with food restriction for weight loss,
carbohydrate not protein intake provides energy for exer-
cise and conserves lean tissue invariably lost through
dieting.
Individuals with poor control over their body weight
often display a depressed thermic response to eating, an
effect most likely related to genetic predisposition. This
connection contributes to considerable body fat accumu-
lation over many years. If a person’s lifestyle includes regu-
lar moderate physical activity, then the thermogenic effect
represents only a small percentage of TDEE. Also, exercis-
ing after eating further stimulates the normal thermic
response to food consumption. This supports the wisdom
of “going for a brisk walk” after a meal.
Climate
Environmental factors influence the resting metabolic rate
The resting metabolism of people living in tropical cli-
mates, for example, averages 5% to 20% higher than coun-
terparts in more temperate regions. Exercise performed in
hot weather also imposes a small 5% elevation in metabolic
load that translates to correspondingly higher oxygen
uptake compared with the same work performed in a ther-
moneutral environment. Three factors directly produce an
increased thermogenic effect:
240 • SECTION III Energy Transfer
LWBK710-c08_237-262.qxd 9/16/10 6:03PM Page 240 LWBK710-Ind_685-698.qxd](https://image.slidesharecdn.com/essentialsofexercisephysiology4aedkatchmcardlekatch-220619181003-c34e0a40/85/Exercise-Physiology-258-320.jpg)


![WALKING ECONOMY
For most individuals, the most common form of exercise,
walking, represents the major type of physical activity that
falls outside the realm of sedentary living. Figure 8.6 dis-
plays the curvilinear relationship between energy expendi-
ture versus walking at slow and fast speeds. A linear rela-
tionship exists between walking speeds of 3.0 and
5.0 kmh1
(1.9–3.1 mph) and oxygen uptake; at faster
speeds, walking becomes less economical, so the relation-
ship curves upward to indicate a disproportionate increase
in energy cost related to walking speed. In general, the
crossover velocity (note intersection of two straight lines)
appears to be about 6.5 km h1
(4.0 mph) at which run-
ning becomes more economical than walking.
Competition Walking
The energy expenditure of Olympic-caliber walkers has
been studied at various speeds while walking and running
on a treadmill. Their competitive walking speeds average a
remarkable 13.0 km h1
(11.5–14.8 km h1
or 7.1–
9.2 mph) over distances ranging from 1.6 to 50 km. (The
current world record [as of January 2010] 20-km speed
walk is 1:16:43 for men [set June 2008] and 1:24:50
for women [set March 2001]. This equals a speed of
15.64 k mh1
[9.718 mph] for men, and 14.15 km h1
[8.79 mph] for men.)The cross-over velocity during which
running becomes more economical than walking for these
competitive race walkers occurs at about 8.0 km h1
(4.97 mph). The oxygen uptake of race walkers during
treadmill walking at competition speeds averages only
slightly lower than the highest oxygen uptake measured
250 • SECTION III Energy Transfer
34
10-km
race
time
(min)
44 46 48 50 52 54
33
31
32
VO2 (mL . kg–1 . min–1)
.
r = 0.82
Figure 8.5 Relationship between submaximum maximal oxy-
gen consumption (V
.
O2) at 16.1 kmh1
and 10-km race time in
elite male runners of comparable aerobic capacity.
Velocity (speed), mph
Energy
expenditure
(kCal
.
min
–1
)
km .hr–1
6
4 5
3
2
1 10
9
8
7
6
4 5
3
2
1
11
9
8
10
7
5
4
6
3
1
2
walking
r
u
n
n
i
n
g
walking
r
u
n
n
i
n
g
Figure 8.6 Energy expenditures while
walking on a level surface at different speeds.
The line represents a compilation of values
reported in the literature.
LWBK710-c08_237-262.qxd 9/16/10 6:04PM Page 250 LWBK710-Ind_685-698.qxd](https://image.slidesharecdn.com/essentialsofexercisephysiology4aedkatchmcardlekatch-220619181003-c34e0a40/85/Exercise-Physiology-268-320.jpg)

![252 • SECTION III Energy Transfer
BOX 8.1
Predicting Energy Expenditure During Treadmill
Walking and Running
An almost linear relationship exists between oxygen con-
sumption (energy expenditure) and walking speeds
between 3.0 and 5.0 kmh1
(1.9 and 3.1 mph) and run-
ning at speeds faster than 8.0 km h1
(5–10 mph; see
Fig. 8.6). Adding the resting oxygen consumption to the
oxygen requirements of the horizontal and vertical com-
ponents of the walk or run makes it possible to estimate
total (gross) exercise oxygen consumption (V
.
O2) and
energy expenditure.
BASIC EQUATION
V
.
O2 (mLkg1
min1
) Resting component (1 MET
[3.5 mL O2kg1
min1
]) Horizontal component
(speed, [mmin1
] Oxygen consumption of hori-
zontal movement) Vertical component (percentage
grade speed [mmin1
] oxygen consumption of
vertical movement)
To convert mph to mmin1
, multiply by 26.82; to convert
mmin1
to mph, multiply by 0.03728.
Walking
Oxygen consumption of the horizontal component of move-
ment equals 0.1 mLkg1
min1
and 1.8 mLkg1
min1
for the vertical component.
Running
Oxygen consumption of the horizontal component of move-
ment equals 0.2 mLkg1
min1
and 0.9 mLkg1
min1
for the vertical component.
PREDICTING ENERGY EXPENDITURE OF
TREADMILL WALKING
A 55-kg person walks on a treadmill at 2.8 mph (2.8
26.82 75 mmin1
) up a 4% grade. Calculate (1) V
.
O2
(mLkg1
min1
), (2) METs, and (3) energy expendi-
ture (kCalmin1
). Note: express % grade as a decimal
value (i.e., 4% grade 0.04).
Solution
1. V
.
O2 (mLkg1
min1
) Resting component
Horizontal component Vertical component
2. METs V
.
O2 (mLkg1
min1
)
3.5 mLkg1
min1
16.4 3.5
4.7
3. kCalmin1
V
.
O2 (mLkg1
min1
)
Body mass (kg)
5.05 kCalLO2
1
16.4 mLkg1
min1
55 kg 5.05 kCalL1
0.902 Lmin1
5.05 kCalL1
4.6
PREDICTING ENERGY EXPENDITURE OF
TREADMILL RUNNING
Problem
A 55-kg person runs on a treadmill at 5.4 mph (5.4
126.82 145 mmin1
) up a 6% grade. Calculate (1)
V
.
O2 in mL kg1
min1
, (2) METs, and (3) energy
expenditure (kCalmin1
).
Solution
1. V
.
O2 (mLkg1
min1
) Resting component
Horizontal component Vertical component
2. METs V
.
O2 (mLkg1
min1
)
3.5 mLkg1
min1
40.33 3.5
11.5
3. kCalmin1
V
.
O2 (mLkg1
min1
)
Body mass (kg)
5.05 kCalLO2
1
40.33 mLkg1
min1
55 kg
5.05 kCalL1
2.22 Lmin1
5.05 kCalL1
11.2
V
.
O2 Resting V
.
O2 (mLkg1
min1
)
[speed (mmin1
)
0.2 mLkg1
min1
]
[% grade speed (mmin1
)
0.9 mLkg1
min1
]
3.5 (145 0.2) (0.06 145 0.9)
3.5 29.0 7.83
40.33 mLkg1
min1
V
.
O2 Resting V
.
O2 (mLkg1
min1
)
[speed (mmin1
)
0.1 mLkg1
min1
]
[% grade speed (mmin1
)
1.8 mLkg1
min1
]
3.5 (75 0.1)
(0.04 75 1.8)
3.5 7.5 5.4
16.4 mLkg1
min1
CLOSE UP
LWBK710-c08_237-262.qxd 9/16/10 6:04PM Page 252 LWBK710-Ind_685-698.qxd](https://image.slidesharecdn.com/essentialsofexercisephysiology4aedkatchmcardlekatch-220619181003-c34e0a40/85/Exercise-Physiology-270-320.jpg)


![lungs. A distance of about 0.3 m (1 ft) separates ambient
air just outside the nose and mouth from the blood flow
ing through the lungs. Air entering the nose and mouth
flows into the conductive portion of the ventilatory sys
tem, where it adjusts to body temperature and is filtere
and almost completely humidified as it passes throug
the trachea. The trachea, a short 1-inch-diameter tube
that extends from the larynx, divides into two tubes of
smaller diameter calledbronchi. The bronchi serve as pri-
mary conduits within the right and left lungs. They fur-
ther subdivide into numerous bronchioles that conduct
inspired air through a narrow route until eventually mix-
ing with air in the alveoli, the terminal branches of the
respiratory tract.
Lungs
The lungs provide the surface between blood and the
external environment. Lung volume varies between 4 and
6 L (amount of air in a basketball) and provides an excep-
tionally large moist surface. The lungs of an average-sized
person weigh about 1 kg, yet if spread out, they would
cover a surface of 60 to 80 m2
, about 35 times the external
surface of the person, and almost half the size of a tennis
court or an entire badminton court. This represents a con-
siderable interface for aeration of blood because during any
1 second of maximal exercise, no more than 1 pint of blood
266 • SECTION IV The Physiologic Support Systems
Part 1
If oxygen supply depended only on diffusion through skin,
it would be impossible to support the basal energy require-
ment, let alone the 4- to6-L oxygen uptake each minute to
sustain a world-class 5 minuteper mile marathonpace. The
remarkably effective ventilatory system meets the body’s
needs to maintain efficient gas exchange. This system
depicted in Figure 9.1, regulates the gaseous state of our
“external” environment for aerating fluids of the “internal
environment during rest and exercise. The major functions
of the ventilatory system include:
1. Supply oxygen required in metabolism
2. Eliminate carbon dioxide produced in metabolism
3. Regulate hydrogen ion concentration [H
] to main-
tain acid–base balance
ANATOMY OF VENTILATION
The term pulmonary ventilation describes how ambient
atmospheric air moves into and exchanges with air in the
B
A
Nasal
passage
Pulmonary vein
(oxygenated
blood to heart)
Deoxygenated blood Oxygenated blood
Pulmonary
venule
Pulmonary artery
(deoxygenated
blood from heart)
Oral cavity
Pharynx
Larynx
Cartilage
Bronchi
Bronchioles
Plural space
Diaphragm
lung
Bronchus
Bronchiole
Pulmonary
arteriole
Alveoli
Ribs
Capillaries
Capillary
Alveolus
Alveolar
membane
CO2
O2
Figure 9.1 A. Major pulmonary structures within the thoracic cavity.B. Respiratory passages, alveoli, and gas exchange function in
an alveolus.
Pulmonary Structure
and Function
LWBK710-c09_263-300.qxd 9/16/10 7:11PM Page 266 LWBK710-Ind_685-698.qxd](https://image.slidesharecdn.com/essentialsofexercisephysiology4aedkatchmcardlekatch-220619181003-c34e0a40/85/Exercise-Physiology-284-320.jpg)


![usually increases from 70% of minute ventilation at rest to
more than 85% of the total ventilation in exercise. This
increase occurs because a greater percentage of incoming TV
enters the alveoli with deeper breathing.
Figure 9.6 shows increasing TV during in exercise
results largely from encroachment on IRV, with an accom-
panying but smaller decrease in end-expiratory level. As
exercise intensity increases, TV plateaus at about 60% of
vital capacity; further increases in minute ventilation result
from increases in breathing rate. These ventilatory adjust-
ments occur unconsciously; each individual develops a
“style” of breathing by blending the breathing rate and TV
so alveolar ventilation matches alveolar perfusion. Con-
scious attempts to modify breathing during running and other
general physical activities do not benefit exercise performance
In most instances, conscious manipulation of breathing
detracts from the exquisitely regulated ventilatory adjust-
ments to exercise. During rest and exercise each individual
should breathe in the manner that seems “most natural.”
Most individuals who perform rhythmical walking, run-
ning, cycling, and rowing naturally synchronize breathing
frequency with limb movements. This breathing pattern,
termed entrainment, reduces the energy cost of the
activity.
DISRUPTIONS IN NORMAL
BREATHING PATTERNS
Breathing patterns during exercise generally progress in
an effective and highly economical manner, yet some
pulmonary responses negatively impact exercise per-
formance.
Dyspnea
Dyspnea refers to shortness of breath or subjective distress
in breathing. The sense of inability to breathe during exer-
cise, particularly in novice exercisers, usually accompanies
elevated arterial carbon dioxide and [H
]. Both chemicals
excite the inspiratory center to increase breathing rate and
depth. Failure to adequately regulate arterial carbon diox-
ide and [H
] most likely relates to low aerobic fitness level
and a poorly conditioned ventilatory musculature. The
strong neural drive to breathe during exercise causes poorly
conditioned respiratory muscles to fatigue, disrupting nor-
mal plasma levels of carbon dioxide and [H
]. This acceler-
ates the pattern of shallow, ineffective breathing, and the
individual senses an inability to breathe sufficient air
Hyperventilation
Hyperventilation refers to an increase in pulmonary venti-
lation that exceeds the oxygen needs of metabolism. This
“overbreathing” quickly lowers normal alveolar carbon
dioxide concentration, which causes excess carbon diox-
ide to leave body fluids via the expired air. An accompany
ing decrease in [H
] increases plasma pH. Several seconds
of hyperventilation generally produces lightheadedness;
prolonged hyperventilation can lead to unconsciousness
from excessive carbon dioxide unloading from the blood
(see page 288).
274 • SECTION IV The Physiologic Support Systems
6
5
4
3
2
1
0
90
80
70
60
50
40
30
20
10
Tidal volume
Inspiratory
reserve
volume
Expiratory reserve volume
Residual
volume
Functional
residual
capacity
10 20 30 40 50 60
Volume,
liters
Minute volume, liters
Percent
of
vital
capacity
Total
lung
capacity
Figure 9.6 Tidal volume and subdivisions of pulmonary air during rest and exercise.
LWBK710-c09_263-300.qxd 9/16/10 7:11PM Page 274 LWBK710-Ind_685-698.qxd](https://image.slidesharecdn.com/essentialsofexercisephysiology4aedkatchmcardlekatch-220619181003-c34e0a40/85/Exercise-Physiology-292-320.jpg)


![mercury in a manometer about 600 mm Hg (0.7904 760 mm Hg). For sea
level ambient air:
Chapter 9 The Pulmonary System and Exercise • 277
Questions Notes
List the ambient air percentages for
oxygen, carbon dioxide, and nitrogen are:
O2:
CO2:
N2:
Give the formula for computing partial
pressure.
What determines gas concentration?
List the PO2 in ambient air at sea level.
List alveolar’s air concentration for oxygen
and carbon dioxide at rest:
O2:
CO2:
PARTIAL
PRESSURE VOLUME OF
GAS PERCENTAGE (at 760 mm Hg) GAS (mLL1
)
Oxygen 20.93 159 mm Hg 209.3
Carbon dioxide 0.03 0.2 mm Hg 0.4
Nitrogen 79.04a
600 mm Hg 790.3
a
Includes 0.93% argon and other trace rare gases.
Table 9.2
Percentages, Partial Pressures, and Volumes of Gases
in 1 L of Dry Ambient Air at Sea Level
PO2 159 mm Hg; PCO2 0.2 mm Hg; and PN2 600 mm Hg
Tracheal Air
Air entering the nose and mouth passes down the respiratory tract; it com-
pletely saturates with water vapor, which slightly dilutes the inspired air mix-
ture. At body temperature, the pressure of water molecules in humidified ai
equals 47 mm Hg; this leaves 713 mm Hg (760 mm Hg 47 mm Hg) as the
total pressure exerted by the inspired dry air molecules at sea level. This
decreases the effective PO2 in tracheal air by about 10 mm Hg from its dry ambi-
ent value of 159 mm Hg to 149 mm Hg (0.2093
[760 mm Hg 47 mm Hg]).
Humidification has little effect on inspired CO2 because of carbon dioxide’s
near negligible concentration in inspired air.
Alveolar Air
Alveolar air composition differs considerably from the incoming breath of ambi-
ent air because carbon dioxide continually enters the alveoli from the blood and
oxygen leaves the lungs for transport throughout the body.Table 9.3 shows that
moist alveolar air contains approximately 14.5% oxygen, 5.5% carbon dioxide,
and 80.0% nitrogen.
After subtracting water vapor pressure in moist alveolar gas, the average alve-
olar PO2 equals 103 mm Hg (0.145 [760 mm Hg 47 mm Hg]), and P CO2
equals 39 mm Hg (0.055 [760 mm Hg 47 mm Hg]). These values represent
the average pressures exerted by oxygen and carbon dioxide molecules against
the alveolar side of the respiratory membrane. They do not exist as physiologic
constants but vary slightly with the phase of the ventilatory cycle and adequacy
of ventilation in different lung segments.
PARTIAL
PRESSURE VOLUME OF
GAS PERCENTAGE (at 760 47 mm Hg) GAS (mLL1
)
Oxygen 14.5 103 mm Hg 145
Carbon dioxide 5.5 39 mm Hg 55
Nitrogen 80.00 571 mm Hg 800
Water vapor 47 mm Hg
Table 9.3
Percentages, Partial Pressures, and Volumes of Gases
in 1 L of Moist Alveolar Air at Sea Level (37°C)
LWBK710-c09_263-300.qxd 9/16/10 7:11PM Page 277 LWBK710-Ind_685-698.qxd](https://image.slidesharecdn.com/essentialsofexercisephysiology4aedkatchmcardlekatch-220619181003-c34e0a40/85/Exercise-Physiology-295-320.jpg)


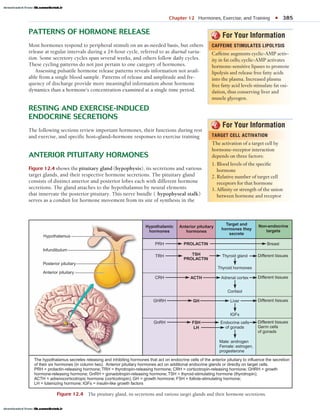


![physiological effects of exercises[1].pptx](https://cdn.slidesharecdn.com/ss_thumbnails/physiologicaleffectsofexercises1-241017154802-b190d167-thumbnail.jpg?width=640&height=640&fit=bounds)


