Exadata X3 in action: Measuring Smart Scan efficiency with AWR
The document discusses the efficiency of Exadata X3's smart scan functionality by measuring its performance on a large data warehouse ETL workload. It highlights significant improvements in processing time and resource management, where the I/O bottleneck is reduced, allowing for better CPU utilization. It also explains various statistics related to timed events and system performance that demonstrate how Exadata features enhance data processing capabilities.
Exadata X3 in action: Measuring Smart Scan efficiency with AWR
1.
Tips&ceehinqstu 31
ExadataX3 in action:
Measuring Smart Scan efficiency
with AWR
SOUG Newsletter 2/2013
Exadata comes with new
statistics and wait events that can
be used to measure the efficiency
of its main features (Smart Scan
offloading, Storage Indexes,
Hybrid Columnar Compression
and Smart Flash Cache).
Trivadis has tested the new
Exadata X3 on a real-life workload
for a customer: a large data-warehouse
loading, reading a few
terabytes of data in order to build
the datawarehouse during the
nightly ETL.
The workload was already well
tuned on the current production
system, using parallel query with
good efficiency, but has reached
the limit of scalability for the
current architecture.
We have tested the same
workload on our Exadata X3 1/8
rack installed in the customer’s
datacenter with very good results:
better performance (1:4 ratio in
the job duration) and several new
ways of improvement and scalabi-lity.
The goal of this article is not to
compare Exadata with any other
platforms, but rather to help
understand the few basic statis-tics
that we must know in order to
evaluate if Exadata is a good
solution for a specific workload,
and how to measure that the
Exadata features are well used.
We will cover those few statis-tics
from the ‘Timed events’ and
‘System Statistics’ sections of the
AWR report.
Timed events
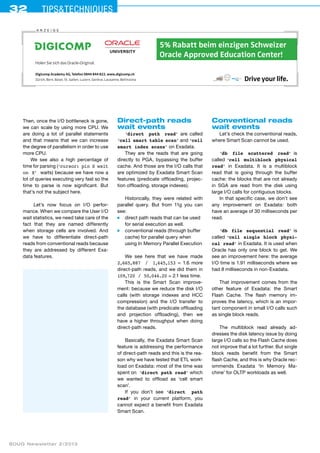
I always start to read AWR reports from the DB time and its detail in the Top
Timed Events.
Here are the Top Time events from the same workload running in the non-Exadata
platform:
Event Waits Time(s) Avg wait (ms) % DB time Wait Class
direct path read 1,645,153 109,720 67 37.65 User I/O
DB CPU 47,624 16.34
db file scattered read 782,981 23,554 30 8.08 User I/O
enq: CF - contention 55,220 15,057 273 5.17 Other
db file sequential read 1,480,907 12,149 8 4.17 User I/O
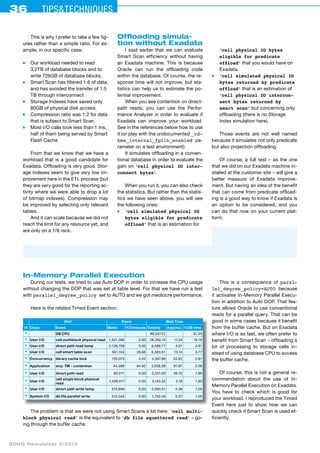
We are mainly I/O bound. Even if we get more CPU we cannot increase the
parallel degree because of the storage contention. We obviously need to do less
I/O and/or make them faster.
Because most of the I/O is ‘direct path read’ we can expect a good
improvement with Exadata Smart Scan features.
So from there we will show the AWR global report (we are on a 2 nodes RAC in
that Exadata X3 1/8 rack) for the same workload where we didn’t change anything
on the database design, except that we have compressed (QUERY LOW) most of
the tables that are bulk loaded and not updated.
The ‘Top Timed Events’ section from the AWR RAC report is showing us that
the workload is now mainly using CPU:
Wait Event Wait Time
I# Class Event Waits %Timeouts Total(s) Avg(ms) %DB time
* DB CPU 91,147.69 34.64
* User I/O cell smart table scan 2,665,887 18.85 50,046.20 18.77 19.02
* Concurrency cursor: pin S wait on X 111,404 0.00 21,878.34 196.39 8.31
* User I/O direct path read temp 2,257,940 0.00 20,780.21 9.20 7.90
* Scheduler resmgr:cpu quantum 11,117,772 0.00 19,120.52 1.72 7.27
* User I/O cell multiblock physical read 586,794 0.00 17,340.79 29.55 6.59
* User I/O direct path write temp 578,395 0.00 8,610.14 14.89 3.27
* User I/O
cell single block
physical read 2,260,650 0.00 4,309.96 1.91 1.64
* Concurrency library cache lock 97,426 5.30 3,272.35 33.59 1.24
* Cluster gc buffer busy release 594,719 0.00 2,435.78 4.10 0.93
The ‘resmgr:cpu quantum’ is there because we had an active resource man-ager
plan at that time. The report covers 150.52 minutes of elapsed time, where we
have on average (91,147.69 + 19,120.52 ) / ( 60 * 150.52 ) = 12.2 sessions on
CPU or waiting for CPU. That can be improved further as we have 2 nodes, with 8
hyper-threaded cores each, on that Eighth Rack Exadata.
This is the major difference that we got from Exadata: it addresses the I/O
bottleneck so that the main responsible for the response time becomes the CPU.
Franck Pachot, Trivadis AG
2.
32 Tips&techniques
Anzei ge
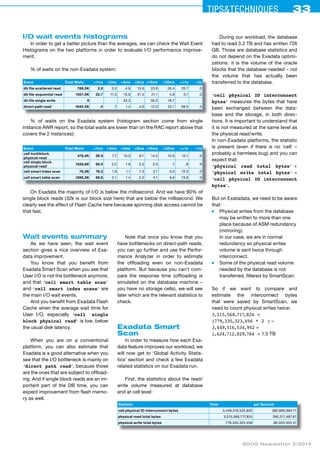
Then, once the I/O bottleneck is gone,
we can scale by using more CPU. We
are doing a lot of parallel statements
and that means that we can increase
the degree of parallelism in order to use
more CPU.
We see also a high percentage of
time for parsing (‘cursor: pin S wait
on X’ waits) because we have now a
lot of queries executing very fast so the
time to parse is now significant. But
that’s not the subject here.
Let’s now focus on I/O perfor-mance.
When we compare the User I/O
wait statistics, we need take care of the
fact that they are named differently
when storage cells are involved. And
we have to differentiate direct-path
reads from conventional reads because
they are addressed by different Exa-data
features.
SOUG Newsletter 2/2013
Drive your life.
Holen Sie sich das Oracle-Original.
für Profis
5% Rabatt beim einzigen Schweizer
Oracle Approved Education Center!
Digicomp Academy AG, Telefon 0844 844 822, www.digicomp.ch
Zürich, Bern, Basel, St. Gallen, Luzern, Genève, Lausanne, Bellinzona
2013_SOUG_180X35_oracle_4F.indd 1 14.03.2013 11:57:35
Direct-path reads
wait events
‘direct path read’ are called
‘cell smart table scan’ and ‘cell
smart index scans’ on Exadata.
They are the reads that are going
directly to PGA, bypassing the buffer
cache. And those are the I/O calls that
are optimized by Exadata Smart Scan
features (predicate offloading, projec-tion
offloading, storage indexes).
Historically, they were related with
parallel query. But from 11g you can
see:
■ direct path reads that can be used
for serial execution as well.
■ conventional reads (through buffer
cache) for parallel query when
using In Memory Parallel Execution
We see here that we have made
2,665,887 / 1,645,153 = 1.6 more
direct-path reads, and we did them in
109,720 / 50,046.20 = 2.1 less time.
This is the Smart Scan improve-ment:
because we reduce the disk I/O
calls (with storage indexes and HCC
compression) and the I/O transfer to
the database (with predicate offloading
and projection offloading), then we
have a higher throughput when doing
direct-path reads.
Basically, the Exadata Smart Scan
feature is addressing the performance
of direct-path reads and this is the rea-son
why we have tested that ETL work-load
on Exadata: most of the time was
spent on ‘direct path read’ which
we wanted to offload as ‘cell smart
scan’.
If you don’t see ‘direct path
read’ in your current platform, you
cannot expect a benefit from Exadata
Smart Scan.
Conventional reads
wait events
Let’s check the conventional reads,
where Smart Scan cannot be used.
‘db file scattered read’ is
called ‘cell multiblock physical
read’ in Exadata. It is a multiblock
read that is going through the buffer
cache: the blocks that are not already
in SGA are read from the disk using
large I/O calls for contiguous blocks.
In that specific case, we don’t see
any improvement on Exadata: both
have an average of 30 milliseconds per
read.
‘db file sequential read’ is
called ‘cell single block physi-cal
read’ in Exadata. It is used when
Oracle has only one block to get. We
see an improvement here: the average
I/O time is 1.91 milliseconds where we
had 8 milliseconds in non-Exadata.
That improvement comes from the
other feature of Exadata: the Smart
Flash Cache. The flash memory im-proves
the latency, which is an impor-tant
component in small I/O calls such
as single block reads.
The multiblock read already ad-dresses
the disk latency issue by doing
large I/O calls so the Flash Cache does
not improve that a lot further. But single
block reads benefit from the Smart
flash Cache, and this is why Oracle rec-ommends
Exadata ‘In Memory Ma-chine’
for OLTP workloads as well.
3.
Tips&ceehinqstu 33
Duringour workload, the database
had to read 3.2 TB and has written 726
GB. Those are database statistics and
do not depend on the Exadata optimi-zations:
it is the volume of the oracle
blocks that the database needed – not
the volume that has actually been
transferred to the database.
‘cell physical IO interconnect
bytes’ measures the bytes that have
been exchanged between the data-base
and the storage, in both direc-tions.
It is important to understand that
it is not measured at the same level as
the physical read/write.
In non-Exadata platforms, the statistic
is present (even if there is no ‘cell’ –
probably a harmless bug) and you can
expect that:
‘physical read total bytes’ +
‘physical write total bytes’ =
‘cell physical IO interconnect
bytes’.
But on Exatadata, we need to be aware
that:
■ Physical writes from the database
may be written to more than one
place because of ASM redundancy
(mirroring).
In our case, we are in normal
redundancy so physical writes
volume is sent twice through
interconnect.
■ Some of the physical read volume
needed by the database is not
transferred, filtered by SmartScan.
So if we want to compare and
estimate the interconnect bytes
that were saved by SmartScan, we
need to count physical writes twice:
3,515,568,717,824 +
(779,330,323,456 * 2 ) –
3,449,516,534,952 =
1,624,712,829,784 = 1.5 TB
SOUG Newsletter 2/2013
I/O wait events histograms
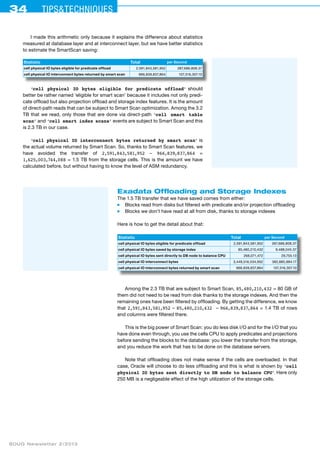
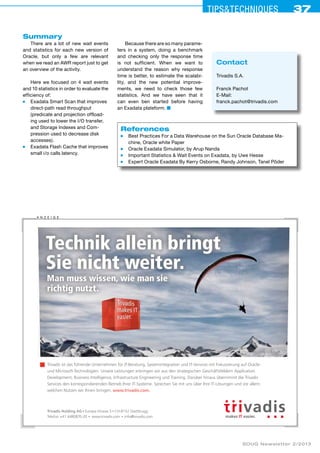
In order to get a better picture than the averages, we can check the Wait Event
Histograms on the two platforms in order to evaluate I/O performance improve-ment.
% of waits on the non-Exadata system:
Event Total Waits <1ms <2ms <4ms <8ms <16ms <32ms <=1s >1s
db file scattered read 788.5K 2.6 3.2 4.8 13.6 23.6 26.4 25.7 .0
db file sequential read 1501.5K 22.7 11.3 15.6 21.4 21.1 4.8 3.1 .0
db file single write 6 33.3 50.0 16.7
direct path read 1645.2K .4 .7 1.4 4.0 12.0 22.1 59.5 .0
% of waits on the Exadata system (histogram section come from single
instance AWR report, so the total waits are lower than on the RAC report above that
covers the 2 instances):
Event Total Waits <1ms <2ms <4ms <8ms <16ms <32ms <=1s >1s
cell multiblock
478,4K 38.9 physical read
7.7 10.0 6.1 14.3 10.9 12.1 .0
cell single block
physical read
1526,6K 90.0 2.5 1.8 2.2 2.0 .7 .8 .0
cell smart index scan 78,2K 76.3 1.9 1.1 1.3 2.1 5.0 12.3 .0
cell smart table scan 1288,3K 69.8 2.1 1.4 2.2 4.1 6.6 13.8 .0
On Exadata the majority of I/O is below the millisecond. And we have 90% of
single block reads (32k is our block size here) that are below the millisecond. We
clearly see the effect of Flash Cache here because spinning disk access cannot be
that fast.
Wait events summary
As we have seen, the wait event
section gives a nice overview of Exa-data
improvement.
You know that you benefit from
Exadata Smart Scan when you see that
User I/O is not the bottleneck anymore,
and that ‘cell smart table scan’
and ‘cell smart index scans’ are
the main I/O wait events.
And you benefit from Exadata Flash
Cache when the average wait time for
User I/O, especially ‘cell single
block physical read’ is low, below
the usual disk latency.
When you are on a conventional
platform, you can also estimate that
Exadata is a good alternative when you
see that the I/O bottleneck is mainly on
‘direct path read’, because those
are the ones that are subject to offload-ing.
And if single block reads are an im-portant
part of the DB time, you can
expect improvement from flash memo-ry
as well.
Note that once you know that you
have bottlenecks on direct-path reads,
you can go further and use the Perfor-mance
Analyzer in order to estimate
the offloading even on non-Exadata
platform. But because you can’t com-pare
the response time (offloading is
simulated on the database machine –
you have no storage cells), we will see
later which are the relevant statistics to
check.
Exadata Smart
Scan
In order to measure how each Exa-data
feature improves our workload, we
will now get to ‘Global Activity Statis-tics’
section and check a few Exadata
related statistics on our Exadata run.
First, the statistics about the read/
write volume measured at database
and at cell level:
Statistic Total per Second
cell physical IO interconnect bytes 3,449,516,534,952 382,885,884.17
physical read total bytes 3,515,568,717,824 390,217,487.81
physical write total bytes 779,330,323,456 86,503,303.51
4.
34 Tips&techniques
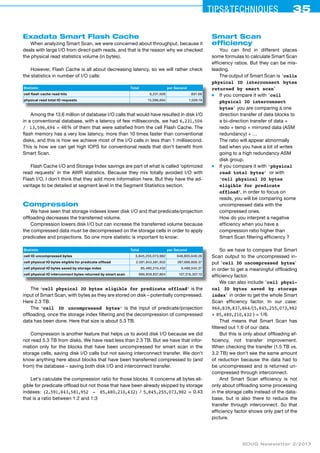
Imade this arithmetic only because it explains the difference about statistics
measured at database layer and at interconnect layer, but we have better statistics
to estimate the SmartScan saving:
Statistic Total per Second
cell physical IO bytes eligible for predicate offload 2,591,843,581,952 287,686,808.37
cell physical IO interconnect bytes returned by smart scan 966,839,837,864 107,316,307.10
‘cell physical IO bytes eligible for predicate offload’ should
better be rather named ‘eligible for smart scan’ because it includes not only predi-cate
offload but also projection offload and storage index features. It is the amount
of direct-path reads that can be subject to Smart Scan optimization. Among the 3.2
TB that we read, only those that are done via direct-path ‘cell smart table
scan’ and ‘cell smart index scans’ events are subject to Smart Scan and this
is 2.3 TB in our case.
‘cell physical IO interconnect bytes returned by smart scan’ is
the actual volume returned by Smart Scan. So, thanks to Smart Scan features, we
have avoided the transfer of 2,591,843,581,952 – 966,839,837,864 =
1,625,003,744,088 = 1.5 TB from the storage cells. This is the amount we have
calculated before, but without having to know the level of ASM redundancy.
SOUG Newsletter 2/2013
Exadata Offloading and Storage Indexes
The 1.5 TB transfer that we have saved comes from either:
■ Blocks read from disks but filtered with predicate and/or projection offloading
■ Blocks we don’t have read at all from disk, thanks to storage indexes
Here is how to get the detail about that:
Statistic Total per Second
cell physical IO bytes eligible for predicate offload 2,591,843,581,952 287,686,808.37
cell physical IO bytes saved by storage index 85,480,210,432 9,488,045.37
cell physical IO bytes sent directly to DB node to balance CPU 268,071,472 29,755.13
cell physical IO interconnect bytes 3,449,516,534,952 382,885,884.17
cell physical IO interconnect bytes returned by smart scan 966,839,837,864 107,316,307.10
Among the 2.3 TB that are subject to Smart Scan, 85,480,210,432 = 80 GB of
them did not need to be read from disk thanks to the storage indexes. And then the
remaining ones have been filtered by offloading. By getting the difference, we know
that 2,591,843,581,952 – 85,480,210,432 – 966,839,837,864 = 1.4 TB of rows
and columns were filtered there.
This is the big power of Smart Scan: you do less disk I/O and for the I/O that you
have done even through, you use the cells CPU to apply predicates and projections
before sending the blocks to the database: you lower the transfer from the storage,
and you reduce the work that has to be done on the database servers.
Note that offloading does not make sense if the cells are overloaded. In that
case, Oracle will choose to do less offloading and this is what is shown by ‘cell
physical IO bytes sent directly to DB node to balance CPU’. Here only
250 MB is a negligeable
effect of the high utilization of the storage cells.
5.
Tips&ceehinqstu 35
SOUGNewsletter 2/2013
Exadata Smart Flash Cache
When analyzing Smart Scan, we were concerned about throughput, because it
deals with large I/O from direct-path reads, and that is the reason why we checked
the physical read statistics volume (in bytes).
However, Flash Cache is all about decreasing latency, so we will rather check
the statistics in number of I/O calls:
Statistic Total per Second
cell flash cache read hits 6,231,506 691.68
physical read total IO requests 13,596,694 1,509.19
Among the 13.6 million of database I/O calls that would have resulted in disk I/O
in a conventional database, with a latency of few milliseconds, we had 6,231,506
/ 13,596,694 = 46% of them that were satisfied from the cell Flash Cache. The
flash memory has a very low latency, more than 10 times faster than conventional
disks, and this is how we achieve most of the I/O calls in less than 1 millisecond.
This is how we can get high IOPS for conventional reads that don’t benefit from
Smart Scan.
Flash Cache I/O and Storage Index savings are part of what is called ‘optimized
read requests’ in the AWR statistics. Because they mix totally avoided I/O with
Flash I/O, I don’t think that they add more information here. But they have the ad-vantage
to be detailed at segment level in the Segment Statistics section.
Compression
We have seen that storage indexes lower disk I/O and that predicate/projection
offloading decreases the transferred volume.
Compression lowers disk I/O but can increase the transferred volume because
the compressed data must be decompressed on the storage cells in order to apply
predicates and projections. So one more statistic is important to know:
Statistic Total per Second
cell IO uncompressed bytes 5,845,255,073,982 648,805,649.26
cell physical IO bytes eligible for predicate offload 2,591,843,581,952 287,686,808.37
cell physical IO bytes saved by storage index 85,480,210,432 9,488,045.37
cell physical IO interconnect bytes returned by smart scan 966,839,837,864 107,316,307.10
The ‘cell physical IO bytes eligible for predicate offload’ is the
input of Smart Scan, with bytes as they are stored on disk – potentially compressed.
Here 2.3 TB.
The ‘cell IO uncompressed bytes’ is the input of predicate/projection
offloading, once the storage index filtering and the decompression of compressed
data has been done. Here that size is about 5.3 TB.
Compression is another feature that helps us to avoid disk I/O because we did
not read 5.3 TB from disks. We have read less than 2.3 TB. But we have that infor-mation
only for the blocks that have been uncompressed for smart scan in the
storage cells, saving disk I/O calls but not saving interconnect transfer. We don't
know anything here about blocks that have been transferred compressed to (and
from) the database – saving both disk I/O and interconnect transfer.
Let's calculate the compression ratio for those blocks. It concerns all bytes eli-gible
for predicate offload but not those that have been already skipped by storage
indexes: (2,591,843,581,952 - 85,480,210,432) / 5,845,255,073,982 = 0.43
that is a ratio between 1:2 and 1:3
Smart Scan
efficiency
You can find in different places
some formulas to calculate Smart Scan
efficiency ratios. But they can be mis-leading.
The output of Smart Scan is 'cells
physical IO interconnect bytes
returned by smart scan'
■ If you compare it with 'cell
physical IO interconnect
bytes' you are comparing a one
direction transfer of data blocks to
a bi-direction transfer of data +
redo + temp + mirrored data (ASM
redundancy) + …
The ratio will appear abnormally
bad when you have a lot of writes
going to a high redundancy ASM
disk group.
■ If you compare it with ‘physical
read total bytes’ or with
‘cell physical IO bytes
eligible for predicate
offload’, in order to focus on
reads, you will be comparing some
uncompressed data with the
compressed ones.
How do you interpret a negative
efficiency when you have a
compression ratio higher than
Smart Scan filtering efficiency ?
So we have to compare that Smart
Scan output to the uncompressed in-put
'cell IO uncompressed bytes'
in order to get a meaningful offloading
efficiency factor.
We can also include 'cell physi-cal
IO bytes saved by storage
index' in order to get the whole Smart
Scan efficiency factor. In our case:
966,839,837,864 / ( 5,845,255,073,982
+ 85,480,210,432 ) = 1/6.
That means that Smart Scan has
filtered out 1:6 of our data.
But this is only about offloading ef-ficiency,
not transfer improvement.
When checking the transfer (1.5 TB vs.
3.2 TB) we don't see the same amount
of reduction because the data had to
be uncompressed and is returned un-compressed
through interconnect.
And Smart Scan efficiency is not
only about offloading some processing
in the storage cells instead of the data-base,
but is also there to reduce the
transfer through interconnect. So that
efficiency factor shows only part of the
picture.
6.
36 Tips&techniques
Thisis why I prefer to take a few fig-ures
rather than a simple ratio. For ex-ample,
in our specific case:
■ Our workload needed to read
3.2TB of database blocks and to
write 726GB of database blocks.
■ Smart Scan has filtered 1:6 of data,
and has avoided the transfer of 1.5
TB through interconnect
■ Storage Indexes have saved only
80GB of physical disk access.
■ Compression ratio was 1:2 for data
that is subject to Smart Scan
■ Most I/O calls took less than 1 ms,
half of them being served by Smart
Flash Cache
From that we know that we have a
workload that is a good candidate for
Exadata. Offloading is very good. Stor-age
Indexes seem to give very low im-provement
here in the ETL process (but
they are very good for the reporting ac-tivity
where we were able to drop a lot
of bitmap indexes). Compression may
be improved by selecting only relevant
tables.
And it can scale because we did not
reach the limit for any resource yet, and
are only on a 1/8 rack.
SOUG Newsletter 2/2013
Offloading simulation
without Exadata
I said earlier that we can evaluate
Smart Scan efficiency without having
an Exadata machine. This is because
Oracle can run the offloading code
within the database. Of course, the re-sponse
time will not improve, but sta-tistics
can help us to estimate the po-tential
improvement.
When you see contention on direct-path
reads, you can use the Perfor-mance
Analyzer in order to evaluate if
Exadata can improve your workload.
See in the references below how to use
it (or play with the undocumented _rd-bms_
internal_fplib_enabled pa-rameter
on a test environment).
It simulates offloading in a conven-tional
database in order to evaluate the
gain on ‘cell physical IO inter-connect
bytes’.
When you run it, you can also check
the statistics. But rather than the statis-tics
we have seen above, you will see
the following ones:
■ ‘cell simulated physical IO
bytes eligible for predicate
offload’ that is an estimation for
‘cell physical IO bytes
eligible for predicate
offload’ that you would have on
Exadata.
■ ‘cell simulated physical IO
bytes returned by predicate
offload’ that is an estimation of
‘cell physical IO intercon-nect
bytes returned by
smart scan’ but concerning only
offloading (there is no Storage
Index simulation here).
Those events are not well named
because it simulates not only predicate
but also projection offloading.
Of course, a full test – as the one
that we did on our Exadata machine in-stalled
at the customer site – will give a
better measure of Exadata improve-ment.
But having an idea of the benefit
that can come from predicate offload-ing
is a good way to know if Exadata is
an option to be considered, and you
can do that now on your current plat-form.
In-Memory Parallel Execution
During our tests, we tried to use Auto DOP in order to increase the CPU usage
without changing the DOP that was set at table level. For that we have run a test
with parallel_degree_policy set to AUTO and we got mediocre performance.
Here is the related Timed Event section:
Wait Event Wait Time
I# Class Event Waits %Timeouts Total(s) Avg(ms) %DB time
* DB CPU 89,547.51 51.23
* User I/O cell multiblock physical read 1,641,266 0.00 28,292.74 17.24 16.19
* User I/O direct path read temp 2,139,709 0.00 8,588.77 4.01 4.91
* User I/O cell smart table scan 501,153 28.68 6,583.01 13.14 3.77
* Concurrency library cache lock 135,073 4.05 4,567.96 33.82 2.61
* Application enq: TM - contention 44,388 84.92 3,638.28 81.97 2.08
* User I/O direct path read 65,011 0.00 3,231.00 49.70 1.85
* User I/O
cell single block physical
read 1,439,417 0.00 3,143.24 2.18 1.80
* User I/O direct path write temp 515,689 0.00 2,260.01 4.38 1.29
* System I/O db file parallel write 314,545 0.00 1,750.56 5.57 1.00
The problem is that we were not using Smart Scans a lot here: ‘cell multi-block
physical read’ is the equivalent to ‘db file squattered read’ – go-ing
through the buffer cache.
This is a consequence of paral-lel_
degree_policy=AUTO because
it activates
In-Memory Parallel Execu-tion
in addition to Auto DOP. That fea-ture
allows Oracle to use conventional
reads for a parallel query. That can be
good in some cases because it benefit
from the buffer cache. But on Exadata
where I/O is so fast, we often prefer to
benefit from Smart Scan – offloading a
lot of processing to storage cells in-stead
of using database CPU to access
the buffer cache.
Of course, this is not a general recommendation
about the use of In-
Memory Parallel Execution on Exadata.
You have to check which is good for
your workload. I reproduced the Timed
Event here just to show how we can
quickly check if Smart Scan is used ef-ficiently.
7.
Tips&ceehinqstu 37
Summary
There are a lot of new wait events
and statistics for each new version of
Oracle, but only a few are relevant
when we read an AWR report just to get
an overview of the activity.
Here we focused on 4 wait events
and 10 statistics in order to evaluate the
efficiency of:
■ Exadata Smart Scan that improves
direct-path read throughput
(predicate and projection offload-ing
used to lower the I/O transfer,
and Storage Indexes and Com-pression
used to decrease disk
accesses).
■ Exadata Flash Cache that improves
small i/o calls latency.
Because there are so many parameters
in a system, doing a benchmark
and checking only the response time
is not sufficient. When we want to
understand the reason why response
time is better, to estimate the scalability,
and the new potential improve-ments,
we need to check those few
statistics. And we have seen that it
can even ben started before having
an Exadata plateform. ■
References
■ Best Practices For a Data Warehouse on the Sun Oracle Database Ma-chine,
Oracle white Paper
■ Oracle Exadata Simulator, by Arup Nanda
■ Important Statistics & Wait Events on Exadata, by Uwe Hesse
■ Expert Oracle Exadata By Kerry Osborne, Randy Johnson, Tanel Põder
Technik allein bringt
Sie nicht weiter.
Man muss wissen, wie man sie
richtig nutzt.
Trivadis ist das führende Unternehmen für IT-Beratung, Systemintegration und IT-Services mit Fokussierung auf Oracle-und
Microsoft-Technologien. Unsere Leistungen erbringen wir aus den strategischen Geschäftsfeldern Application
Development, Business Intelligence, Infrastructure Engineering und Training. Darüber hinaus übernimmt die Trivadis
Services den korrespondierenden Betrieb Ihrer IT-Systeme. Sprechen Sie mit uns über Ihre IT-Lösungen und vor allem:
welchen Nutzen wir Ihnen bringen. www.trivadis.com.
SOUG Newsletter 2/2013
A nzei ge
Trivadis Holding AG Europa-Strasse 5 CH-8152 Glattbrugg
Telefon +41 4480870-20 www.trivadis.com info@trivadis.com
Contact
Trivadis S.A.
Franck Pachot
E-Mail:
franck.pachot@trivadis.com