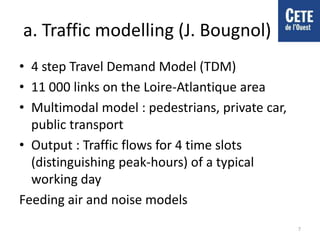
Eval-PDU: urban traffic and its environmental impacts
modelling to assess Urban Mobility Master Plan.
Conception of a methodology based on the Nantes’ case
Fouillé L., Broc J.-S., Bourges B., Bougnol J.,
Schmidt T., Ducroz F., Picaut J. and Mestayer P.
Introduction
• ANR « Sustainable City » 2008-2012
• SEA (Strategic Environmental assessment) method of UMMP
(Urban Mobility Master Plan)
• Application to Nantes UMMP 2000-2010
• A chain of models (traffic, emissions, air
quality, noise)
• Comparison of real and alternative situations
2
1. Needs analysis and problem’s
definition
• Toward ecomobility policies and « green »
UMMP (since a 1996 act)
• Toward systematic SEA of plans and programs
(EU Directive 2001/42/CE)
• Increasing need of tools and methods for ex
post and ex ante assessment
3
2. Nantes’ case study
• New infrastructures : BHLS (Bus with a High Level of Service,
here the Busway®), P+R (Park and Ride) facilities, tramline
extensions, road bridges over the Loire river…
• Many soft actions : mobility management
plans, carpooling website, car- and bike-
sharing systems, bus lanes…
• Except the Busway (biggest action), the
UMMP 2000-2010 seems a program of
transition
4
3. Method
A. General methodology
Two blocks:
1. Core approach : a chain of models
2. Peripheral approaches : socioeconomic
consequences (real estate values with a
hedonic price model, quality of life and travel
behaviour with dedicated social surveys,
health impacts with a basic method) and
alternative simplified approaches
5
B. Description of the chain of the
physically-based models
a. Traffic modelling (VISEM/VISUM)
b. Atmospheric emissions modelling (CIRCUL’AIR)
c. Air pollution dispersion modelling (ADMS
Urban)
d. Noise modelling
e. Using modelling tools for evaluation purpose
f. Definition of scenarios
a, b, c : existing models are adapted and used.
d : a specific simplified model is developed
6
a. Traffic modelling (J. Bougnol)
• 4 step Travel Demand Model (TDM)
• 11 000 links on the Loire-Atlantique area
• Multimodal model : pedestrians, private car,
public transport
• Output : Traffic flows for 4 time slots
(distinguishing peak-hours) of a typical
working day
Feeding air and noise models
7
b. Atmospheric emissions
modelling (T. Schmidt et F. Ducroz)
• Based on COPERT IV methodology (emissions levels by
average speed and by type of vehicles considering cold
start for cars and road gradient for lorries)
• Hourly traffic and average speed
• CITEPA vehicle fleet (motorization type, power class, EURO
standard, weight class, number of axles for trucks)
• This model also calculates energy consumption
• Output : kg per km of 20 pollutant for each link of the
network and each hour of a year
• Feeding air pollution dispersion model
• Circul’air is a model developed by ASPA (regional air quality
agency Alsace)
8
c. Air pollution dispersion
modelling (T. Schmidt et F. Ducroz)
• Chemistry/transport model
• 3000 road sources (bounded to the Nantes
Metropolis area and simplified network)
completed by other ponctual or surface sources
(residential and industrial)
• Output : concentrations of pollutants (average,
percentile) calculated in various point of an
adaptative grid
• A GIS interpolation allows to obtain a complete
visualization
9
d. Noise modelling
(J. Picaut)
• Development of a simplified software using
Orbis GIS platform (a GPL GIS)
• Meshing between buildings with a Delaunay
triangulation (calculation points)
• Road and/or rail noise
• Direct propagation, 1st and 2nd reflexion,
horizontal diffraction
• Output: sound pressure level on each point
(Ln, Lden), then interpolated
10
e. Using modelling tools
for evaluation purpose
• TDM were initially designed for other
purposes
• The existing literature has proven the
feasibility of using a chain of models (Chiquetto
and Mackett, 1995 ; Lee and Jo, 1995 ; Gualtieri and
Tartaglia, 1998; Ambrosino and al ., 1999; Brown and
Affum, 2002 ; Soleil and al ., 2002 ; Affum and al ., 2003 ;
Lagache and al ., 2006 ; Hatzopoulou and Miller, 2010)
• But discussions about scenarios definition and
modelling actions remained limited
11
f. Definition of
scenarios
• 3 reference situations (2002, 2008, 2008 P+R)
• 3 integrated scenarios (without Busway,
maximal UMMP, minimal UMMP)
• sensitivity tests (individual mobility, fuel price,
public transport prices, public transport
frequency, car parking rates, limitations of
statutory speeds, evolution of the vehicle
fleet...)
12
4. Results
traffic (flows and speeds, evening peak hour, focus on the ring road)
13
NO2 emissions variation with/without Busway®
14
NO2 concentrations variation with/without Busway®
15
Variation of the area exposed to a NO2 concentration higher than 40 µg.m-3
with/without Busway® 16
Road traffic noise map (including tram lines) expressed in Lden, focus on the town center
17
5. Encountered difficulties
• Calibration
• Input and output data uncertainties
• Presentation/visualization difficulties
• Discussion capacity
• Experience feedback
18
6. Conclusion
• The proposed methodology works
• Traffic modelling is a key stage
• Some policies are impossible to translate
(carpooling or bicycle promotion...)
• Eval-PDU: a tool to visualize and assess transport
policies and their main impacts (traffic, air
pollution, noise)
• Complex modelling chain requiring large amount
of data and expertise (work remains necessary on
simplification and flexibility for decision
supporting tool)
19
Thank you for your attention
laurent.fouille@mines-nantes.fr

Eval-PDU: urban traffic and its environmental impacts modelling to assess Urban Mobility Master Plan.

  • 1.
    Eval-PDU: urban trafficand its environmental impacts modelling to assess Urban Mobility Master Plan. Conception of a methodology based on the Nantes’ case Fouillé L., Broc J.-S., Bourges B., Bougnol J., Schmidt T., Ducroz F., Picaut J. and Mestayer P.
  • 2.
    Introduction • ANR «Sustainable City » 2008-2012 • SEA (Strategic Environmental assessment) method of UMMP (Urban Mobility Master Plan) • Application to Nantes UMMP 2000-2010 • A chain of models (traffic, emissions, air quality, noise) • Comparison of real and alternative situations 2
  • 3.
    1. Needs analysisand problem’s definition • Toward ecomobility policies and « green » UMMP (since a 1996 act) • Toward systematic SEA of plans and programs (EU Directive 2001/42/CE) • Increasing need of tools and methods for ex post and ex ante assessment 3
  • 4.
    2. Nantes’ casestudy • New infrastructures : BHLS (Bus with a High Level of Service, here the Busway®), P+R (Park and Ride) facilities, tramline extensions, road bridges over the Loire river… • Many soft actions : mobility management plans, carpooling website, car- and bike- sharing systems, bus lanes… • Except the Busway (biggest action), the UMMP 2000-2010 seems a program of transition 4
  • 5.
    3. Method A. Generalmethodology Two blocks: 1. Core approach : a chain of models 2. Peripheral approaches : socioeconomic consequences (real estate values with a hedonic price model, quality of life and travel behaviour with dedicated social surveys, health impacts with a basic method) and alternative simplified approaches 5
  • 6.
    B. Description ofthe chain of the physically-based models a. Traffic modelling (VISEM/VISUM) b. Atmospheric emissions modelling (CIRCUL’AIR) c. Air pollution dispersion modelling (ADMS Urban) d. Noise modelling e. Using modelling tools for evaluation purpose f. Definition of scenarios a, b, c : existing models are adapted and used. d : a specific simplified model is developed 6
  • 7.
    a. Traffic modelling(J. Bougnol) • 4 step Travel Demand Model (TDM) • 11 000 links on the Loire-Atlantique area • Multimodal model : pedestrians, private car, public transport • Output : Traffic flows for 4 time slots (distinguishing peak-hours) of a typical working day Feeding air and noise models 7
  • 8.
    b. Atmospheric emissions modelling(T. Schmidt et F. Ducroz) • Based on COPERT IV methodology (emissions levels by average speed and by type of vehicles considering cold start for cars and road gradient for lorries) • Hourly traffic and average speed • CITEPA vehicle fleet (motorization type, power class, EURO standard, weight class, number of axles for trucks) • This model also calculates energy consumption • Output : kg per km of 20 pollutant for each link of the network and each hour of a year • Feeding air pollution dispersion model • Circul’air is a model developed by ASPA (regional air quality agency Alsace) 8
  • 9.
    c. Air pollutiondispersion modelling (T. Schmidt et F. Ducroz) • Chemistry/transport model • 3000 road sources (bounded to the Nantes Metropolis area and simplified network) completed by other ponctual or surface sources (residential and industrial) • Output : concentrations of pollutants (average, percentile) calculated in various point of an adaptative grid • A GIS interpolation allows to obtain a complete visualization 9
  • 10.
    d. Noise modelling (J.Picaut) • Development of a simplified software using Orbis GIS platform (a GPL GIS) • Meshing between buildings with a Delaunay triangulation (calculation points) • Road and/or rail noise • Direct propagation, 1st and 2nd reflexion, horizontal diffraction • Output: sound pressure level on each point (Ln, Lden), then interpolated 10
  • 11.
    e. Using modellingtools for evaluation purpose • TDM were initially designed for other purposes • The existing literature has proven the feasibility of using a chain of models (Chiquetto and Mackett, 1995 ; Lee and Jo, 1995 ; Gualtieri and Tartaglia, 1998; Ambrosino and al ., 1999; Brown and Affum, 2002 ; Soleil and al ., 2002 ; Affum and al ., 2003 ; Lagache and al ., 2006 ; Hatzopoulou and Miller, 2010) • But discussions about scenarios definition and modelling actions remained limited 11
  • 12.
    f. Definition of scenarios •3 reference situations (2002, 2008, 2008 P+R) • 3 integrated scenarios (without Busway, maximal UMMP, minimal UMMP) • sensitivity tests (individual mobility, fuel price, public transport prices, public transport frequency, car parking rates, limitations of statutory speeds, evolution of the vehicle fleet...) 12
  • 13.
    4. Results traffic (flowsand speeds, evening peak hour, focus on the ring road) 13
  • 14.
    NO2 emissions variationwith/without Busway® 14
  • 15.
    NO2 concentrations variationwith/without Busway® 15
  • 16.
    Variation of thearea exposed to a NO2 concentration higher than 40 µg.m-3 with/without Busway® 16
  • 17.
    Road traffic noisemap (including tram lines) expressed in Lden, focus on the town center 17
  • 18.
    5. Encountered difficulties •Calibration • Input and output data uncertainties • Presentation/visualization difficulties • Discussion capacity • Experience feedback 18
  • 19.
    6. Conclusion • Theproposed methodology works • Traffic modelling is a key stage • Some policies are impossible to translate (carpooling or bicycle promotion...) • Eval-PDU: a tool to visualize and assess transport policies and their main impacts (traffic, air pollution, noise) • Complex modelling chain requiring large amount of data and expertise (work remains necessary on simplification and flexibility for decision supporting tool) 19
  • 20.
    Thank you foryour attention laurent.fouille@mines-nantes.fr