Download to read offline


![Main objectives of the iMOVE project
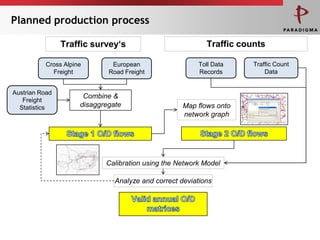
Improve the production process and the quality of
the O/D flow matrices
Combine & harmonize different surveys
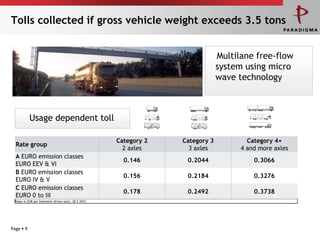
Incorporate highway toll data into the O/D flows
trips / between counties per truck category per day
Calibrate the O/D flows, using traffic count numbers of
permanent counting stations
[Verify and consider the hypothesized growth in
multimodal movements]
Prototype a repeatable data production process](https://image.slidesharecdn.com/preurostat01-130206045122-phpapp01/85/EUROSTAT-Presentation-4-320.jpg)


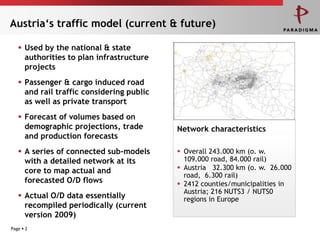
The document discusses Austria's traffic model which is used to plan infrastructure projects. It considers passenger and cargo traffic on road and rail networks. The model is made up of interconnected sub-models and forecasts traffic volumes based on demographic and economic data. It also maps actual and projected origin-destination flows. The iMOVE project aims to improve the model by combining different traffic surveys, incorporating toll data, and calibrating origin-destination matrices using traffic counts. This will help create a repeatable process for producing more accurate transportation data and forecasts.


