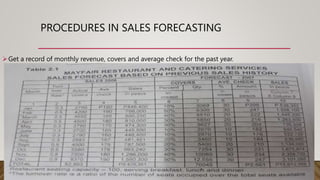
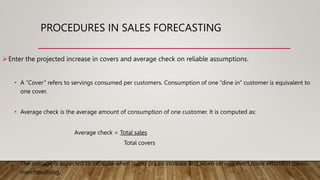
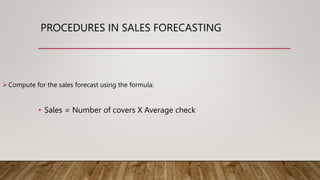
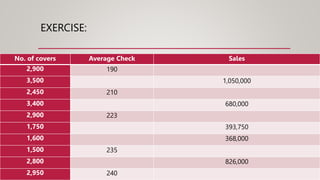
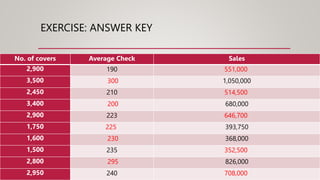
ESTABLISHING SALES
TARGET
WITHOUT GOALS OR TARGETS, ONE WOULD NOT KNOW WHERE
HE IS GOING AND HOW WELL HE IS DOING
FORECASTING FOOD AND BEVERAGE SALES
Operating a viable and profitable food business starts with an
identification of specific, measurable, and realistic sales forecast, also
known as sales projection
A sales projection or sales forecast provides figures regarding the number
of covers, average check, amount of revenue and profit that the food
business wants to generate.
With this sales target in mind, the management can design product
FORECASTING FOOD AND BEVERAGE SALES
Aside from serving as a guide for direction setting, the sales forecast helps
to determine whether the business can generate enough sales to cover for
the fixed cost and at the same time make a good return of one’s
investment.
ADVANTAGES OF A SALES FORECAST
The sales forecast is an important tool for decision-making. Budget allocations will depend on expected
earnings. The volume of stocks wo be ordered and purchased will depend on the projected volume of
covers or patronage.
Sales forecast serves as a parameter for assessing the progress of business. One can say business is
doing well when the sales and profit targets are being achieved.
The forecast is a motivating tool.
PROCEDURES IN SALES FORECASTING
Get a record of monthly revenue, covers and average check for the past year.
PROCEDURES IN SALES FORECASTING
Enter the projected increase in covers and average check on reliable assumptions.
• A “Cover” refers to servings consumed per customers. Consumption of one “dine in” customer is equivalent to
one cover.
• Average check is the average amount of consumption of one customer. It is computed as:
Average check = Total sales
Total covers
• The average is expected to increase when menu prices increase and when servers exert more efforts in menu
merchandising.
PROCEDURES IN SALES FORECASTING
Compute for the sales forecast using the formula:
• Sales = Number of covers X Average check
EXERCISE:
No. of covers Average Check Sales
2,900 190
3,500 1,050,000
2,450 210
3,400 680,000
2,900 223
1,750 393,750
1,600 368,000
1,500 235
2,800 826,000
2,950 240
EXERCISE: ANSWER KEY
No. of covers Average Check Sales
2,900 190 551,000
3,500 300 1,050,000
2,450 210 514,500
3,400 200 680,000
2,900 223 646,700
1,750 225 393,750
1,600 230 368,000
1,500 235 352,500
2,800 295 826,000
2,950 240 708,000

Establishing Sales Target.pptx

  • 1.
    ESTABLISHING SALES TARGET WITHOUT GOALSOR TARGETS, ONE WOULD NOT KNOW WHERE HE IS GOING AND HOW WELL HE IS DOING
  • 2.
    FORECASTING FOOD ANDBEVERAGE SALES Operating a viable and profitable food business starts with an identification of specific, measurable, and realistic sales forecast, also known as sales projection A sales projection or sales forecast provides figures regarding the number of covers, average check, amount of revenue and profit that the food business wants to generate. With this sales target in mind, the management can design product
  • 3.
    FORECASTING FOOD ANDBEVERAGE SALES Aside from serving as a guide for direction setting, the sales forecast helps to determine whether the business can generate enough sales to cover for the fixed cost and at the same time make a good return of one’s investment.
  • 4.
    ADVANTAGES OF ASALES FORECAST The sales forecast is an important tool for decision-making. Budget allocations will depend on expected earnings. The volume of stocks wo be ordered and purchased will depend on the projected volume of covers or patronage. Sales forecast serves as a parameter for assessing the progress of business. One can say business is doing well when the sales and profit targets are being achieved. The forecast is a motivating tool.
  • 5.
    PROCEDURES IN SALESFORECASTING Get a record of monthly revenue, covers and average check for the past year.
  • 6.
    PROCEDURES IN SALESFORECASTING Enter the projected increase in covers and average check on reliable assumptions. • A “Cover” refers to servings consumed per customers. Consumption of one “dine in” customer is equivalent to one cover. • Average check is the average amount of consumption of one customer. It is computed as: Average check = Total sales Total covers • The average is expected to increase when menu prices increase and when servers exert more efforts in menu merchandising.
  • 7.
    PROCEDURES IN SALESFORECASTING Compute for the sales forecast using the formula: • Sales = Number of covers X Average check
  • 8.
    EXERCISE: No. of coversAverage Check Sales 2,900 190 3,500 1,050,000 2,450 210 3,400 680,000 2,900 223 1,750 393,750 1,600 368,000 1,500 235 2,800 826,000 2,950 240
  • 9.
    EXERCISE: ANSWER KEY No.of covers Average Check Sales 2,900 190 551,000 3,500 300 1,050,000 2,450 210 514,500 3,400 200 680,000 2,900 223 646,700 1,750 225 393,750 1,600 230 368,000 1,500 235 352,500 2,800 295 826,000 2,950 240 708,000