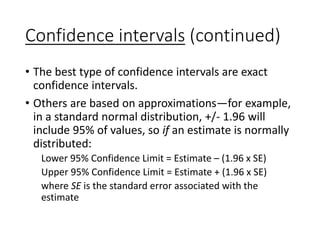
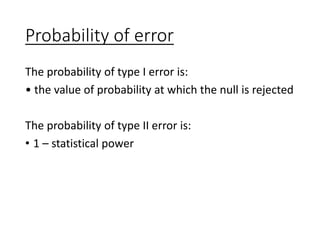
Instructor Resource
Chapter 5
Copyright © Scott B. Patten, 2015.
Permission granted for classroom use with
Epidemiology for Canadian Students: Principles,
Methods & Critical Appraisal (Edmonton: Brush
Education Inc. www.brusheducation.ca).
Chapter 5. Random error
from sampling
Objectives
• Identify and differentiate the 2 main sources of
error in epidemiologic research: random error and
systematic error.
• Describe the relationship between sampling and
random error.
• Define confidence intervals and how to calculate
them.
Objectives (continued)
• Describe the relationship between sample size and
precision in a prevalence study.
• Differentiate estimation and statistical testing.
• Describe statistical testing and define key related
concepts (significant versus nonsignificant tests,
type I and type II error, statistical power).
• Explain the influence of sample size on statistical
power.
Sources of error in
epidemiological research
Sources of error include:
• random error (a.k.a. stochastic error)
• systematic error (a.k.a. bias)
A clear definition of bias comes from a clear
understanding of what is meant by random error—
which is why we are starting with random error.
PREVALENCE
• PREVALENCE is spelled in uppercase letters to
indicate that the parameter is calculated from the
population (not sampled) data.
• PREVALENCE is not an estimate: in the absence of
measurement errors, it is the true population
parameter.
Prevalence
• Prevalence is spelled in lowercase letters
(prevalence) to indicate that the parameter is
calculated from a sample.
• When calculated from a sample, prevalence is an
estimate: repeating the process of sampling would
result in different estimates.
• The different estimates are due to sampling
variability.
• The difference between a true value and a sample-
based estimate is a type of error: random error.
Random samples
• In a random sample, the selection of subjects into
the sample cannot be predicted.
• Each person’s disease status is an independent
observation that reflects true prevalence of disease
in the population through the law of large
numbers.
• The sample prevalence therefore estimates the
true value, but can differ from the true value due to
random error.
Sampling terminology
• In a probability sample, the probability of selecting
a person from the population is known.
• A simple random sample is a basic form of a
probability sample: the probability of selecting
each member of the population is the same.
• The probability of selection is a selection
probability.
• In practice, sampling requires a list from which to
select. This is a sampling frame.
Sampling terminology (continued)
• Inference describes the process of gaining
information about a population based on data
collected from a sample.
• The target population is the subject of inference: it
is the population whose parameters are estimated
through sampling.
Sampling terminology (continued)
• A source population is a subset of a target
population: it is a smaller population within a larger
target population from which a sample is drawn.
• A study population is common term for a sample
drawn from a source population: this is a confusing
term because a “study population” is not a
population, it’s a sample.
Dealing with random error
• The law of large numbers predicts that larger
samples lead to parameter estimates (e.g.,
prevalence) that more closely reflect the true
population values.
• Therefore, epidemiological studies prefer large
samples.
• Nevertheless, random error needs to be addressed
during data analysis.
Dealing with random error
(continued)
• There are 2 general approaches:
• confidence intervals
• statistical tests
• Confidence intervals are the preferred approach.
Confidence intervals
• Confidence intervals define a range of plausible
values for true population parameters, based on a
desired level of confidence.
• Usually, 95% confidence is the desired level.
• A confidence interval consists of 2 numbers called
confidence limits.
• The confidence interval comprises all values
between the lower and upper confidence limits.
• You can be 95% confident that a 95% confidence
interval captures the true population value.
Confidence intervals (continued)
• The best type of confidence intervals are exact
confidence intervals.
• Others are based on approximations—for example,
in a standard normal distribution, +/- 1.96 will
include 95% of values, so if an estimate is normally
distributed:
Lower 95% Confidence Limit = Estimate – (1.96 x SE)
Upper 95% Confidence Limit = Estimate + (1.96 x SE)
where SE is the standard error associated with the
estimate
Statistical tests
• Instead of providing a range of values, statistical
tests are designed to help answer the question, “Is
exposure associated with disease?”
• They follow a series of steps.
Statistical tests (continued)
• Step 1: Formulate a null hypothesis (e.g., there is
no association between exposure and disease).
• Step 2: Calculate the probability of observing an
effect as large, or larger, than observed due to
chance, assuming that the null hypothesis is true.
• Step 3: If the probability in step 2 is small, the null
hypothesis is rejected.
Statistical tests (continued)
• Statistical tests work by rejecting a hypothesis, not
by proving a hypothesis.
• Null hypotheses are never rejected with certainty,
they are just deemed unlikely
• The decision that a result (or one more extreme) is
unlikely is usually based on its probability (given
the null hypothesis) being less than 5% (p < 0.05).
Statistical errors
• Statistical tests can make 2 types of errors:
• rejecting a null assumption that is true (type I error)
• failing to reject a null assumption that is false (type II
error)
An association
exists in the
population
(null hypothesis is
false)
No association
exists in the
population
(null hypothesis is
true)
Statistical test is
significant
No error Type I error
Statistical test is
nonsignificant
Type II error No error
Statistical power
• Statistical power is the probability of rejecting a
null hypothesis that is false.
• Power is calculated from:
• sample size (larger = greater power)
• effect size (bigger = greater power)
• probability at which null rejected (larger = greater
power*)
• For continuous measures (e.g., comparing means),
the standard deviation of the outcome also
contributes to statistical power.
* but this is usually set at the conventional 5% power and not changed to increase power
Probability of error
The probability of type I error is:
• the value of probability at which the null is rejected
The probability of type II error is:
• 1 – statistical power
End

Epidemiology Chapter 5.pptx

  • 1.
    Instructor Resource Chapter 5 Copyright© Scott B. Patten, 2015. Permission granted for classroom use with Epidemiology for Canadian Students: Principles, Methods & Critical Appraisal (Edmonton: Brush Education Inc. www.brusheducation.ca).
  • 2.
    Chapter 5. Randomerror from sampling
  • 3.
    Objectives • Identify anddifferentiate the 2 main sources of error in epidemiologic research: random error and systematic error. • Describe the relationship between sampling and random error. • Define confidence intervals and how to calculate them.
  • 4.
    Objectives (continued) • Describethe relationship between sample size and precision in a prevalence study. • Differentiate estimation and statistical testing. • Describe statistical testing and define key related concepts (significant versus nonsignificant tests, type I and type II error, statistical power). • Explain the influence of sample size on statistical power.
  • 5.
    Sources of errorin epidemiological research Sources of error include: • random error (a.k.a. stochastic error) • systematic error (a.k.a. bias) A clear definition of bias comes from a clear understanding of what is meant by random error— which is why we are starting with random error.
  • 6.
    PREVALENCE • PREVALENCE isspelled in uppercase letters to indicate that the parameter is calculated from the population (not sampled) data. • PREVALENCE is not an estimate: in the absence of measurement errors, it is the true population parameter.
  • 7.
    Prevalence • Prevalence isspelled in lowercase letters (prevalence) to indicate that the parameter is calculated from a sample. • When calculated from a sample, prevalence is an estimate: repeating the process of sampling would result in different estimates. • The different estimates are due to sampling variability. • The difference between a true value and a sample- based estimate is a type of error: random error.
  • 8.
    Random samples • Ina random sample, the selection of subjects into the sample cannot be predicted. • Each person’s disease status is an independent observation that reflects true prevalence of disease in the population through the law of large numbers. • The sample prevalence therefore estimates the true value, but can differ from the true value due to random error.
  • 9.
    Sampling terminology • Ina probability sample, the probability of selecting a person from the population is known. • A simple random sample is a basic form of a probability sample: the probability of selecting each member of the population is the same. • The probability of selection is a selection probability. • In practice, sampling requires a list from which to select. This is a sampling frame.
  • 10.
    Sampling terminology (continued) •Inference describes the process of gaining information about a population based on data collected from a sample. • The target population is the subject of inference: it is the population whose parameters are estimated through sampling.
  • 11.
    Sampling terminology (continued) •A source population is a subset of a target population: it is a smaller population within a larger target population from which a sample is drawn. • A study population is common term for a sample drawn from a source population: this is a confusing term because a “study population” is not a population, it’s a sample.
  • 12.
    Dealing with randomerror • The law of large numbers predicts that larger samples lead to parameter estimates (e.g., prevalence) that more closely reflect the true population values. • Therefore, epidemiological studies prefer large samples. • Nevertheless, random error needs to be addressed during data analysis.
  • 13.
    Dealing with randomerror (continued) • There are 2 general approaches: • confidence intervals • statistical tests • Confidence intervals are the preferred approach.
  • 14.
    Confidence intervals • Confidenceintervals define a range of plausible values for true population parameters, based on a desired level of confidence. • Usually, 95% confidence is the desired level. • A confidence interval consists of 2 numbers called confidence limits. • The confidence interval comprises all values between the lower and upper confidence limits. • You can be 95% confident that a 95% confidence interval captures the true population value.
  • 15.
    Confidence intervals (continued) •The best type of confidence intervals are exact confidence intervals. • Others are based on approximations—for example, in a standard normal distribution, +/- 1.96 will include 95% of values, so if an estimate is normally distributed: Lower 95% Confidence Limit = Estimate – (1.96 x SE) Upper 95% Confidence Limit = Estimate + (1.96 x SE) where SE is the standard error associated with the estimate
  • 16.
    Statistical tests • Insteadof providing a range of values, statistical tests are designed to help answer the question, “Is exposure associated with disease?” • They follow a series of steps.
  • 17.
    Statistical tests (continued) •Step 1: Formulate a null hypothesis (e.g., there is no association between exposure and disease). • Step 2: Calculate the probability of observing an effect as large, or larger, than observed due to chance, assuming that the null hypothesis is true. • Step 3: If the probability in step 2 is small, the null hypothesis is rejected.
  • 18.
    Statistical tests (continued) •Statistical tests work by rejecting a hypothesis, not by proving a hypothesis. • Null hypotheses are never rejected with certainty, they are just deemed unlikely • The decision that a result (or one more extreme) is unlikely is usually based on its probability (given the null hypothesis) being less than 5% (p < 0.05).
  • 19.
    Statistical errors • Statisticaltests can make 2 types of errors: • rejecting a null assumption that is true (type I error) • failing to reject a null assumption that is false (type II error)
  • 20.
    An association exists inthe population (null hypothesis is false) No association exists in the population (null hypothesis is true) Statistical test is significant No error Type I error Statistical test is nonsignificant Type II error No error
  • 21.
    Statistical power • Statisticalpower is the probability of rejecting a null hypothesis that is false. • Power is calculated from: • sample size (larger = greater power) • effect size (bigger = greater power) • probability at which null rejected (larger = greater power*) • For continuous measures (e.g., comparing means), the standard deviation of the outcome also contributes to statistical power. * but this is usually set at the conventional 5% power and not changed to increase power
  • 22.
    Probability of error Theprobability of type I error is: • the value of probability at which the null is rejected The probability of type II error is: • 1 – statistical power
  • 23.