SAP BOBJ Enterprise Dashboard - Sales Plan, Pipeline and Forecast
•
8 likes•4,403 views

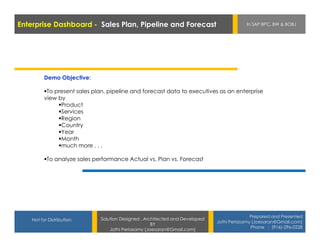
SAP BPC SAP BW SAP ECC SAP BOBJ Xcelsius Dashboard To present sales plan, pipeline and forecast data to executives as an enterprise view by Product Services Region Country Year Month much more . . . To analyze sales performance Actual vs. Plan vs. Forecast

Recommended
Recommended
More Related Content
What's hot
What's hot (17)
Viewers also liked
Viewers also liked (17)
Similar to SAP BOBJ Enterprise Dashboard - Sales Plan, Pipeline and Forecast
Similar to SAP BOBJ Enterprise Dashboard - Sales Plan, Pipeline and Forecast (20)
More from Jothi Periasamy
More from Jothi Periasamy (20)
Recently uploaded
Recently uploaded (20)
SAP BOBJ Enterprise Dashboard - Sales Plan, Pipeline and Forecast
- 1. Enterprise Dashboard - Sales Plan, Pipeline and Forecast In SAP BPC, BW & BOBJ Demo Objective: To present sales plan, pipeline and forecast data to executives as an enterprise view by Product Services Region Country Year Month much more . . . To analyze sales performance Actual vs. Plan vs. Forecast Prepared and Presented Not for Distribution. Solution Designed , Architected and Developed Jothi Periasamy (Joesaran@Gmail.com) BY Phone : (916)-296-0228 Jothi Periasamy (Joesaran@Gmail.com)
- 2. EY Internal Enterprise Dashboard - Sales Plan, Pipeline and Forecast In SAP BPC, BW & BOBJ Use Only Technology Scope SAP NetWeaver Systems Landscape Revenue Cost Budget Process Process Process SAP BPC SAP BW SAP ECC Revenue Cost Budget Drivers/ Drivers/ SAP BOBJ Balanc Scenario Scenario Scenario Xcelsius Dashboard e Sheet P&L Consolidation and Reporting Process Cash Flow Sales Sales SAP Business Revenue Cost Objects Xcelsius Sales Forecast Plan/Budget/Forecast/Consolidated Data Storage SAP Oracle JDE/etc Data Source / Actuals Prepared and Presented Solution Designed , Architected and Developed Not for Distribution. Jothi Periasamy (Joesaran@Gmail.com) BY Jothi Periasamy (Joesaran@Gmail.com) Phone : (916)-296-0228
- 3. Enterprise Dashboard - Sales Plan , Pipeline and Forecast In SAP BPC, BW & BOBJ Product Sales Service Sales Other Sales Sales Actual Plan Plan Plan Sales Forecast Prepared and Presented Not for Distribution. Solution Designed , Architected and Developed Jothi Periasamy (Joesaran@Gmail.com) BY Phone : (916)-296-0228 Jothi Periasamy (Joesaran@Gmail.com)
- 4. Enterprise Dashboard - Sales Plan, Pipeline and Forecast In SAP BPC, BW & BOBJ Sales Plan, Pipeline , and Forecast Analysis Prepared and Presented Not for Distribution. Solution Designed , Architected and Developed Jothi Periasamy (Joesaran@Gmail.com) BY Phone : (916)-296-0228 Jothi Periasamy (Joesaran@Gmail.com)
- 5. Enterprise Dashboard - Sales Plan, Pipeline and Forecast In SAP BPC, BW & BOBJ Sales Plan, Pipeline , and Forecast Analysis Prepared and Presented Not for Distribution. Solution Designed , Architected and Developed Jothi Periasamy (Joesaran@Gmail.com) BY Phone : (916)-296-0228 Jothi Periasamy (Joesaran@Gmail.com)
- 6. Enterprise Dashboard - Sales Plan, Pipeline and Forecast In SAP BPC, BW & BOBJ Sales Plan, Pipeline , and Forecast Analysis Prepared and Presented Not for Distribution. Solution Designed , Architected and Developed Jothi Periasamy (Joesaran@Gmail.com) BY Phone : (916)-296-0228 Jothi Periasamy (Joesaran@Gmail.com)
- 7. Enterprise Dashboard - Sales Plan, Pipeline and Forecast In SAP BPC, BW & BOBJ Sales Plan, Pipeline , and Forecast Analysis Prepared and Presented Not for Distribution. Solution Designed , Architected and Developed Jothi Periasamy (Joesaran@Gmail.com) BY Phone : (916)-296-0228 Jothi Periasamy (Joesaran@Gmail.com)
- 8. Enterprise Dashboard - Sales Plan, Pipeline and Forecast In SAP BPC, BW & BOBJ Sales Plan, Pipeline , and Forecast Analysis Prepared and Presented Not for Distribution. Solution Designed , Architected and Developed Jothi Periasamy (Joesaran@Gmail.com) BY Phone : (916)-296-0228 Jothi Periasamy (Joesaran@Gmail.com)
- 9. Enterprise Dashboard - Sales Plan, Pipeline and Forecast In SAP BPC, BW & BOBJ Sales Plan, Pipeline , and Forecast Analysis Prepared and Presented Not for Distribution. Solution Designed , Architected and Developed Jothi Periasamy (Joesaran@Gmail.com) BY Phone : (916)-296-0228 Jothi Periasamy (Joesaran@Gmail.com)
- 10. Enterprise Dashboard - Sales Plan, Pipeline and Forecast In SAP BPC, BW & BOBJ Sales Plan, Pipeline , and Forecast Analysis Prepared and Presented Not for Distribution. Solution Designed , Architected and Developed Jothi Periasamy (Joesaran@Gmail.com) BY Phone : (916)-296-0228 Jothi Periasamy (Joesaran@Gmail.com)
- 11. Enterprise Dashboard - Sales Plan, Pipeline and Forecast In SAP BPC, BW & BOBJ Sales Plan, Pipeline , and Forecast Analysis Prepared and Presented Not for Distribution. Solution Designed , Architected and Developed Jothi Periasamy (Joesaran@Gmail.com) BY Phone : (916)-296-0228 Jothi Periasamy (Joesaran@Gmail.com)
- 12. Enterprise Dashboard - Sales Plan, Pipeline and Forecast In SAP BPC, BW & BOBJ Sales Plan, Pipeline , and Forecast Analysis Prepared and Presented Not for Distribution. Solution Designed , Architected and Developed Jothi Periasamy (Joesaran@Gmail.com) BY Phone : (916)-296-0228 Jothi Periasamy (Joesaran@Gmail.com)
- 13. Enterprise Dashboard - Sales Plan, Pipeline and Forecast In SAP BPC, BW & BOBJ Enterprise Dashboard Implementation View Prepared and Presented Not for Distribution. Solution Designed , Architected and Developed Jothi Periasamy (Joesaran@Gmail.com) BY Phone : (916)-296-0228 Jothi Periasamy (Joesaran@Gmail.com)
- 14. Enterprise Dashboard - Sales Plan , Pipeline and Forecast In SAP BPC, BW & BOBJ Steps: 1. Log in the BPC Admin Console Prepared and Presented Not for Distribution. Solution Designed , Architected and Developed Jothi Periasamy (Joesaran@Gmail.com) BY Phone : (916)-296-0228 Jothi Periasamy (Joesaran@Gmail.com)
- 15. Enterprise Dashboard - Sales Plan , Pipeline and Forecast In SAP BPC, BW & BOBJ 2. Within the Dimension Library, click on “P_Entity” and choose “Maintain dimension Member ” Prepared and Presented Not for Distribution. Solution Designed , Architected and Developed Jothi Periasamy (Joesaran@Gmail.com) BY Phone : (916)-296-0228 Jothi Periasamy (Joesaran@Gmail.com)
- 16. Enterprise Dashboard - Sales Plan , Pipeline and Forecast In SAP BPC, BW & BOBJ 3. Add the dimension members to “A_ACCOUNT” Dimension Member Sheet. Prepared and Presented Not for Distribution. Solution Designed , Architected and Developed Jothi Periasamy (Joesaran@Gmail.com) BY Phone : (916)-296-0228 Jothi Periasamy (Joesaran@Gmail.com)
- 17. Enterprise Dashboard - Sales Plan , Pipeline and Forecast In SAP BPC, BW & BOBJ 4. Click “Save to Server”. 5. Click “Process dimension” Prepared and Presented Not for Distribution. Solution Designed , Architected and Developed Jothi Periasamy (Joesaran@Gmail.com) BY Phone : (916)-296-0228 Jothi Periasamy (Joesaran@Gmail.com)
- 18. Enterprise Dashboard - Sales Plan , Pipeline and Forecast In SAP BPC, BW & BOBJ 6. Choose “P_Entity” and click OK. Prepared and Presented Not for Distribution. Solution Designed , Architected and Developed Jothi Periasamy (Joesaran@Gmail.com) BY Phone : (916)-296-0228 Jothi Periasamy (Joesaran@Gmail.com)
- 19. Enterprise Dashboard - Sales Plan , Pipeline and Forecast In SAP BPC, BW & BOBJ 7. Click OK. Prepared and Presented Not for Distribution. Solution Designed , Architected and Developed Jothi Periasamy (Joesaran@Gmail.com) BY Phone : (916)-296-0228 Jothi Periasamy (Joesaran@Gmail.com)
- 20. Enterprise Dashboard - Sales Plan , Pipeline and Forecast In SAP BPC, BW & BOBJ 8. Go to the Dimension Library and choose “P_ACCT” and click “Maintain Dimension Members” . Prepared and Presented Not for Distribution. Solution Designed , Architected and Developed Jothi Periasamy (Joesaran@Gmail.com) BY Phone : (916)-296-0228 Jothi Periasamy (Joesaran@Gmail.com)
- 21. Enterprise Dashboard - Sales Plan , Pipeline and Forecast In SAP BPC, BW & BOBJ 9. Add the dimension members to “P_ACCT” Dimension Member Sheet. Prepared and Presented Not for Distribution. Solution Designed , Architected and Developed Jothi Periasamy (Joesaran@Gmail.com) BY Phone : (916)-296-0228 Jothi Periasamy (Joesaran@Gmail.com)
- 22. Enterprise Dashboard - Sales Plan , Pipeline and Forecast In SAP BPC, BW & BOBJ 10. Click “Save to Server” 11. Click “Process Dimension” and click OK. Prepared and Presented Not for Distribution. Solution Designed , Architected and Developed Jothi Periasamy (Joesaran@Gmail.com) BY Phone : (916)-296-0228 Jothi Periasamy (Joesaran@Gmail.com)
- 23. Enterprise Dashboard - Sales Plan , Pipeline and Forecast In SAP BPC, BW & BOBJ 12. Choose “P_ACCT” and click OK. Prepared and Presented Not for Distribution. Solution Designed , Architected and Developed Jothi Periasamy (Joesaran@Gmail.com) BY Phone : (916)-296-0228 Jothi Periasamy (Joesaran@Gmail.com)
- 24. Enterprise Dashboard - Sales Plan , Pipeline and Forecast In SAP BPC, BW & BOBJ 13. Click OK. Prepared and Presented Not for Distribution. Solution Designed , Architected and Developed Jothi Periasamy (Joesaran@Gmail.com) BY Phone : (916)-296-0228 Jothi Periasamy (Joesaran@Gmail.com)
- 25. Enterprise Dashboard - Sales Plan , Pipeline and Forecast In SAP BPC, BW & BOBJ 14. Go to the Dimension Library and choose “Product” and click “Maintain Dimension Members” . Prepared and Presented Not for Distribution. Solution Designed , Architected and Developed Jothi Periasamy (Joesaran@Gmail.com) BY Phone : (916)-296-0228 Jothi Periasamy (Joesaran@Gmail.com)
- 26. Enterprise Dashboard - Sales Plan , Pipeline and Forecast In SAP BPC, BW & BOBJ 15. Add the dimension members to “Product” Dimension Member Sheet. Prepared and Presented Not for Distribution. Solution Designed , Architected and Developed Jothi Periasamy (Joesaran@Gmail.com) BY Phone : (916)-296-0228 Jothi Periasamy (Joesaran@Gmail.com)
- 27. Enterprise Dashboard - Sales Plan , Pipeline and Forecast In SAP BPC, BW & BOBJ 16. Click “Save to Server” 17. Click “Process Dimension” and click OK. Prepared and Presented Not for Distribution. Solution Designed , Architected and Developed Jothi Periasamy (Joesaran@Gmail.com) BY Phone : (916)-296-0228 Jothi Periasamy (Joesaran@Gmail.com)
- 28. Enterprise Dashboard - Sales Plan , Pipeline and Forecast In SAP BPC, BW & BOBJ 18. Choose “Product” and click OK. Prepared and Presented Not for Distribution. Solution Designed , Architected and Developed Jothi Periasamy (Joesaran@Gmail.com) BY Phone : (916)-296-0228 Jothi Periasamy (Joesaran@Gmail.com)
- 29. Enterprise Dashboard - Sales Plan , Pipeline and Forecast In SAP BPC, BW & BOBJ 19. Click OK. Prepared and Presented Not for Distribution. Solution Designed , Architected and Developed Jothi Periasamy (Joesaran@Gmail.com) BY Phone : (916)-296-0228 Jothi Periasamy (Joesaran@Gmail.com)
- 30. Enterprise Dashboard - Sales Plan , Pipeline and Forecast In SAP BPC, BW & BOBJ 19. Go to the Dimension Library and choose “TIME” and click “Maintain Dimension Members” . Prepared and Presented Not for Distribution. Solution Designed , Architected and Developed Jothi Periasamy (Joesaran@Gmail.com) BY Phone : (916)-296-0228 Jothi Periasamy (Joesaran@Gmail.com)
- 31. Enterprise Dashboard - Sales Plan , Pipeline and Forecast In SAP BPC, BW & BOBJ 20. Add the dimension members to “Time” Dimension Member Sheet. Prepared and Presented Not for Distribution. Solution Designed , Architected and Developed Jothi Periasamy (Joesaran@Gmail.com) BY Phone : (916)-296-0228 Jothi Periasamy (Joesaran@Gmail.com)
- 32. Enterprise Dashboard - Sales Plan , Pipeline and Forecast In SAP BPC, BW & BOBJ 21. Click “Save to Server” 22. Click “Process Dimension” and click OK. Prepared and Presented Not for Distribution. Solution Designed , Architected and Developed Jothi Periasamy (Joesaran@Gmail.com) BY Phone : (916)-296-0228 Jothi Periasamy (Joesaran@Gmail.com)
- 33. Enterprise Dashboard - Sales Plan, Pipeline and Forecast In SAP BPC, BW & BOBJ 23. Choose “Product” and click OK. Prepared and Presented Not for Distribution. Solution Designed , Architected and Developed Jothi Periasamy (Joesaran@Gmail.com) BY Phone : (916)-296-0228 Jothi Periasamy (Joesaran@Gmail.com)
- 34. Enterprise Dashboard - Sales Plan , Pipeline and Forecast In SAP BPC, BW & BOBJ 24. Click OK. Prepared and Presented Not for Distribution. Solution Designed , Architected and Developed Jothi Periasamy (Joesaran@Gmail.com) BY Phone : (916)-296-0228 Jothi Periasamy (Joesaran@Gmail.com)
- 35. Enterprise Dashboard - Sales Plan , Pipeline and Forecast In SAP BPC, BW & BOBJ 25. Select the Application and Modify Application Prepared and Presented Not for Distribution. Solution Designed , Architected and Developed Jothi Periasamy (Joesaran@Gmail.com) BY Phone : (916)-296-0228 Jothi Periasamy (Joesaran@Gmail.com)
- 36. Enterprise Dashboard - Sales Plan , Pipeline and Forecast In SAP BPC, BW & BOBJ Prepared and Presented Not for Distribution. Solution Designed , Architected and Developed Jothi Periasamy (Joesaran@Gmail.com) BY Phone : (916)-296-0228 Jothi Periasamy (Joesaran@Gmail.com)
- 37. Enterprise Dashboard - Sales Plan , Pipeline and Forecast In SAP BPC, BW & BOBJ 26. Click “OK”. Prepared and Presented Not for Distribution. Solution Designed , Architected and Developed Jothi Periasamy (Joesaran@Gmail.com) BY Phone : (916)-296-0228 Jothi Periasamy (Joesaran@Gmail.com)
- 38. Enterprise Dashboard - Sales Plan , Pipeline and Forecast In SAP BPC, BW & BOBJ Upload Data: we will enter data for the “Sales” account for all “Products” and all entities under “Region” for 2010.TOTAL. 1. Log on to BPC Excel 2. Choose “Manage Data”. Prepared and Presented Not for Distribution. Solution Designed , Architected and Developed Jothi Periasamy (Joesaran@Gmail.com) BY Phone : (916)-296-0228 Jothi Periasamy (Joesaran@Gmail.com)
- 39. Enterprise Dashboard - Sales Plan , Pipeline and Forecast In SAP BPC, BW & BOBJ 3. Upload Data file for SalesActualData. 4. Give the Source and Destination file. 5. Click ‘OK’ Prepared and Presented Not for Distribution. Solution Designed , Architected and Developed Jothi Periasamy (Joesaran@Gmail.com) BY Phone : (916)-296-0228 Jothi Periasamy (Joesaran@Gmail.com)
- 40. Enterprise Dashboard - Sales Plan , Pipeline and Forecast In SAP BPC, BW & BOBJ 6. Run Data Management Package. 7. Select Import Transaction Data and click on Run. Prepared and Presented Not for Distribution. Solution Designed , Architected and Developed Jothi Periasamy (Joesaran@Gmail.com) BY Phone : (916)-296-0228 Jothi Periasamy (Joesaran@Gmail.com)
- 41. Enterprise Dashboard - Sales Plan , Pipeline and Forecast In SAP BPC, BW & BOBJ 8. Select Import File and click on Next. Prepared and Presented Not for Distribution. Solution Designed , Architected and Developed Jothi Periasamy (Joesaran@Gmail.com) BY Phone : (916)-296-0228 Jothi Periasamy (Joesaran@Gmail.com)
- 42. Enterprise Dashboard - Sales Plan , Pipeline and Forecast In SAP BPC, BW & BOBJ 9. Click on ‘Finish’ 10. Click on ‘OK’ Prepared and Presented Not for Distribution. Solution Designed , Architected and Developed Jothi Periasamy (Joesaran@Gmail.com) BY Phone : (916)-296-0228 Jothi Periasamy (Joesaran@Gmail.com)
- 43. Enterprise Dashboard - Sales Plan , Pipeline and Forecast In SAP BPC, BW & BOBJ 11. Click on ‘View Status’. 12. Click on ‘Details’. Prepared and Presented Not for Distribution. Solution Designed , Architected and Developed Jothi Periasamy (Joesaran@Gmail.com) BY Phone : (916)-296-0228 Jothi Periasamy (Joesaran@Gmail.com)
- 44. Enterprise Dashboard - Sales Plan , Pipeline and Forecast In SAP BPC, BW & BOBJ Prepared and Presented Not for Distribution. Solution Designed , Architected and Developed Jothi Periasamy (Joesaran@Gmail.com) BY Phone : (916)-296-0228 Jothi Periasamy (Joesaran@Gmail.com)
- 45. Enterprise Dashboard - Sales Plan, Pipeline and Forecast In SAP BPC, BW & BOBJ 1. Choose “Manage Data”. 2. Upload Data file for SalesPlanData. 3. Give the Source and Destination file. 4. Click ‘OK’ Prepared and Presented Not for Distribution. Solution Designed , Architected and Developed Jothi Periasamy (Joesaran@Gmail.com) BY Phone : (916)-296-0228 Jothi Periasamy (Joesaran@Gmail.com)
- 46. Enterprise Dashboard - Sales Plan, Pipeline and Forecast In SAP BPC, BW & BOBJ 5. Run Data Management Package. 6. Select Import Transaction Data and click on Run. Prepared and Presented Not for Distribution. Solution Designed , Architected and Developed Jothi Periasamy (Joesaran@Gmail.com) BY Phone : (916)-296-0228 Jothi Periasamy (Joesaran@Gmail.com)
- 47. Enterprise Dashboard - Sales Plan, Pipeline and Forecast In SAP BPC, BW & BOBJ 7. Select Import File and click on Next. Prepared and Presented Not for Distribution. Solution Designed , Architected and Developed Jothi Periasamy (Joesaran@Gmail.com) BY Phone : (916)-296-0228 Jothi Periasamy (Joesaran@Gmail.com)
- 48. Enterprise Dashboard - Sales Plan, Pipeline and Forecast In SAP BPC, BW & BOBJ 8. Click on ‘Finish’ 9. Click on ‘OK’ Prepared and Presented Not for Distribution. Solution Designed , Architected and Developed Jothi Periasamy (Joesaran@Gmail.com) BY Phone : (916)-296-0228 Jothi Periasamy (Joesaran@Gmail.com)
- 49. Enterprise Dashboard - Sales Plan, Pipeline and Forecast In SAP BPC, BW & BOBJ 10. Click on ‘View Status’. 11. Click on ‘Details’. Prepared and Presented Not for Distribution. Solution Designed , Architected and Developed Jothi Periasamy (Joesaran@Gmail.com) BY Phone : (916)-296-0228 Jothi Periasamy (Joesaran@Gmail.com)
- 50. Enterprise Dashboard - Sales Plan, Pipeline and Forecast In SAP BPC, BW & BOBJ Prepared and Presented Not for Distribution. Solution Designed , Architected and Developed Jothi Periasamy (Joesaran@Gmail.com) BY Phone : (916)-296-0228 Jothi Periasamy (Joesaran@Gmail.com)
- 51. Enterprise Dashboard - Sales Plan, Pipeline and Forecast In SAP BPC, BW & BOBJ 1. Choose “Manage Data”. 2. Upload Data file for SalesPlanData. 3. Give the Source and Destination file. 4. Click ‘OK’ Prepared and Presented Not for Distribution. Solution Designed , Architected and Developed Jothi Periasamy (Joesaran@Gmail.com) BY Phone : (916)-296-0228 Jothi Periasamy (Joesaran@Gmail.com)
- 52. Enterprise Dashboard - Sales Plan, Pipeline and Forecast In SAP BPC, BW & BOBJ 5. Run Data Management Package. 6. Select Import Transaction Data and click on Run. Prepared and Presented Not for Distribution. Solution Designed , Architected and Developed Jothi Periasamy (Joesaran@Gmail.com) BY Phone : (916)-296-0228 Jothi Periasamy (Joesaran@Gmail.com)
- 53. Enterprise Dashboard - Sales Plan, Pipeline and Forecast In SAP BPC, BW & BOBJ 7. Select Import File and click on Next. Prepared and Presented Not for Distribution. Solution Designed , Architected and Developed Jothi Periasamy (Joesaran@Gmail.com) BY Phone : (916)-296-0228 Jothi Periasamy (Joesaran@Gmail.com)
- 54. Enterprise Dashboard - Sales Plan, Pipeline and Forecast In SAP BPC, BW & BOBJ 8. Click on ‘Finish’ 9. Click on ‘OK’ Prepared and Presented Not for Distribution. Solution Designed , Architected and Developed Jothi Periasamy (Joesaran@Gmail.com) BY Phone : (916)-296-0228 Jothi Periasamy (Joesaran@Gmail.com)
- 55. Enterprise Dashboard - Sales Plan, Pipeline and Forecast In SAP BPC, BW & BOBJ 10. Click on ‘View Status’. 11. Click on ‘Details’. Prepared and Presented Not for Distribution. Solution Designed , Architected and Developed Jothi Periasamy (Joesaran@Gmail.com) BY Phone : (916)-296-0228 Jothi Periasamy (Joesaran@Gmail.com)
- 56. Enterprise Dashboard - Sales Plan, Pipeline and Forecast In SAP BPC, BW & BOBJ Prepared and Presented Not for Distribution. Solution Designed , Architected and Developed Jothi Periasamy (Joesaran@Gmail.com) BY Phone : (916)-296-0228 Jothi Periasamy (Joesaran@Gmail.com)
- 57. Enterprise Dashboard - Sales Plan, Pipeline and Forecast In SAP BPC, BW & BOBJ 1. Change the Current View. 2. Choose Data Input. 3. Choose Blank Work Book Prepared and Presented Not for Distribution. Solution Designed , Architected and Developed Jothi Periasamy (Joesaran@Gmail.com) BY Phone : (916)-296-0228 Jothi Periasamy (Joesaran@Gmail.com)
- 58. Enterprise Dashboard - Sales Plan, Pipeline and Forecast In SAP BPC, BW & BOBJ Prepared and Presented Not for Distribution. Solution Designed , Architected and Developed Jothi Periasamy (Joesaran@Gmail.com) BY Phone : (916)-296-0228 Jothi Periasamy (Joesaran@Gmail.com)
- 59. Enterprise Dashboard - Sales Plan, Pipeline and Forecast In SAP BPC, BW & BOBJ Prepared and Presented Not for Distribution. Solution Designed , Architected and Developed Jothi Periasamy (Joesaran@Gmail.com) BY Phone : (916)-296-0228 Jothi Periasamy (Joesaran@Gmail.com)
- 60. Enterprise Dashboard - Sales Plan, Pipeline and Forecast In SAP BPC, BW & BOBJ The Step By Step Solution – Building an Xcelsius Dashboard Xcelsius Dashboard Creation –Adding the BPC Data Grid and Using Live SAP BPC Data 1. Launch Xcelsius 2. Choose “File -> Data -> Import Prepared and Presented Not for Distribution. Solution Designed , Architected and Developed Jothi Periasamy (Joesaran@Gmail.com) BY Phone : (916)-296-0228 Jothi Periasamy (Joesaran@Gmail.com)
- 61. Enterprise Dashboard - Sales Plan, Pipeline and Forecast In SAP BPC, BW & BOBJ 3. Choose the “Sales.xls” file Prepared and Presented Not for Distribution. Solution Designed , Architected and Developed Jothi Periasamy (Joesaran@Gmail.com) BY Phone : (916)-296-0228 Jothi Periasamy (Joesaran@Gmail.com)
- 62. Enterprise Dashboard - Sales Plan, Pipeline and Forecast In SAP BPC, BW & BOBJ 4. Place a filter component on the canvas. Prepared and Presented Not for Distribution. Solution Designed , Architected and Developed Jothi Periasamy (Joesaran@Gmail.com) BY Phone : (916)-296-0228 Jothi Periasamy (Joesaran@Gmail.com)
- 63. Enterprise Dashboard - Sales Plan, Pipeline and Forecast In SAP BPC, BW & BOBJ 5. Double-click the filter component to open the Properties panel. Prepared and Presented Not for Distribution. Solution Designed , Architected and Developed Jothi Periasamy (Joesaran@Gmail.com) BY Phone : (916)-296-0228 Jothi Periasamy (Joesaran@Gmail.com)
- 64. Enterprise Dashboard - Sales Plan, Pipeline and Forecast In SAP BPC, BW & BOBJ 6. Click the Source Data cell selector button and select all the data to be included in the visualization. Prepared and Presented Not for Distribution. Solution Designed , Architected and Developed Jothi Periasamy (Joesaran@Gmail.com) BY Phone : (916)-296-0228 Jothi Periasamy (Joesaran@Gmail.com)
- 65. Enterprise Dashboard - Sales Plan, Pipeline and Forecast In SAP BPC, BW & BOBJ 7. Click the Destination cell selector button and select an empty range of cells in a row. The range must be large enough to display a full row of chart data. Prepared and Presented Not for Distribution. Solution Designed , Architected and Developed Jothi Periasamy (Joesaran@Gmail.com) BY Phone : (916)-296-0228 Jothi Periasamy (Joesaran@Gmail.com)
- 66. Enterprise Dashboard - Sales Plan, Pipeline and Forecast In SAP BPC, BW & BOBJ 8. Adjust the value in the Number of Filters box. Prepared and Presented Not for Distribution. Solution Designed , Architected and Developed Jothi Periasamy (Joesaran@Gmail.com) BY Phone : (916)-296-0228 Jothi Periasamy (Joesaran@Gmail.com)
- 67. Enterprise Dashboard - Sales Plan, Pipeline and Forecast In SAP BPC, BW & BOBJ 9. Click the Title cell selector button and select the labels that will appear above each Combo Box. Prepared and Presented Not for Distribution. Solution Designed , Architected and Developed Jothi Periasamy (Joesaran@Gmail.com) BY Phone : (916)-296-0228 Jothi Periasamy (Joesaran@Gmail.com)
- 68. Enterprise Dashboard - Sales Plan, Pipeline and Forecast In SAP BPC, BW & BOBJ 10. Place a Bar Chart component on the canvas. Prepared and Presented Not for Distribution. Solution Designed , Architected and Developed Jothi Periasamy (Joesaran@Gmail.com) BY Phone : (916)-296-0228 Jothi Periasamy (Joesaran@Gmail.com)
- 69. Enterprise Dashboard - Sales Plan, Pipeline and Forecast In SAP BPC, BW & BOBJ 11. Click Data by Series click the plus button to add a series to the list box. 12. Click the Values (X) cell selector button and select the range of empty cells that are selected for the Destination range for the Filter component. Prepared and Presented Not for Distribution. Solution Designed , Architected and Developed Jothi Periasamy (Joesaran@Gmail.com) BY Phone : (916)-296-0228 Jothi Periasamy (Joesaran@Gmail.com)
- 70. Enterprise Dashboard - Sales Plan, Pipeline and Forecast In SAP BPC, BW & BOBJ 13. Click the Category Labels (Y) cell selector button to select the cells in the spreadsheet that contain the chart data column headers. Prepared and Presented Not for Distribution. Solution Designed , Architected and Developed Jothi Periasamy (Joesaran@Gmail.com) BY Phone : (916)-296-0228 Jothi Periasamy (Joesaran@Gmail.com)
- 71. Enterprise Dashboard - Sales Plan, Pipeline and Forecast In SAP BPC, BW & BOBJ 14. Click the Preview button to view the interaction between the Filter and Bar Chart components. The Sales data displayed in the Bar Chart will update depending on the selections made in the Combo Boxes of the Filter Component. Prepared and Presented Not for Distribution. Solution Designed , Architected and Developed Jothi Periasamy (Joesaran@Gmail.com) BY Phone : (916)-296-0228 Jothi Periasamy (Joesaran@Gmail.com)
- 72. Enterprise Dashboard - Sales Plan, Pipeline and Forecast In SAP BPC, BW & BOBJ 15. Place a Line Chart component on the canvas. Prepared and Presented Not for Distribution. Solution Designed , Architected and Developed Jothi Periasamy (Joesaran@Gmail.com) BY Phone : (916)-296-0228 Jothi Periasamy (Joesaran@Gmail.com)
- 73. Enterprise Dashboard - Sales Plan, Pipeline and Forecast In SAP BPC, BW & BOBJ 16. Click Data by Series click the plus button to add a series to the list box. Prepared and Presented Not for Distribution. Solution Designed , Architected and Developed Jothi Periasamy (Joesaran@Gmail.com) BY Phone : (916)-296-0228 Jothi Periasamy (Joesaran@Gmail.com)
- 74. Enterprise Dashboard - Sales Plan, Pipeline and Forecast In SAP BPC, BW & BOBJ 17. Click the Values (X) cell selector button and select the range of empty cells that are selected for the Destination range for the Filter component. Prepared and Presented Not for Distribution. Solution Designed , Architected and Developed Jothi Periasamy (Joesaran@Gmail.com) BY Phone : (916)-296-0228 Jothi Periasamy (Joesaran@Gmail.com)
- 75. Enterprise Dashboard - Sales Plan, Pipeline and Forecast In SAP BPC, BW & BOBJ 18. Click the Category Labels (Y) cell selector button to select the cells in the spreadsheet that contain the chart data column headers. Prepared and Presented Not for Distribution. Solution Designed , Architected and Developed Jothi Periasamy (Joesaran@Gmail.com) BY Phone : (916)-296-0228 Jothi Periasamy (Joesaran@Gmail.com)
- 76. Enterprise Dashboard - Sales Plan, Pipeline and Forecast In SAP BPC, BW & BOBJ 19. Click the Preview button to view the interaction between the Filter and Line Chart components. The Sales data displayed in the Line Chart will update depending on the selections made in the Combo Boxes of the Filter Component. Prepared and Presented Not for Distribution. Solution Designed , Architected and Developed Jothi Periasamy (Joesaran@Gmail.com) BY Phone : (916)-296-0228 Jothi Periasamy (Joesaran@Gmail.com)
- 77. Enterprise Dashboard - Sales Plan, Pipeline and Forecast In SAP BPC, BW & BOBJ 20. Place a Combination Chart component on the canvas. Prepared and Presented Not for Distribution. Solution Designed , Architected and Developed Jothi Periasamy (Joesaran@Gmail.com) BY Phone : (916)-296-0228 Jothi Periasamy (Joesaran@Gmail.com)
- 78. Enterprise Dashboard - Sales Plan, Pipeline and Forecast In SAP BPC, BW & BOBJ 21. Double-click the Combination Chart to open the Properties panel. Prepared and Presented Not for Distribution. Solution Designed , Architected and Developed Jothi Periasamy (Joesaran@Gmail.com) BY Phone : (916)-296-0228 Jothi Periasamy (Joesaran@Gmail.com)
- 79. Enterprise Dashboard - Sales Plan, Pipeline and Forecast In SAP BPC, BW & BOBJ 22. In the Chart box, type "Sales Trend Analysis". Prepared and Presented Not for Distribution. Solution Designed , Architected and Developed Jothi Periasamy (Joesaran@Gmail.com) BY Phone : (916)-296-0228 Jothi Periasamy (Joesaran@Gmail.com)
- 80. Enterprise Dashboard - Sales Plan, Pipeline and Forecast In SAP BPC, BW & BOBJ 23. Click Data by Series; click the plus button to add a series to the list box. In the Name box, type “Sales". 24. Click the Values (Y) cell selector button and select the Source Data for this series. Select the data under the column header “Sales". Prepared and Presented Not for Distribution. Solution Designed , Architected and Developed Jothi Periasamy (Joesaran@Gmail.com) BY Phone : (916)-296-0228 Jothi Periasamy (Joesaran@Gmail.com)
- 81. Enterprise Dashboard - Sales Plan, Pipeline and Forecast In SAP BPC, BW & BOBJ 25. Click the Category Labels (X) cell selector button and select the data Labels. 26. Click the plus button to add another series to the list box. In the Name box, type "Trend". Prepared and Presented Not for Distribution. Solution Designed , Architected and Developed Jothi Periasamy (Joesaran@Gmail.com) BY Phone : (916)-296-0228 Jothi Periasamy (Joesaran@Gmail.com)
- 82. Enterprise Dashboard - Sales Plan, Pipeline and Forecast In SAP BPC, BW & BOBJ 27. Click the Values (Y) cell selector button and select the Source Data for this series Prepared and Presented Not for Distribution. Solution Designed , Architected and Developed Jothi Periasamy (Joesaran@Gmail.com) BY Phone : (916)-296-0228 Jothi Periasamy (Joesaran@Gmail.com)
- 83. Enterprise Dashboard - Sales Plan, Pipeline and Forecast In SAP BPC, BW & BOBJ 28. Click the Appearance tab, click the Series sub-tab. For the series “Sales" click the Type dropdown menu and select Column. For the series "Trend" click the Type dropdown menu and select Line. Solutions Developed Solutions Design and Architecture Technology Used BY BY Xcelsius Smitha Sunkavallii | smithasunkavalli@gmail.com Jothi Periasamy (Joesaran@Gmail.com) SAP BPC NW 7.5 |JoeSaran@gmail.com| 916-296-0228
- 84. Enterprise Dashboard - Sales Plan, Pipeline and Forecast In SAP BPC, BW & BOBJ 29. Place a Trend Analyzer component on the canvas. Prepared and Presented Not for Distribution. Solution Designed , Architected and Developed Jothi Periasamy (Joesaran@Gmail.com) BY Phone : (916)-296-0228 Jothi Periasamy (Joesaran@Gmail.com)
- 85. Enterprise Dashboard - Sales Plan, Pipeline and Forecast In SAP BPC, BW & BOBJ 30. Click the Trend Analyzer to open its Properties panel. 31. Click the Data cell selector button and select the data to be analyzed for trending; for this, select the data under the column header “Sales". Prepared and Presented Not for Distribution. Solution Designed , Architected and Developed Jothi Periasamy (Joesaran@Gmail.com) BY Phone : (916)-296-0228 Jothi Periasamy (Joesaran@Gmail.com)
- 86. Enterprise Dashboard - Sales Plan, Pipeline and Forecast In SAP BPC, BW & BOBJ 32. In the Trend/Regression Type section, click the Use Best Fit radio button. 33. Click the Analyzed Data Destination cell selector button and select an empty range of cells for the new data series to be inserted into; for this, select the empty cells under the column header “Trend Data". Prepared and Presented Not for Distribution. Solution Designed , Architected and Developed Jothi Periasamy (Joesaran@Gmail.com) BY Phone : (916)-296-0228 Jothi Periasamy (Joesaran@Gmail.com)
- 87. Enterprise Dashboard - Sales Plan, Pipeline and Forecast In SAP BPC, BW & BOBJ 34. Click Preview to view the between the Combination Chart component displayed with a trend line. The Trend Analyzer component analyzes the selected data and determines a the best way to display a trend line for the data. Prepared and Presented Not for Distribution. Solution Designed , Architected and Developed Jothi Periasamy (Joesaran@Gmail.com) BY Phone : (916)-296-0228 Jothi Periasamy (Joesaran@Gmail.com)
- 88. Enterprise Dashboard - Sales Plan, Pipeline and Forecast In SAP BPC, BW & BOBJ 35. Place the Pie Chart object under Charts folder to chart area. Prepared and Presented Not for Distribution. Solution Designed , Architected and Developed Jothi Periasamy (Joesaran@Gmail.com) BY Phone : (916)-296-0228 Jothi Periasamy (Joesaran@Gmail.com)
- 89. Enterprise Dashboard - Sales Plan, Pipeline and Forecast In SAP BPC, BW & BOBJ 36. Double-click the Pie Chart to open the Properties panel. Prepared and Presented Not for Distribution. Solution Designed , Architected and Developed Jothi Periasamy (Joesaran@Gmail.com) BY Phone : (916)-296-0228 Jothi Periasamy (Joesaran@Gmail.com)
- 90. Enterprise Dashboard - Sales Plan, Pipeline and Forecast In SAP BPC, BW & BOBJ 37. Under Data -> Values 38. Specify the values Under Labels Prepared and Presented Not for Distribution. Solution Designed , Architected and Developed Jothi Periasamy (Joesaran@Gmail.com) BY Phone : (916)-296-0228 Jothi Periasamy (Joesaran@Gmail.com)
- 91. Enterprise Dashboard - Sales Plan, Pipeline and Forecast In SAP BPC, BW & BOBJ 39. Click Preview to view the Pie Chart. The Sales data displayed in the Pie Chart will update depending on the selections made in the Combo Boxes of the Filter Component. Prepared and Presented Not for Distribution. Solution Designed , Architected and Developed Jothi Periasamy (Joesaran@Gmail.com) BY Phone : (916)-296-0228 Jothi Periasamy (Joesaran@Gmail.com)
- 92. Enterprise Dashboard - Sales Plan, Pipeline and Forecast In SAP BPC, BW & BOBJ 40. In the Components browser, select a Label component Prepared and Presented Not for Distribution. Solution Designed , Architected and Developed Jothi Periasamy (Joesaran@Gmail.com) BY Phone : (916)-296-0228 Jothi Periasamy (Joesaran@Gmail.com)
- 93. Enterprise Dashboard - Sales Plan, Pipeline and Forecast In SAP BPC, BW & BOBJ 41. Select the Label, click Enter Text. Type or paste any block of text into the box. Prepared and Presented Not for Distribution. Solution Designed , Architected and Developed Jothi Periasamy (Joesaran@Gmail.com) BY Phone : (916)-296-0228 Jothi Periasamy (Joesaran@Gmail.com)
- 94. Enterprise Dashboard - Sales Plan, Pipeline and Forecast In SAP BPC, BW & BOBJ 42. Click Preview to view Prepared and Presented Not for Distribution. Solution Designed , Architected and Developed Jothi Periasamy (Joesaran@Gmail.com) BY Phone : (916)-296-0228 Jothi Periasamy (Joesaran@Gmail.com)
- 95. Enterprise Dashboard - Sales Plan, Pipeline and Forecast In SAP BPC, BW & BOBJ 43. We will be publishing this dashboard as a flash (swf) file in BPC web. Export this as Flash file. (Click on File -> Export -> Flash (SWF)) 44. Choose the desired location and file name. Click on save. Prepared and Presented Not for Distribution. Solution Designed , Architected and Developed Jothi Periasamy (Joesaran@Gmail.com) BY Phone : (916)-296-0228 Jothi Periasamy (Joesaran@Gmail.com)
- 96. Enterprise Dashboard - Sales Plan, Pipeline and Forecast In SAP BPC, BW & BOBJ Publish the dashboard in BPC Content Library 1. Go to BPC Web 2. Click on “Content Library” from the action pane. 3. Click on “Post Document” from the action pane. 4. Click Browse. Prepared and Presented Not for Distribution. Solution Designed , Architected and Developed Jothi Periasamy (Joesaran@Gmail.com) BY Phone : (916)-296-0228 Jothi Periasamy (Joesaran@Gmail.com)
- 97. Enterprise Dashboard - Sales Plan, Pipeline and Forecast In SAP BPC, BW & BOBJ 5. Choose the “Sales.swf” that we created from Xcelsius. 6. Click the green check. Prepared and Presented Not for Distribution. Solution Designed , Architected and Developed Jothi Periasamy (Joesaran@Gmail.com) BY Phone : (916)-296-0228 Jothi Periasamy (Joesaran@Gmail.com)
- 98. Enterprise Dashboard - Sales Plan, Pipeline and Forecast In SAP BPC, BW & BOBJ 7. Choose the users and Teams you want to grant access to. In this case, we chose “All Users”. Click the green check. 8. Click the green check. Prepared and Presented Not for Distribution. Solution Designed , Architected and Developed Jothi Periasamy (Joesaran@Gmail.com) BY Phone : (916)-296-0228 Jothi Periasamy (Joesaran@Gmail.com)
- 99. Enterprise Dashboard - Sales Plan, Pipeline and Forecast In SAP BPC, BW & BOBJ 9. Click the green check. 10. Select Application and Click the green check. Prepared and Presented Not for Distribution. Solution Designed , Architected and Developed Jothi Periasamy (Joesaran@Gmail.com) BY Phone : (916)-296-0228 Jothi Periasamy (Joesaran@Gmail.com)
- 100. Enterprise Dashboard - Sales Plan, Pipeline and Forecast In SAP BPC, BW & BOBJ Prepared and Presented Not for Distribution. Solution Designed , Architected and Developed Jothi Periasamy (Joesaran@Gmail.com) BY Phone : (916)-296-0228 Jothi Periasamy (Joesaran@Gmail.com)