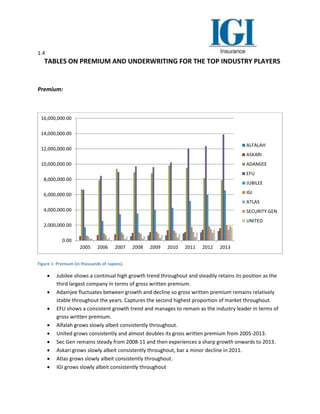
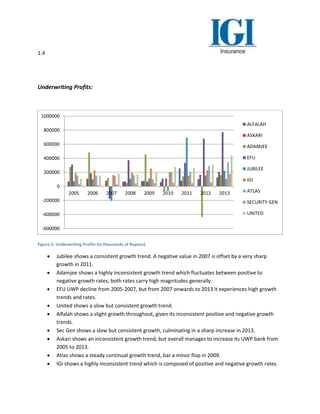
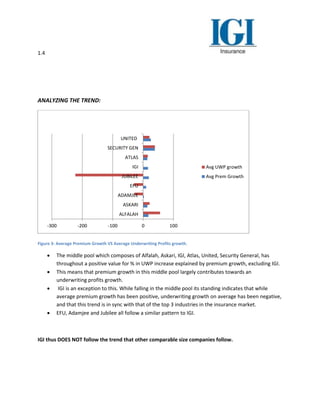
2. CONTENTS:
1 Section 1 – IGI’s Standing in the Insurance Market of Pakistan.
Introduction…………………………………………………………………………………………………………………………. 1.1
Methods of Compiling and Processing of Data……………………………………………………………………… 1.2
Techniques of Analysis………………………………………………………………………………………………………….. 1.3
Premiums and Underwriting of market…………………………………………………………………………………. 1.4
Analysis…………………………………………………………………………………………………………………………………. 1.5
Conclusion on Risk Analysis……………………………………………………………………………………………………. 1.6
2 Section 2- Fire Industry Segregation Based on Profitability and Risk.
Methods of Compiling and Techniques of Analysis…………………………………………………………………. 2.1
Premiums and Loss Ratios of Industries………………………………………………………………………………….. 2.2
Analysis and Segregation…………………………………………………………………………………………………………. 2.3
4. INTRODUCTION:
The purpose of this report is to give IGI a clear understanding of its market position in terms of
profitability. This analysis report aims to give a profile of each company which can be classified as a
market leader in the insurance industry, and compare these companies in terms of profitability.
The factors we will be looking at in depth are Underwriting Profits and Gross Premium Written. The
relationship between the two will be examined in detail for each company. In addition, the effect of Net
Claims, Net Commissions and the Fire and Marine portfolio sector of Gross Premium, on Underwriting
Profits will also be analyzed. This will help us assess the risk approach taken by each company towards
its Underwriting Profits (UWP) bank.
In the second section of the report, a segregation of industries in the Fire & Engineering industry will be
carried out based on profitability. An analysis of Premium Written and Loss Ratios of the industries is
carried out, and then industries are classified according to how risky they are.
Basically, our aim is to link both sections to find out that if IGI’s Fire Premium bank is currently
increasing its Underwriting Profits, as well as showcasing which industries within Fire & Engineering IGI
can target to increase Underwriting results, and profitability in general.
5. 1.2
Methods of Compiling and Processing of Data:
The top nine companies in the general insurance industry of Pakistan were considered for
purpose of this report; these are Adamjee, EFU, National Jubilee, IGI, Atlas, Alfalah, Askari,
United and Security General. These are further classified into comparable size pools with EFU,
Adamjee and National Jubilee comprising the largest pool, and the rest of them, IGI, Atlas,
Askari, Alfalah, United and Security General comprising the middle pool.
IAP statistical data from the official IAP website was used to collect data from 2005-2013
inclusive. This gave us company and year wise premium, net claims, net commissions,
management expenses and underwriting results values.
Annual reports of each company from their respective websites were looked at to collect
industry wise premium breakdown i.e how much fire premium, marine premium, motor
premium and miscellaneous premium did each company write.
A congruent approach was taken to collect industry wise net claims breakdown.
This gave us the portfolio management of each company in the industry.
This data was then represented graphically. A year wise, company specific multiple bar-chart
was made which accurately represented the change in premium from 2005-2013 for each
company in industry, in addition to giving us a premium growth trend for each.
Similarly, a year wise, company specific multiple bar-chart was made which represented the
change in Underwriting Profits from 2005-2013 for each company in industry, in addition to
giving us an underwriting profits’ growth trend for each company.
Portfolio management of each company is then presented through a pie chart for each
company. An averaged value of sector wise premiums over the past seven years (2008-13) was
taken for each sector (fire, marine, motor and miscellaneous) and represented in the form of a
pie chart. This is done for each company to give us a snapshot of the portfolio management
trends and policies of each company relative to the others.
An exactly similar approach is taken for net claims, and once again a pie chart for each company
is made. Sector contributions to the total claims amount for each company can be seen through
these pie charts.
The next major step is that of regression analysis. In the construction of our linear model,
underwriting profits is the dependent variable or “regressor,” while premium, further broken
into fire premium and marine premium in a simultaneous and separate regression model, net
claims and net commissions are the independent variables or “predictors.” However, a
6. 1.2
paramount limitation in our model is that of multicollinearity; the independent variables are
highly correlated and possess a very high covariance. Hence, we are unable to regress the
impact of one variable on the regressor in a MULTIPLE regression model. For this purpose, we
carry out Principal Component Analysis, which allows us to regress the impact of each
independent variable on our regressor individually in a simple linear regression model. This
process is carried out for each of the nine companies. We can then analyze the impact of each
independent variable on the underwriting profits of each company, and compare accordingly to
other companies in the same comparable size pool.
The regression results of each company can then be compared to the underwriting profits of
each company, and a conclusion can be reached on how effective risk management of that
particular company is. A company wise comparative view can easily be deduced through this
and this is the end result of the analysis (Hypothesis testing phase).
Note that National Jubilee Insurance data could not be found and hence it was excluded from
the regression analysis.
7. 1.3
TECHNIQUES OF ANALYSIS:
Microsoft Excel was used to convert the data into meaningful tables, figures, charts and other graphs.
The add-in feature was used to activate the data analysis feature of Excel, and this enabled me to carry
out regression on Microsoft Excel only.
Bar charts on premium and underwriting profits were produced directly from the raw data tables with
no manipulation. For the portfolio mix pie charts however, I had to take a 7 year average of the data and
then put it into single values by sector/industry(Fire, Marine, Motor and Miscellaneous and All) so we
can get a snapshot of how much each company captures sector-wise .
Regression on Excel was efficient since data tables were already prepared on Excel. Transferring
information was thus easier. Also, all I was looking to do with regression was to find out the significance
of each variable, goodness of fit of the regression models as well as the standard errors, intercepts and
ANOVA tables, all of which Excel aptly calculated.
The regression model is as follows:
Y = B0 + B1X1 + B2X2+ B3X3+ B4X4+ B5X5
Y, which is Underwriting Profits, is the dependent variable.
B0 is the intercept coefficient.
B1 is the coefficient of X1, which represents Gross Premium Written, referred to as simply
premium in this analysis.
B2 is the coefficient of X2, which represents Net Claims.
B3 is the coefficient of X3, which represent Net Commissions.
B4 is the coefficient of X4, which represents Fire Premium Written.
B5 is the coefficient of X5, which represents Marine Premium Written.
This multiple regression model was run for each company included in this report. When results were
looked at, a couple of problems were witnessed in the model leading to statistical inaccuracies, the main
one being:
Multicollinearity. The independent variables were highly correlated and had high covariance,
greatly hindering the accuracy of our model.
In order to sort the problem of multicollinearity out, I had to run Principal Component Analysis which
states that the correlated variables have to be divided into groups of uncorrelated variables and then
regression has to be carried to isolate the impact of one group of uncorrelated variables on the
dependent variable, from the other. In our case the groups of uncorrelated variables are the single
variables individually since all of them are correlated with each other. Hence our model now composed
of:
8. 1.3
Y = B0 + B1X1, Y = B0 + B2X2, Y = B0 + B3X3, Y= B0 + B4X4, Y = B0 + B5X5
Y, which is Underwriting Profits, is the dependent variable.
B0 is the intercept coefficient.
B1 is the coefficient of X1, which represents Gross Premium Written, referred to as simply
premium in this analysis.
B2 is the coefficient of X2, which represents Net Claims.
B3 is the coefficient of X3, which represent Net Commissions.
B4 is the coefficient of X4, which represents Fire Premium Written.
B5 is the coefficient of X5, which represents Marine Premium Written.
I did regression for each variable above, so that one company’s regression analysis composes of five sub-
regression models. In doing so, I could eliminate the problem of multicollinearity and see how each
variable affects the dependent variable (UWP).
Analyzing the regression.
Each variable’s significance then had to be determined through the regression results. I then used the
generic significance classifications to set the significant cut-off to 10%; in simple words, if the probability
of the variable NOT being significant was exceeding 10%, I would eliminate it as being a significant
variable.
The main purpose of our regression was to find out which variable significantly affects our Underwriting
Profits and which one does not. A company profile could be created based in this, and its risk
diversification assessed depending on how many variables affected that particular company’s
Underwriting Profits.
In profiling, I created a table in which only the p-value, t-value, standard error and coefficients were
contained as these are the only important results needed to comment on the significance of a variable.
All of the models are assumed as fit in goodness of fit judgments since all are a known component of the
Underwriting Profits calculation formula (All R-squared values agree with this assumption; see
appendix).
Linking regression with company premium portfolio.
One of the primary aims of analysis is to look at the fire sector of each company and assess industry
profits based on this sector. So, I compared the significance of Fire Premium on UWP for each company
and linked Fire Premium to the profitability of the company in this way.
This link will also help us establish how to improve IGI’s profitability in the Fire & Engineering industry in
the latter stages of this report (Section 2).
9. 1.3
Risk Assessment.
In the analysis I have classified companies on the basis of their risk diversification. The classifications are
not good, good and very good. A company whose UWP do not significantly depend on any one factor
cannot focus on one variable to improve its UWP and has to improve all variables to improve its UWP by
a margin that a good or very good company can cover with just influencing one variable.
The ratings thus depend on how many variables significantly affect a company’s UWP. Good or very
good risk diversification implies that risk has been transferred to many variables instead of just one or
two, or as in the case of IGI, none.
10. 1.4
TABLES ON PREMIUM AND UNDERWRITING FOR THE TOP INDUSTRY PLAYERS
Premium:
Figure 1: Premium (in thousands of rupees).
Jubilee shows a continual high growth trend throughout and steadily retains its position as the
third largest company in terms of gross written premium.
Adamjee fluctuates between growth and decline so gross written premium remains relatively
stable throughout the years. Captures the second highest proportion of market throughout.
EFU shows a consistent growth trend and manages to remain as the industry leader in terms of
gross written premium.
Alfalah grows slowly albeit consistently throughout.
United grows consistently and almost doubles its gross written premium from 2005-2013.
Sec Gen remains steady from 2008-11 and then experiences a sharp growth onwards to 2013.
Askari grows slowly albeit consistently throughout, bar a minor decline in 2011.
Atlas grows slowly albeit consistently throughout.
IGI grows slowly albeit consistently throughout
0.00
2,000,000.00
4,000,000.00
6,000,000.00
8,000,000.00
10,000,000.00
12,000,000.00
14,000,000.00
16,000,000.00
2005 2006 2007 2008 2009 2010 2011 2012 2013
ALFALAH
ASKARI
ADAMJEE
EFU
JUBILEE
IGI
ATLAS
SECURITY GEN
UNITED
11. 1.4
Underwriting Profits:
Figure 2- Underwriting Profits (In thousands of Rupees).
Jubilee shows a consistent growth trend. A negative value in 2007 is offset by a very sharp
growth in 2011.
Adamjee shows a highly inconsistent growth trend which fluctuates between positive to
negative growth rates; both rates carry high magnitudes generally.
EFU UWP decline from 2005-2007, but from 2007 onwards to 2013 it experiences high growth
trends and rates.
United shows a slow but consistent growth trend.
Alfalah shows a slight growth throughout, given its inconsistent positive and negative growth
trends.
Sec Gen shows a slow but consistent growth, culminating in a sharp increase in 2013.
Askari shows an inconsistent growth trend, but overall manages to increase its UWP bank from
2005 to 2013.
Atlas shows a steady continual growth trend, bar a minor flop in 2009.
IGI shows a highly inconsistent trend which is composed of positive and negative growth rates.
-600000
-400000
-200000
0
200000
400000
600000
800000
1000000
2005 2006 2007 2008 2009 2010 2011 2012 2013
ALFALAH
ASKARI
ADAMJEE
EFU
JUBILEE
IGI
ATLAS
SECURITY GEN
UNITED
12. 1.4
ANALYZING THE TREND:
Figure 3- Average Premium Growth VS Average Underwriting Profits growth.
The middle pool which composes of Alfalah, Askari, IGI, Atlas, United, Security General, has
throughout a positive value for % in UWP increase explained by premium growth, excluding IGI.
This means that premium growth in this middle pool largely contributes towards an
underwriting profits growth.
IGI is an exception to this. While falling in the middle pool its standing indicates that while
average premium growth has been positive, underwriting growth on average has been negative,
and that this trend is in sync with that of the top 3 industries in the insurance market.
EFU, Adamjee and Jubilee all follow a similar pattern to IGI.
IGI thus DOES NOT follow the trend that other comparable size companies follow.
-300 -200 -100 0 100
ALFALAH
ASKARI
ADAMJEE
EFU
JUBILEE
IGI
ATLAS
SECURITY GEN
UNITED
Avg UWP growth
Avg Prem Growth
13. 1.5
Note: A significant variable is one which has either a positive or negative effective impact on
underwriting profits (dependent variable).
ALFALAH:
Coefficient
Standard
error t Stat P-value
Premium 0.090018873 0.014914697 6.035581926 0.003799261
Net Claims 0.485277134 0.178889708 2.712716901 0.053387091
Net
Commissions
-
0.194906487 0.108550203 -1.79554235 0.146999013
Fire Premium 0.072106627 0.126592969 0.569594248 0.599416503
Marine
Premium 0.257193369 0.126789173 2.02851207 0.11240289
Premium and Net Claims lie within 5% significance levels, so are significantly affecting
underwriting profits.
Marine, Fire and Net Commissions lie above 10% significance levels so may be considered not
significant.
Now, looking at the portfolio management of Alfalah:
Less data available. (Accuracy check)
UWP bank relies on Premium, within which Fire and Marine are not significant, and Net Claims.
This tells us that increase in premium effectively increases UWP, while more net claims
effectively decrease UWP.
Fire, which accounts for 30-35 % of the portfolio mix is not a significant variable. We can deduce
that Fire Premium Written is not profitable for Alfalah, although premium as a whole is adding
to Alfalah’s underwriting profitability.
This is good risk diversification.
ALFALAH
Fire
Marine
Motor
Misc and All
14. 1.5
Note: A significant variable is one which has either a positive or negative effective impact on
underwriting profits (dependent variable).
ASKARI:
Coefficients
Standard
Error t Stat P-value
Premium 0.111173088 0.033527544 3.315873304 0.01283756
Net Claims 0.08798303 0.227552792 0.38664887 0.710501034
Net Commissions
-
0.890067089 0.25081711 -3.548669747 0.009360415
Fire Premium 0.812966291 0.245174518 3.315867805 0.012837657
Marine Premium 1.419494858 0.427733077 3.318646453 0.012788768
Premium, fire and marine have within 2% significance levels and are significant.
Net Commissions and Net Claims are above 10 % significance level and are not significant.
The portfolio of premium is as:
Less data available. ( Accuracy check)
UWP bank relies on Premium, within which Fire and Marine are also significantly affecting it
More premium means greater UWP.
Fire accounts for 10-15% of total premium, which accounts for little of the premium. In
profitability terms, we can say fire premium written is profitable to Askari, albeit on a small
scale. In addition, fire premium has a relatively high standard deviation so its effect on profits is
volatile in magnitude.
. This is good risk diversification.
ASKARI
Fire
Marine
Motor
Misc and All
15. 1.5
Note: A significant variable is one which has either a positive or negative effective impact on
underwriting profits (dependent variable).
IGI:
Coefficients
Standard
Error t Stat P-value
Premium
-
0.027558278 0.033394832
-
0.825225835 0.436459384
Net Claims
-
0.106389316 0.069141854
-
1.538710776 0.167765438
Net
Commissions 0.193659188 0.201302725 0.962029641 0.3680809
Fire Premium
-
0.073656502 0.090546642
-
0.813464756 0.442737627
Marine
Premium 0.027337734 0.216974179 0.125995335 0.903278101
Premium, Net Claims, Commissions, Fire and Marine are all not significant as they are above
10% significant levels. They do not significantly impact UWP individually. A collective shift of all
the variables together will only affect UWP effectively.
The portfolio management is as follows:
Lot of data available.
UWP bank does not significantly rely on any of Premium, including fire and marine, Net Claims,
and Net Commissions.
Fire consists of 30-35% of the portfolio mix.
Fire premium written does not add to the profitability of IGI.
IGI takes a risk averse or a cautious approach to UWP profits.
This is not good risk diversification.
IGI
Fire
Marine
Motor
Misc and All
16. 1.5
Note: A significant variable is one which has either a positive or negative effective impact on
underwriting profits (dependent variable).
ATLAS:
Coefficients Standard Error t Stat P-value
Premium 0.206331001 0.04678863 4.409853417 0.003119371
Net Claims -0.28264634 0.586696585 -0.481758966 0.644673985
Net
Commissions 0.005754942 0.767993751 0.007493475 0.994230214
Fire Premium 0.501222522 0.22435179 2.234091922 0.060603856
Marine
Premium 0.724662795 0.117323889 6.17660053 0.000455531
Premium and Marine fall within 5% significant levels, while Fire falls within 10% significance
level. So Premium, Marine and Fire all are significantly affecting UWP.
Net Claims and Commissions are not significant variables in affecting UWP since they lie above
10% significance levels.
Taking a look at the portfolio mix:
Lot of data available.
UWP bank relies primarily on premium, within which fire and marine do affect UWP
significantly.
Fire comprises 30-35% of the portfolio mix on average; however an inconsistent trend is shown
in how much fire accounts for in premium over the years.
Fire premium written does add to the profitability of Atlas; however how much it adds depends
largely from year to year since fire premium of Atlas shows a high standard deviation.
This can be classified as good risk diversification.
ATLAS
Fire
Marine
Motor
Misc and All
17. 1.5
Note: A significant variable is one which has either a positive or negative effective impact on
underwriting profits (dependent variable).
SECURITY GENERAL:
Coefficients
Standard
Error t Stat P-value
Premium 0.079410684 0.010100748 7.861861846 0.000101855
Net Claims 0.795356956 0.496637262 1.601484657 0.153303434
Net
Commissions 0.005613421 0.010976571 0.511400244 0.624802811
Fire Premium 0.111927177 0.012057392 9.282868004 3.4865E-05
Marine
Premium 0.992587329 0.17051036 5.821272861 0.000649297
Premium, Fire and Marine are within 1% significant levels and are highly effective in bringing
about changes in UWP.
Net Claims and Net Commissions are not significant as they lie above 10% significant levels.
The portfolio mix is as follows:
Moderate level of data input available.
UWP bank relies primarily on premium, within which fire and marine do affect UWP
significantly.
Fire, which is significant, comprises 60-65 % of the portfolio mix and thus it is no surprise that
fire premium and gross premium showcase a similar trend in significantly affecting the UWP
bank of Sec Gen. A low standard error indicates that fire contributes to profits on a consistent
scale.
Fire premium written comprises most of gross premium written and thus majorly adds to the
profitability of Security General.
This is good risk diversification.
SECURITY GEN
Fire
Marine
Motor
Misc and All
18. 1.5
Note: A significant variable is one which has either a positive or negative effective impact on
underwriting profits (dependent variable).
UNITED:
Coefficients
Standard
Error t Stat P-value
Premium 0.196441965 0.020128433 9.759426606 2.5114E-05
Net Claims 0.905412787 0.124392099 7.278700097 0.000165772
Net
Commissions 4.849175926 1.209587094 4.008951442 0.005131144
Fire Premium 0.825458879 0.30971114 2.665254084 0.032220652
Marine
Premium 2.348953195 0.39770241 5.906308679 0.000595677
Premium, Net Claims, Net Commissions, Fire and Marine all fall within 5% significant levels and
effectively bring about changes in UWP individually.
United’s portfolio management:
Lot of data available.
UWP bank relies significantly on ALL of Premium, within which fire and marine are also significantly
affecting UWP, Net Claims and Net Commissions.
Fire accounts for 25-30% of the portfolio mix. This is almost a fourth of United’s gross premium, so
we can fire reasonably adds to the profitability of United. A high standard error for fire premium
however, shows us that fire adds to the profits in an inconsistent trend.
This is very good risk diversification.
UNITED
Fire
Marine
Motor
Misc and All
19. 1.5
Note: A significant variable is one which has either a positive or negative effective impact on
underwriting profits (dependent variable).
TOP 3 COMPANIES IN THE MARKET:
ADAMJEE:
Coefficients
Standard
Error t Stat P-value
Premium -0.055873005 0.067030951 -0.833540384 0.432059044
Net Claims -0.00613007 0.12633435 -0.048522595 0.962655179
Net Commissions 0.521998771 0.715798471 0.729253822 0.489522173
Fire Premium -0.145571125 0.159214966 -0.914305539 0.390961958
Marine Premium 0.099707474 0.531400289 0.187631577 0.856488449
Premium, Net Claims, Commissions, Fire and Marine are all not significant as they lie above 10%
significant levels. They all do not bring about effective changes in UWP individually.
Adamjee’s portfolio management:
Lot of data available.
UWP bank does not significantly rely on any of Premium, including Fire and Marine, Net Claims,
and Net Commissions.
Fire consists of 35-40% of the portfolio mix. Fire thus takes up the major chunk of Adamjee’s
portfolio
Fire premium written, thus, does not add to the profitability of the Adamjee, and with it relying
on Fire premium for gross premium majorly, profitability suffers greatly.
Adamjee takes a risk averse or a cautious approach to UWP profits.
This is not good risk diversification.
ADAMJEE
Fire
Marine
Motor
Misc and All
20. 1.5
Note: A significant variable is one which has either a positive or negative effective impact on
underwriting profits (dependent variable).
EFU:
Coefficients Standard Error t Stat P-value
Premium 0.10435262 0.038806769 2.689031515 0.031129366
Net Claims -0.2934604 0.140650539 -2.086450648 0.075363943
Net Commissions 0.89397869 0.407492131 2.193855103 0.064311734
Fire Premium 0.13612532 0.035122318 3.875749913 0.006086299
Marine Premium 0.63089903 0.176911938 3.566175545 0.009143568
Net Claims and Net Commissions are within 10 % significant level and are significant in affecting
UWP.
Premium, fire and marine lie within 5% significant levels and are also highly significant in
affecting UWP.
EFU’s portfolio management:
Lot of data available.
UWP bank relies significantly on ALL of Premium, within which Fire and Marine are also significantly
affecting UWP, Net Claims and Net Commissions.
Fire accounts for 45-50% of the portfolio mix on average, which tells us EFU relies on fire premium a
lot. Statistically, fire premium written adds to profitability of EFU to a great extent. In addition, fire
premium’s low standard error implies that it adds to profitability on a consistent level and
magnitude.
This is very good risk diversification.
Jubilee data was not available.
EFU
Fire
Marine
Motor
Misc and All
21. 1.5
Note: A significant variable is one which has either a positive or negative effective impact on
underwriting profits (dependent variable).
22. 1.6
Conclusion on Risk analysis:
Below shows how a company’s risk diversification approach contrasts with its average
underwriting profits’ growth over the past 7 years.
Risk Level
Average UWP
Growth
ALFALAH GOOD 55.87
ASKARI GOOD 21.36
ADAMJEE NOT GOOD -28.16
EFU VERY GOOD -30.26
JUBILEE N/A -222.8
IGI NOT GOOD -0.84
ATLAS GOOD 15.48
SECURITY
GEN GOOD 38.96
UNITED VERY GOOD 20.74
We can easily observe that the only two companies with “not good” risk diversification suffer
from poor profitability.
Most of the ones with at least a “good” rating for risk diversification are experiencing positive
UWP growth rates.
The highest UWP growth belongs to a “good” risk diversified company in Alfalah.
EFU is an exception to the general trend, but this is probably because the EFU is the market
leader and with the insurance market becoming increasingly competitive, the market leader
often has to share its profits (Basic markets mechanism).
If we create a hypothetical table of the comparable size companies to IGI in terms of underwriting
profits and premiums written, IGI will top that group. However, with increased market competition the
leader often suffers and has to see its UWP shrink. In order to capture more of the market and increase
its UWP, IGI must take on a better risk diversification approach. Statistically speaking, a better risk
diversification approach does lead to better UWP.
24. 2.1
Methods and Technique:
IAP fire statistics data were gathered from 2006-2013 from the IAP website and through a request for
the aforementioned data from IAP itself. The Premiums and Loss Ratios of each industry in the fire
sector were organized year wise and represented graphically so a comparison can be drawn.
Industries are then classified according to profitability by taking into account the trends of Loss Ratios
relative to Premiums Written, and a risk assessment carried out accordingly.
In this risk assessment, first I took the average of loss ratio and then segregated industries based on
their average loss ratios over the taken span. This division was done based on low risk(favorable) which
was attached to loss ratios in the range of 0-40%, moderate risk which had a range of 40-60% and high
risk(avoidable) which was assigned to all loss ratios above 60%.
For greater accuracy I then carried out a standard deviation/variance analysis of the average loss ratio to
isolate the impact that any outlying value of data might have on our judgment. For example, an industry
with a generally low risk level might have had a year with a very high loss so while this industry generally
is of low risk, a year of high damage may have taken its average loss ratio to an inaccurate high value. A
revised and final segregation is then present.
25. 2.2
TABLES FOR PREMIUMS AND LOSS RATIOS FOR INDUSTRIES
The premiums written for each industry year-wise are given below.
0
1,000,000,000
2,000,000,000
3,000,000,000
4,000,000,000
5,000,000,000
6,000,000,000
7,000,000,000
8,000,000,000
9,000,000,000
2006
2007
2008
2009
2010
2011
2012
2013
27. 2.3
ANALYSIS & SEGREGATION
Analyzing risk.
We look at the respective average loss ratios of particular industries and stack this up against their
average premiums.
Now analyzing the average loss ratios, we can classify industries according to risk. Low risk means high
profitability, moderate risk implies moderate profitability while high risk says low profitability.
1. Low risk industries (Loss ratio 0-40 %):
Flour Mills
Woolen Mills
Captive Power Plants
Cement Industries
0 1000 2000 3000 4000 5000
Cotton Mills
Ginning & Pressing Factories
Spining Only
Weaving (Including Power Looms)
Dyeing, Bleaching & Finishing
Garments (Hosiery & Others)
Flour Mills
Woolen Mills
Jute Mills
Paper & Board Mills
Sugar Mills
Pharmaceutical Factories
Cement Industries
Petrochemical Risk*
Independent/Industrial Power…
Captive Power Plants
Others
Average Loss Ratio
Average Premium(in millions)
28. 2.3
2. Moderate risk industries (Loss ratio 40-60 %):
Sugar Mills
Weaving
Paper & Board Mills
Others
3. High risk industries (Loss ratio exceeds 60%):
Garments Factories
Cotton Mills
Jute Mills
Spinning
Dyeing, Bleaching and Furnishing
Independent/Industrial Power Plants
Ginning & Press Factories
Petrochemical Risk
Pharmaceutical Factories
Standard Deviation/Variance Analysis.
However, this division is based on a pure average taken. A variance or standard deviation analysis can
give us a better assessment of loss ratio varying over the years.
1. Low risk industries:
Average Loss Ratio
Standard
Deviation
Flour Mills 21.22 12.89
Woolen Mills 18.33 16.45
Cement Industries 22.79 8.11
Captive Power Plants 16.01 21.47
Low standard deviations for all conclude that these risks are indeed low and are
classified as favorable for us.
Basic observation can show us that even with the addition of standard deviation to
average loss ratio, none of the loss ratios will exceed 40% and thus our risk assessment
here is accurate.
29. 2.3
2. Moderate risk industries:
Average Loss Ratio
Standard
Deviation
Weaving 52.306 22.7
Paper & Board Mills 57.59 124.12
Sugar Mills 42.13 25.28
Others 52.55 22.32
Consulting the loss ratio figures in 2.2 we analyze(Refer to loss ratio table in 2.2).
Weaving loss ratios lie on both sides of the mean so it indeed represents moderate risk.
Paper & Board Mills only has one outlying value which contains a magnitude of loss ratio
of 363.15. Taking this value out will give us that Paper & Board Mills usually represents a
quite low risk with an average loss ratio of 13.93.
Sugar Mills have values on both sides of the mean offsetting each other and thus the
mean loss ratio is accurately representing moderate risk level.
Others have values on both sides of the mean offsetting each other and thus the mean
loss ratio is accurately representing moderate risk level.
30. 2.3
3. High risk industries:
Average Loss Ratio
Standard
Deviation
Cotton Mills 124.41 120.1216354
Ginning & Pressing Factories 73.29 29.9779977
Spinning Only 88.92 35.58741814
Dyeing, Bleaching & Finishing 77.99 30.15113315
Garments (Hosiery & Others) 120.08 40.96420901
Jute Mills 266.44 684.5632112
Pharmaceutical Factories 64.85 50.90620467
Petrochemical Risk* 72.69 91.56363013
Independent/Industrial Power Plants 85.46 93.55157996
Looking at the loss ratio table from 2.2 and using basic observation we conclude:
Cotton Mills just have one outlying value of loss ratio of 369.33, without which
the average loss ratio falls to 62.86, which although much lower, still represent
borderline high risk level.
Ginning & Pressing Factories have values on both sides of the mean offsetting
each other and thus the mean loss ratio is accurately representing high risk
level.
Spinning only has values on both sides of the mean offsetting each other and
thus the mean loss ratio is accurately representing high risk level.
Dyeing, Bleaching & Finishing have values on both sides of the mean offsetting
each other and thus the mean loss ratio is accurately representing high risk
level.
Jute Mills just have one huge outlying value of loss ratio of 1959.7, without
which the average loss ratio falls to 24.54, which represents a low risk level.
Pharmaceutical Factories have values on both sides of the mean offsetting each
other and thus the mean loss ratio is accurately representing borderline high
risk level.
Petrochemical Risk has one outlying value of loss ratio of 292.02, without which
the average loss ratio falls to 24.86, which represents a low risk level.
Independent/ Industrial Power Plants have values on both sides of the mean
offsetting each other and thus the mean loss ratio is accurately representing
high risk level.
31. 2.3
Revised Risk Levels After Isolating Outliers:
1. Low risk industries (Loss ratio 0-40 %):
Flour Mills
Woolen Mills
Captive Power Plants
Cement Industries
Paper & Board Mills
Jute Mills
Petrochemical Risk
2. Moderate risk industries (Loss ratio 40-60 %):
Sugar Mills
Weaving
Others
3. High risk industries (Loss ratio exceeds 60%):
Garments Factories
Cotton Mills
Spinning
Dyeing, Bleaching and Furnishing
Independent/Industrial Power Plants
Ginning & Press Factories
Pharmaceutical Factories
33. ABOUT THE AUTHOR:
I, Mirza Ali Shakir, am an intern at the Risk Management department at IGI’s Karachi office. After
graduating from Karachi Grammar School in 2013, I went on to study at McGill University where I’m
currently enrolled in the prestigious Honors Economics and Finance program. Working alongside Nabeel
Hussain and Waqas Mehmood, my mentors, I have tried my best to compile this report and hope it
achieves its aims.
Working at IGI has been an amazing experience. From the awe-striking aesthetics to the friendly
workplace environment, everything has been above par. I have learnt a lot from my time here, and
would love to come back any time in the future.
Thank you.