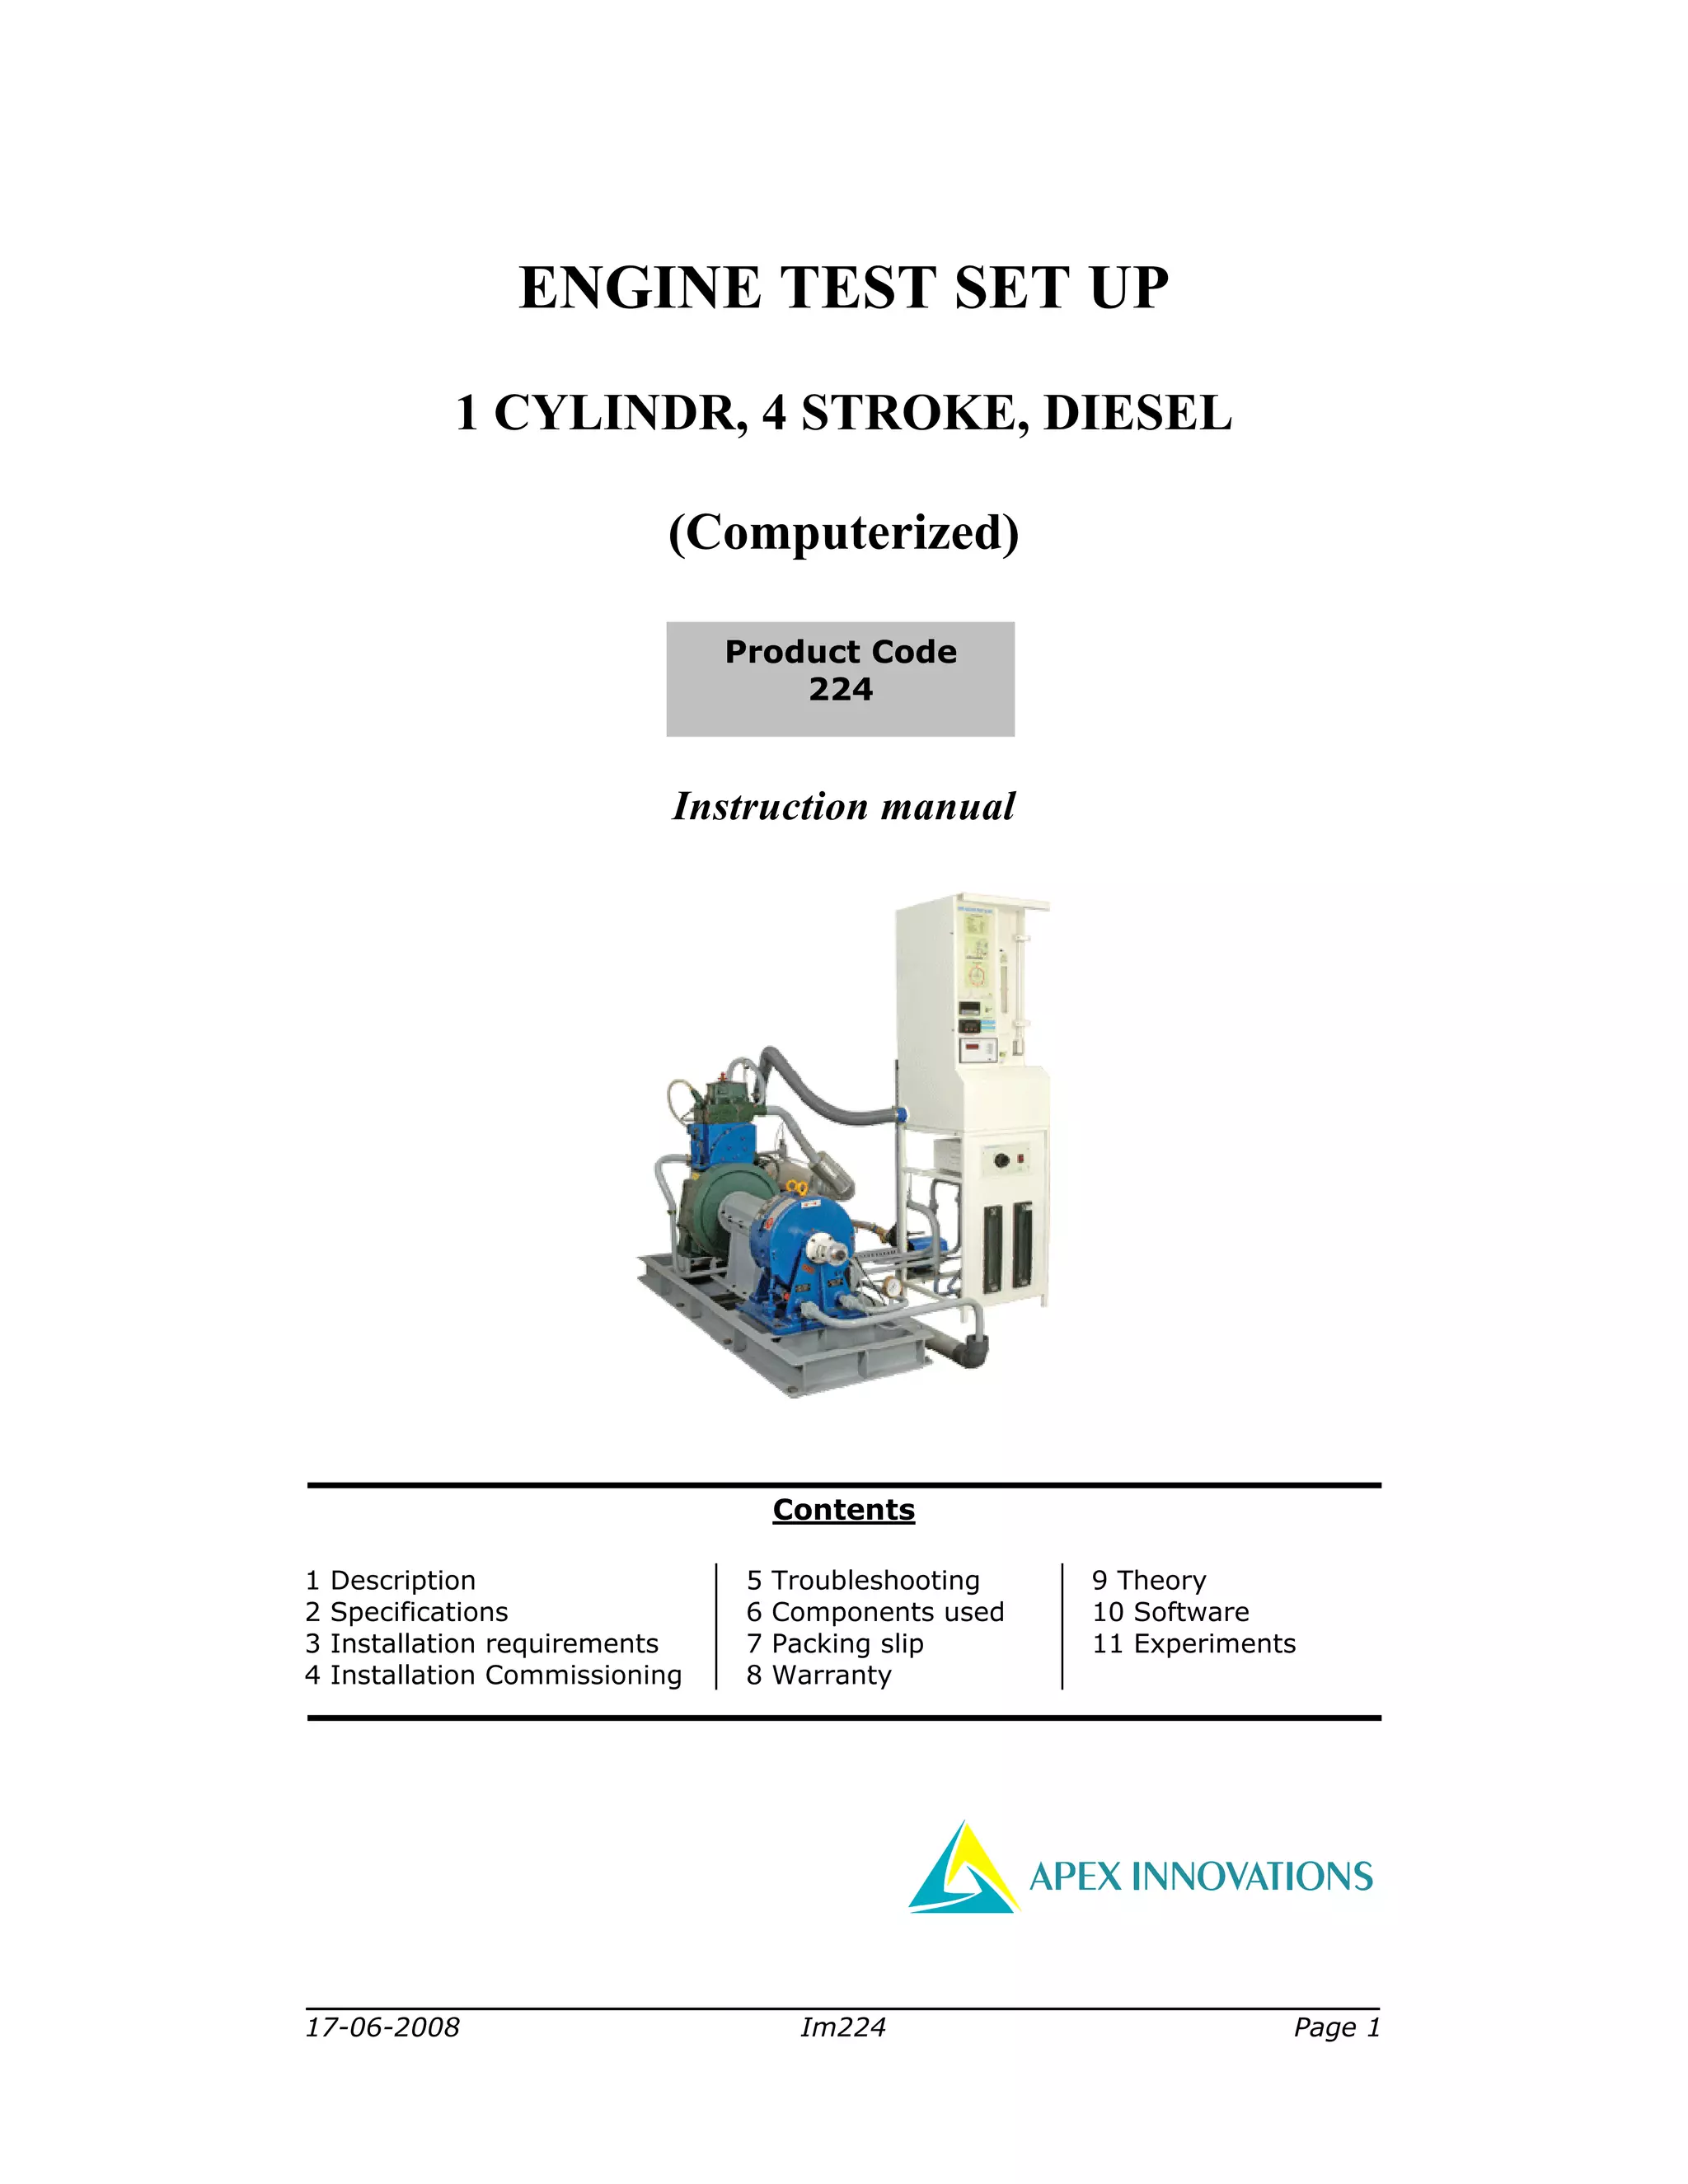
This document provides instructions for setting up and using a computerized diesel engine test setup. The setup consists of a single cylinder diesel engine connected to a dynamometer for loading. Sensors measure combustion pressure, temperature, fuel and air flow. Signals are interfaced to a computer for performance analysis using supplied software. Installation requires assembling components, connecting piping and wiring, and commissioning includes filling fluids, calibrating sensors, and ensuring data displays and engine operation as expected. Troubleshooting tips are provided for common issues.
Introduction to the engine test setup comprising of a single cylinder, four-stroke, diesel engine, and its manual contents.
Details on the engine setup, specifications (5.2 kW, Kirloskar TV1), performance metrics, and components including sensors for various measurements.
Instructions for installation and commissioning of the engine setup, including structural and piping specifications, as well as operational precautions.
Common issues and remedies for equipment malfunctions during engine tests, such as engine start problems and erroneous measurements.
Information on key components used in the engine setup, such as sensors, dynamometers, and their specifications and features.
Warranty details for the engine test setup, periods of coverage, and conditions under which warranty claims are valid.
Fundamental terms like bore, stroke, dead center, compression ratio, and their relevance in engine operation described.
Explanation of the four-stroke cycle including suction, compression, power, and exhaust strokes with key definitions.
Detailed descriptions of various efficiencies (indicated, brake, mechanical) and how they are calculated in engine performance.
Methods for measuring power output, speed, and consumption of fuel and air in internal combustion engines.
Procedural steps for running engine tests in manual and computerized modes, along with data logging practices.
Investigating performance through various tests, like pressure-volume plotting and valve timing analysis.
Guidelines on wiring diagrams and operational setup of the engine components including rotameters and indicators.
Technical specifications and manufacturer details for additional components such as load cells, pressure transmitters, and sensors.
Operational principles, calibration, and troubleshooting methods for the eddy current dynamometer.
Overview of differential pressure transmitters used for measuring liquid and gas flow in engine tests.
17-06-2008 Im224 Page1
ENGINE TEST SET UP
1 CYLINDR, 4 STROKE, DIESEL
(Computerized)
Instruction manual
Contents
1 Description
2 Specifications
3 Installation requirements
4 Installation Commissioning
5 Troubleshooting
6 Components used
7 Packing slip
8 Warranty
9 Theory
10 Software
11 Experiments
APEX INNOVATIONS
Product Code
224
2.
Apex Innovations
17-06-2008 Im224Page 2
The setup consists of single
cylinder, four stroke, Diesel
engine connected to eddy
current type dynamometer for
loading. It is provided with
necessary instruments for
combustion pressure and
crank-angle measurements.
These signals are interfaced to
computer through engine
indicator for Pθ−PV diagrams.
Provision is also made for
interfacing airflow, fuel flow,
temperatures and load
measurement. The set up has
stand-alone panel box
consisting of air box, fuel
tank, manometer, fuel
measuring unit, transmitters
for air and fuel flow
measurements, process
indicator and engine indicator.
Rotameters are provided for
cooling water and calorimeter
water flow measurement.
The setup enables study of
engine performance for brake
power, indicated power,
frictional power, BMEP, IMEP, brake thermal
efficiency, indicated thermal efficiency,
Mechanical efficiency, volumetric efficiency,
specific fuel consumption, A/F ratio and heat
balance. Labview based Engine Performance
Analysis software package “EnginesoftLV” is
provided for on line performance evaluation.
A computerized Diesel injection pressure
measurement is optionally provided.
Product Engine test setup 1 cylinder, 4 stroke, Diesel
(Computerized)
Product code 224
Engine Make Kirloskar, Model TV1, Type 1 cylinder, 4 stroke
Diesel, water cooled, power 5.2 kW at 1500 rpm,
stroke 110 mm, bore 87.5 mm. 661 cc, CR 17.5
Dynamometer Type eddy current, water cooled, with loading unit
Propeller shaft With universal joints
Air box M S fabricated with orifice meter and manometer
Fuel tank Capacity 15 lit with glass fuel metering column
Calorimeter Type Pipe in pipe
Piezo sensor Range 5000 PSI, with low noise cable
Crank angle sensor Resolution 1 Deg, Speed 5500 RPM with TDC pulse.
Data acquisition device NI USB-6210, 16-bit, 250kS/s.
Piezo powering unit Make-Cuadra, Model AX-409.
Specifications
Description
3.
Apex Innovations
17-06-2008 Im224Page 3
Digital milivoltmeter Range 0-200mV, panel mounted
Temperature sensor Type RTD, PT100 and Thermocouple, Type K
Temperature
transmitter
Type two wire, Input RTD PT100, Range 0–100 Deg C,
Output 4–20 mA and Type two wire, Input
Thermocouple, Range 0–1200 Deg C, Output 4–20 mA
Load indicator Digital, Range 0-50 Kg, Supply 230VAC
Load sensor Load cell, type strain gauge, range 0-50 Kg
Fuel flow transmitter DP transmitter, Range 0-500 mm WC
Air flow transmitter Presure transmitter, Range (-) 250 mm WC
Software “EnginesoftLV” Engine performance analysis software
Rotameter Engine cooling 40-400 LPH; Calorimeter 25-250 LPH
Pump Type Monoblock
Overall dimensions W 2000 x D 2500 x H 1500 mm
Optional Computerized Diesel injection pressure measurement
Product 224
Shipping details
Gross volume 1.33m3
, Gross weight 619kg, Net weight 543kg
Electric supply
Provide 230 +/- 10 VAC, 50 Hz, single
phase electric supply with proper
earthing. (Neutral – Earth voltage less
than 5 VAC)
• 5A, three pin socket with switch (2
Nos.)
Water supply
Continuous, clean and soft water
supply @ 1000 LPH, at 10 m. head.
Provide tap with 1” BSP size
connection
Computer
IBM compatible with standard
configuration (with free PCI slot on
motherboard)
Space
3300Lx3200Wx1700H in mm
Drain
Provide suitable drain arrangement
(Drain pipe 65 NB/2.5” size)
Exhaust
Provide suitable exhaust arrangement
(Exhaust pipe 32 NB/1.25” size)
Foundation
As per foundation drawing
Fuel, oil
Diesel@10 lit.
Oil @ 3.5 lit. (20W40)
INSTALLATION
• Unpack the box(es) received and ensure that all material is received as per
packing slip (provided in instruction manual). In case of short supply or breakage
contact Apex Innovations / your supplier for further actions.
• Install engine test set up assembly on the foundation.
• Keep panel box structure near foundation (Refer foundation drawing )
• Fit the panel box assembly on the panel box structure and fit following parts
Installation Commissioning
Installation requirements
4.
Apex Innovations
17-06-2008 Im224Page 4
o Piezo powering unit
o Loading unit
o Load indicator
o Digital voltmeter
• Complete the piping work as follows:
o Exhaust: Engine to calorimeter
o Water: Dynamometer inlet, outlet, Engine cooling inlet, outlet, Calorimeter
water inlet outlet and drain pipe.
o Air: Air box to engine
o Fuel: Fuel measuring unit to engine
• Fit the following parts
o Piezo sensor in the engine head.
o Pressure gauge on dynamometer inlet pipe.
o Temperature sensors
o Crank angle sensor on dynamometer (non driving end)
o Load cell to dynamometer.
• Complete the wiring work as follows:
o Crank angle sensor to Piezo powering unit
o Piezo sensor to Piezo powering unit
o Load cell to load indicator
o Temperature sensors to engine panel
o DLU unit to Dynamometer
o USB cable from Data acquisition device to computer “USB” port.
COMMISSIONING
• Fill lubrication oil in the engine and fuel in the fuel tank.
• Remove air from fuel line connecting fuel measuring unit to fuel transmitter.
• Lower jack bolts under dynamometer for free movement.
• Provide electric supply to panel box
o Adjust crank angle sensor for TDC matching.
o Confirm all temperatures are correctly displayed on process indicator
o Confirm load signal displayed on process indicator
• Fill water in the manometer up to “0” mark level.
• Keep “Load” knob on loading unit is at minimum position.
• Load the NI-USB driver on the computer from Driver CD.
• Connect signal cable from Data acquisition device to computer.
• Load “EnginesoftLV” software package on the same computer.
• Ensure water circulation through engine, calorimeter and dynamometer. Start the
Engine.
• Check engine operation at various loads and ensure respective signals on
computer.
Precautions
• Use clean and filtered water; any suspended particle may clog the piping.
• Piezo Sensor Handling:
o Ensure cooling water circulation for combustion pressure sensor.
o Diaphragm of the sensor is delicate part. Avoid scratches or hammering on
it.
o A long sleeve is provided inside the hole drilled for piezo sensor. This sleeve
is protecting the surface of the diaphragm. While removing the sensor, this
sleeve may come out with the sensor and fall down or lose during handling.
5.
Apex Innovations
17-06-2008 Im224Page 5
o Status of the sensor is indicated on the Piezo powering unit. Damages to the
electronic parts of the sensor or loose connection are indicated as "open" or
"short" status on Piezo powering unit.
• Circulate dynamometer and engine cooling water for some time after shutting
down the engine.
6.
Apex Innovations
17-06-2008 Im224Page 6
Note: For component specific problems refer components’ manual
Problems Possible causes / remedies
Engine does not start • Insufficient fuel
• Air trapped in fuel line
Dynamometer does
not load the engine
• Faulty wiring
• No DC voltage at the outlet of dynamometer loading
unit
Faulty air flow • Air hose leakage at connections with air-box and
with engine.
Faulty fuel flow • Improper closing of fuel cock.
• Air trap in pressure signal line to fuel transmitter
Software does not
work
• Faulty or wrong USB port
• Virus in computer
• Loose connections
Faulty indicated
power
• TDC setting disturbed. Readjust TDC setting.
• Improper configuration data
Faulty pressure crank
angle diagram
• Improper earthing
• Wrong reference pressure setting in configuration
file. Adjust the value such that suction stroke
pressure just matches the zero line.
• If peak pressure is not at the TDC, TDC setting
disturbed, readjust
• If peak pressure shifts randomly with respect to
TDC, coupling of crank angle sensor may be loose
Faulty speed
indication
• Broken coupling of crank angle sensor
Incorrect
temperature
indication
• Check the connection between thermocouple and
temperature indicator/transmitter. Note that yellow
cable of thermocouple is positive and red is
negative.
• Open or damaged temperature sensor
Improper load
indication
• Excessively raised jack bolts of the dynamometer.
TDC Setting
• The TDC indicator provided on the engine indicator enables matching of index
pulse of crank angle sensor with TDC(Top Dead Centre) of the cylinder. Take
the piston to its TDC position (match mark provided on the engine
fan/pulley/flywheel).
• Loosen the screws of clamping flange of engine crank angle sensor.
• Slowly rotate the crank angle sensor body till the TDC indicator lamp glows.
At this position clamp the flange screws to fix the crank angle sensor at this position.
Troubleshooting
7.
Apex Innovations
17-06-2008 Im224Page 7
Components Details
Engine Make Kirloskar, Model TV1, Type Single cylinder, 4
stroke Diesel, water cooled, power 5.2 kW (7 BHP) at
1500 rpm, stroke 110 mm, bore 87.5 mm.
compression ratio 17.5:1, capacity 661 cc.
Dynamometer Make Saj test plant Pvt. Ltd., Model AG10, Type Eddy
current
Dynamometer Loading
unit
Make Apex, Model AX-155. Type constant speed,
Supply 230V AC.
Propeller shaft Make Hindustan Hardy Spicer, Model 1260, Type A
Manometer Make Apex, Model MX-104, Range 100-0-100 mm,
Type U tube, Conn. 1/4`` BSP hose back side,
Mounting panel
Fuel measuring unit Make Apex, Glass, Model:FF0.012
Piezo sensor Make PCB Piezotronics, Model HSM111A22, Range
5000 psi, Diaphragm stainless steel type & hermetic
sealed
White coaxial teflon
cable
Make PCB piezotronics, Model 002C20, Length 20 ft,
Connections one end BNC plug and other end 10-32
micro
Crank angle sensor Make Kubler-Germany Model 8.3700.1321.0360 Dia:
37mm Shaft Size: Size 6mmxLength 12.5mm, Supply
Voltage 5-30V DC, Output Push Pull (AA,BB,OO),
PPR: 360, Outlet cable type axial with flange 37 mm
to 58 mm
Data acquisition device NI USB-6210 Bus Powered M Series,
Piezo powering unit Make-Cuadra, Model AX-409.
Temperature sensor Make Radix Type K, Ungrounded, Sheath
Dia.6mmX110mmL, SS316, Connection 1/4"BSP (M)
adjustable compression fitting
Temperature sensor Make Radix, Type Pt100, Sheath Dia.6mmX110mmL,
SS316, Connection 1/4"BSP(M) adjustable
compression fitting
Temperature
transmitter
Make Wika, model T19.10.3K0-4NK-Z, Input
Thermocouple (type K), output 4-20mA, supply
24VDC, Calibration: 0-1200deg.C.
Temperature
transmitter
Make Wika, Model T19.10.1PO-1 Input RTD(Pt100),
output 4-20mA, supply 24VDC, Calibration: 0-100°C
Load sensor Make Sensotronics Sanmar Ltd., Model 60001,Type S
beam, Universal, Capacity 0-50 kg
Load indicator Make Selectron, model PIC 152–B2, 85 to 270VAC,
retransmission output 4-20 mA
Power supply Make Meanwell, model S-15-24, O/P 24 V, 0.7 A
Digital voltmeter Make Meco, 3.1/2 digit LED display, range 0-20 VDC,
supply 230VAC, model SMP35
Fuel flow transmitter Make Yokogawa, Model EJA110-EMS-5A-92NN,
Calibration range 0-500 mm H2O, Output linear
Air flow transmitter Make Wika, Range (-) 250 mm WC
Components used
8.
Apex Innovations
17-06-2008 Im224Page 8
Rotameter Make Eureka Model PG 5, Range 25-250 lph,
Connection 3/4" BSP vertical, screwed, Packing
neoprene
Rotameter Make Eureka Model PG 6, Range 40-400 lph,
Connection ¾” BSP vertical, screwed, Packing
neoprene
Pump Make Kirloskar, Model Mini 18SM, HP 0.5, Size 1” x
1”, Single ph 230 V AC
Box
No.1/8
Size W975xD475xH500 mm; Volume:0.23m3
Gross weight: 70kg
Net weight: 52kg
1 Engine panel box assembly 1 No.
Box
No.2/8
Size W500xD400xH300 mm; Volume:0.06m3
Gross weight: 25kg
Net weight: 18kg
1 Piezo powering unit 1 No.
2 Load indicator 1 No.
3 Digital voltmeter 1 No.
4 Dynamometer loading unit 1 No.
5 Pressure gauge 1 No.
6 Wiring set 1 No.
7 Load cell with nut bolt 1 No.
8 Crank angle sensor 1 No.
9 Temperature sensor 5 Nos.
10 Piezo sensor 1No/2Nos.
11 Low noise cable 1No/2Nos.
12 Data acquisition device and driver CD 1 No.
13 Set of loose nut bolts 1 No.
14 Tool kit 1 No.
15 Set of instruction manuals consisting of:
Instruction manual CD (Apex)
DP transmitter
Dynamometer
Piezo sensor
1 No.
Box
No.3/8
Size W800xD475xH500 mm; Volume:0.19m3
Gross weight: 46kg
Net weight: 31kg
1 Engine panel box structure 1 No.
Box
No.4/8
Size W725xD250xH325 mm; Volume: 0.06m3
Gross weight: 24kg
Net weight: 17kg
1 Calorimeter assembly 1 No.
2 Calorimeter support structure 1 No.
Box
No.5/8
Size W900xD200xH200 mm; Volume: 0.04m3
Gross weight: 16kg
Net weight: 10kg
1 Exhaust pipe 1 No.
Box
No.6/8
Size W300xD225xH300 mm; Volume:0.02m3
Gross weight: 14kg
Net weight: 7kg
1 Pump 1 No.
Box
No.7/8
Size W1250xD450xH350mm; Volume: 0.15m3
Gross weight: 42kg
Net weight: 28kg
Packing slip
9.
Apex Innovations
17-06-2008 Im224Page 9
1 Piping set (13 pieces) 1 No.
2 Fuel measuring unit 2 Nos.
3 Funnel 1 No.
4 Fuel cap 1 No.
5 Wiring channel set (5 pieces) 1 No.
6 Starting kick/Handle 1 No.
7 Engine air inlet 1 No.
8 Engine silencer 1 No.
9 Pump support 1 No.
10 Water supply hose pipe 1 No.
11 1.25” socket with pipe 1 No.
12 1.25” socket with flange 1 No.
13 ¾” Ball valve 1 No.
14 Teflon tape(2Nos.), Gasket bottle (1No.) 1 No.
Case
No.8/8
Open packing; Volume:0.61m3
Gross weight: 380kg
Net weight: 380kg
1 Engine test setup assembly and water supply
pipe
1 No.
10.
Apex Innovations
17-06-2008 Im224Page 10
This product is warranted for a period of 12 months from the date of supply against
manufacturing defects. You shall inform us in writing any defect in the system
noticed during the warranty period. On receipt of your written notice, Apex at its
option either repairs or replaces the product if proved to be defective as stated
above. You shall not return any part of the system to us before receiving our
confirmation to this effect.
The foregoing warranty shall not apply to defects resulting from:
Buyer/ User shall not have subjected the system to unauthorized alterations/
additions/ modifications.
Unauthorized use of external software/ interfacing.
Unauthorized maintenance by third party not authorized by Apex.
Improper site utilities and/or maintenance.
We do not take any responsibility for accidental injuries caused while working with
the set up.
Apex Innovations Pvt. Ltd.
E9/1, MIDC, Kupwad, Sangli-416436 (Maharashtra) India
Telefax:0233-2644098, 2644398
Email: san_apexinno@sancharnet.in Web: www.apexinnovations-ind.com
Warranty
11.
Apex Innovations
17-06-2008 Im224Page 11
TERMINOLOGY
Engine Cylinder diameter (bore) (D): The nominal inner diameter of the
working cylinder.
Piston area (A): The area of a circle of diameter equal to engine
cylinder diameter (bore).
2
4/ DA ×= π
Engine Stroke length (L): The nominal distance through which a working
piston moves between two successive reversals of its direction of motion.
Dead center: The position of the working piston and the moving parts, which
are mechanically connected to it at the moment when the direction of the piston
motion is reversed (at either end point of the stroke).
Bottom dead center (BDC): Dead center when the piston is nearest to
the crankshaft. Sometimes it is also called outer dead center (ODC).
Top dead center (TDC): Dead center when the position is farthest from the
crankshaft. Sometimes it is also called inner dead center (IDC).
Swept volume (VS): The nominal volume generated by the working piston
when travelling from one dead center to next one, calculated as the product of
piston area and stroke. The capacity described by engine manufacturers in cc
is the swept volume of the engine. LDLAVs
2
4/ ×=×= π
Clearance volume (VC): The nominal volume of the space on the combustion side
of the piston at top dead center.
Cylinder volume: The sum of swept volume and clearance volume. cs VVV +=
Compression ratio (CR): The numerical value of the cylinder volume divided
by the numerical value of clearance volume. cVVCR /=
Theory
12.
Apex Innovations
17-06-2008 Im224Page 12
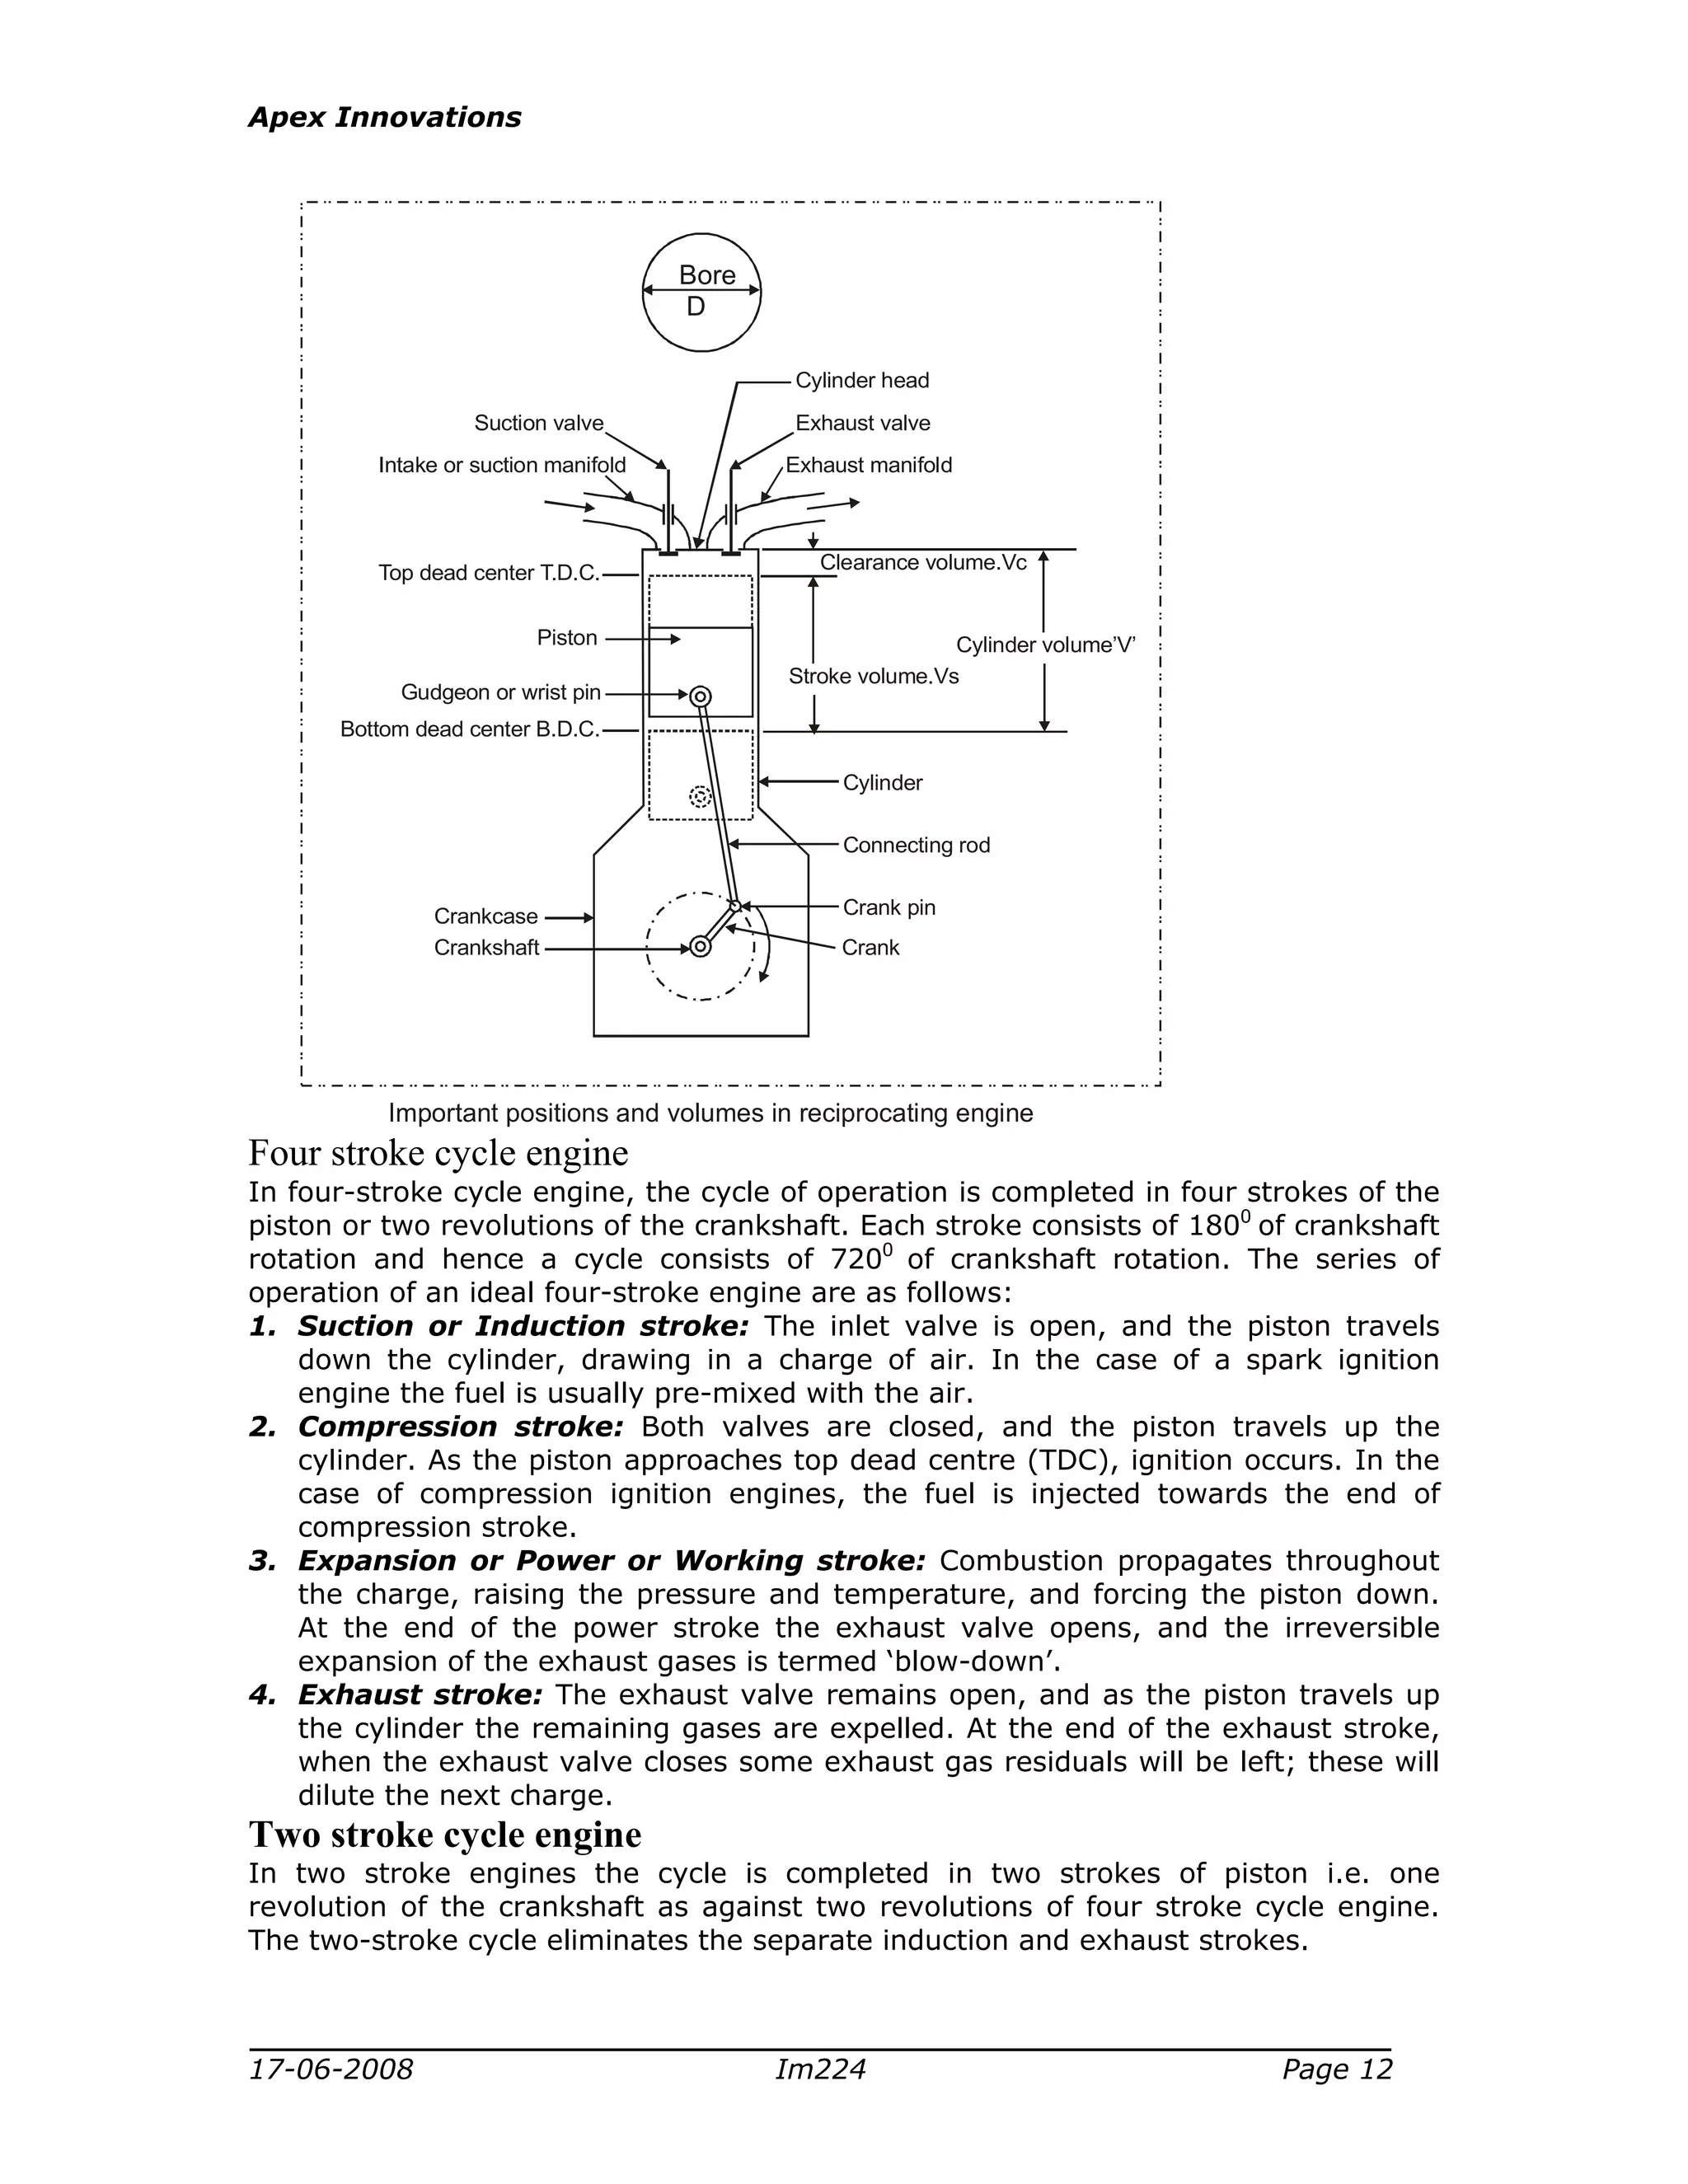
Bore
D
Crankshaft
Crankcase
Crank
Crank pin
Connecting rod
Cylinder
Bottom dead center B.D.C.
Piston
Gudgeon or wrist pin
Top dead center T.D.C.
Intake or suction manifold
Suction valve
Exhaust manifold
Exhaust valve
Cylinder head
Stroke volume.Vs
Clearance volume.Vc
Cylinder volume’V’
Important positions and volumes in reciprocating engine
Four stroke cycle engine
In four-stroke cycle engine, the cycle of operation is completed in four strokes of the
piston or two revolutions of the crankshaft. Each stroke consists of 1800
of crankshaft
rotation and hence a cycle consists of 7200
of crankshaft rotation. The series of
operation of an ideal four-stroke engine are as follows:
1. Suction or Induction stroke: The inlet valve is open, and the piston travels
down the cylinder, drawing in a charge of air. In the case of a spark ignition
engine the fuel is usually pre-mixed with the air.
2. Compression stroke: Both valves are closed, and the piston travels up the
cylinder. As the piston approaches top dead centre (TDC), ignition occurs. In the
case of compression ignition engines, the fuel is injected towards the end of
compression stroke.
3. Expansion or Power or Working stroke: Combustion propagates throughout
the charge, raising the pressure and temperature, and forcing the piston down.
At the end of the power stroke the exhaust valve opens, and the irreversible
expansion of the exhaust gases is termed ‘blow-down’.
4. Exhaust stroke: The exhaust valve remains open, and as the piston travels up
the cylinder the remaining gases are expelled. At the end of the exhaust stroke,
when the exhaust valve closes some exhaust gas residuals will be left; these will
dilute the next charge.
Two stroke cycle engine
In two stroke engines the cycle is completed in two strokes of piston i.e. one
revolution of the crankshaft as against two revolutions of four stroke cycle engine.
The two-stroke cycle eliminates the separate induction and exhaust strokes.
13.
Apex Innovations
17-06-2008 Im224Page 13
1. Compression stroke: The piston travels up the cylinder, so compressing the
trapped charge. If the fuel is not pre-mixed, the fuel is injected towards the end
of the compression stroke; ignition should again occur before TDC.
Simultaneously under side of the piston is drawing in a charge through a spring-
loaded non-return inlet valve.
2. Power stroke: The burning mixture raises the temperature and pressure in the
cylinder, and forces the piston down. The downward motion of the piston also
compresses the charge in the crankcase. As the piston approaches the end of its
stroke the exhaust port is uncovered and blowdown occurs. When the piston is at
BDC the transfer port is also uncovered, and the compressed charge in the
crankcase expands into the cylinder. Some of the remaining exhaust gases are
displaced by the fresh charge; because of the flow mechanism this is called ‘loop
scavenging'. As the piston travels up the cylinder, the piston closes the first
transfer port, and then the exhaust port is closed.
Performance of I.C.Engines
Indicated thermal efficiency (ηt): Indicated thermal efficiency is the ratio of
energy in the indicated power to the fuel energy.
FuelEnergyowerIndicatedPt /=η
100
)/()/(
3600)(
(%) ×
×
×
=
KgKJalueCalorificVHrKgFuelFlow
KWowerIndicatedP
tη
Brake thermal efficiency (ηbth): A measure of overall efficiency of the engine
is given by the brake thermal efficiency. Brake thermal efficiency is the ratio of
energy in the brake power to the fuel energy.
FuelEnergyBrakePowerbth /=η
100
)/()/(
3600)(
(%) ×
×
×
=
KgKJalueCalorificVHrKgFuelFlow
KWBrakePower
bthη
Mechanical efficiency (ηm): Mechanical efficiency is the ratio of brake horse power
(delivered power) to the indicated horsepower (power provided to the piston).
owerIndicatedPBrakePowerm /=η
and Frictional power = Indicated power – Brake power
Following figure gives diagrammatic representation of various efficiencies,
Energy lost in exhaust, coolant, and radiation
Energy lost in friction, pumping etc.
Energy
in fuel
(A)
IP
(B)
BP
(C)
14.
Apex Innovations
17-06-2008 Im224Page 14
Indicated thermal efficiency = B/A
Brake thermal efficiency = C/A
Mechanical efficiency = C/B
Volumetric efficiency (ηv): The engine output is limited by the maximum
amount of air that can be taken in during the suction stroke, because only a
certain amount of fuel can be burned effectively with a given quantity of air.
Volumetric efficiency is an indication of the ‘breathing’ ability of the engine and
is defined as the ratio of the air actually induced at ambient conditions to the
swept volume of the engine. In practice the engine does not induce a complete
cylinder full of air on each stroke, and it is convenient to define volumetric
efficiency as:
Mass of air consumed
ηv (%) = --------------------------------------------------------------------------
mass of flow of air to fill swept volume at atmospheric conditions
100
60)/(/)()(4/
)/(
(%) 332
×
×××××
=
mKgAirDenNoofCylnRPMNmLD
HrKgAirFlow
v
π
η
Where n= 1 for 2 stroke engine and n= 2 for 4 stroke engine.
Air flow:
For air consumption measurement air box with orifice is used.
3600/24/)/( 2
×××××××= dendendenwaterd AAWhgDCHrKgAitFlow π
Where Cd = Coefficient of discharge of orifice
D = Orifice diameter in m
g = Acceleration due to gravity (m/s2
) = 9.81 m/s2
h = Differential head across orifice (m of water)
Wden = Water density (kg/m3
) =@1000 kg/m3
Wair = Air density at working condition (kg/m3
) = p/RT
Where
p= Atmospheric pressure in kgf/m2
(1 Standard atm. = 1.0332X10⁴
kgf/m2
)
R= Gas constant = 29.27 kgf.m/kg0
k
T= Atmospheric temperature in 0
k
Specific fuel consumption (SFC): Brake specific fuel consumption and indicated
specific fuel consumption, abbreviated BSFC and ISFC, are the fuel consumptions
on the basis of Brake power and Indicated power respectively.
Fuel-air (F/A) or air-fuel (A/F) ratio: The relative proportions of the fuel and air
in the engine are very important from standpoint of combustion and efficiency of
the engine. This is expressed either as the ratio of the mass of the fuel to that of
the air or vice versa.
Calorific value or Heating value or Heat of combustion: It is the energy
released per unit quantity of the fuel, when the combustible is burned and the
products of combustion are cooled back to the initial temperature of combustible
mixture. The heating value so obtained is called the higher or gross calorific value
of the fuel. The lower or net calorific value is the heat released when water in the
products of combustion is not condensed and remains in the vapour form.
Power and Mechanical efficiency: Power is defined as rate of doing work and
equal to the product of force and linear velocity or the product of torque and
15.
Apex Innovations
17-06-2008 Im224Page 15
angular velocity. Thus, the measurement of power involves the measurement of
force (or torque) as well as speed.
The power developed by an engine at the output shaft is called brake power and
is given by
Power = NT/60,000 in kW
where T= torque in Nm = WR
W = 9.81 * Net mass applied in kg. R= Radius in m
N is speed in RPM
Mean effective pressure and torque: Mean effective pressure is defined as a
hypothetical pressure, which is thought to be acting on the piston throughout the
power stroke.
Power in kW = (Pm LAN/n 100)/60 in bar
where Pm = mean effective pressure
L = length of the stroke in m
A = area of the piston in m2
N = Rotational speed of engine RPM
n= number of revolutions required to complete one engine cycle
n= 1 (for two stroke engine)
n= 2 (for four stroke engine)
Thus we can see that for a given engine the power output can be measured in
terms of mean effective pressure. If the mean effective pressure is based on
brake power it is called brake mean effective pressure (BMEP) and if based on
indicated power it is called indicated mean effective pressure (IMEP).
100)/(
60)(
)(
××××
×
=
NoOfCylnNAL
KWBrakePower
barBMEP
100)/(
60)(
)(
××××
×
=
NoOfCylnNAL
KWowerIndicatedP
barIMEP
Similarly, the friction means effective pressure (FMEP) can be defined as
FMEP= IMEP – BMEP
Basic measurements
The basic measurements, which usually should be undertaken to evaluate the
performance of an engine on almost all tests, are the following:
1 Measurement of speed
Following different speed measuring devices are used for speed measurement.
1 Photoelectric/Inductive proximity pickup with speed indicator
2 Rotary encoder
2 Measurement of fuel consumption
I) Volumetric method: The fuel consumed by an engine is measured by
determining the volume flow of the fuel in a given time interval and multiplying it by
the specific gravity of fuel. Generally a glass burette having graduations in ml is used
for volume flow measurement. Time taken by the engine to consume this volume is
measured by stopwatch.
II) Gravimetric method: In this method the time to consume a given weight of the
fuel is measured. Differential pressure transmitters working on hydrostatic head
principles can used for fuel consumption measurement.
3 Measurement of air consumption
Air box method: In IC engines, as the air flow is pulsating, for satisfactory
measurement of air consumption an air box of suitable volume is fitted with orifice.
16.
Apex Innovations
17-06-2008 Im224Page 16
The air box is used for damping out the pulsations. The differential pressure across
the orifice is measured by manometer and pressure transmitter.
4 Measurement of brake power
Measurement of BP involves determination of the torque and angular speed of the
engine output shaft. This torque-measuring device is called a dynamometer.
The dynamometers used are of following types:
I) Rope brake dynamometer: It consists of a number of turns of rope wound
around the rotating drum attached to the output shaft. One side of the rope is
connected to a spring balance and the other to a loading device. The power is
absorbed in friction between the rope and the drum. The drum therefore requires
cooling.
Brake power = ∏DN (W-S)/60,000 in kW
where D is the brake drum diameter, W is the weight and S is the spring scale
reading.
II) Hydraulic dynamometer: Hydraulic dynamometer works on the principal of
dissipating the power in fluid friction. It consists of an inner rotating member or
impeller coupled to output shaft of the engine. This impeller rotates in a casing, due
to the centrifugal force developed, tends to revolve with impeller, but is resisted by
torque arm supporting the balance weight. The frictional forces between the impeller
and the fluid are measured by the spring-balance fitted on the casing. Heat
developed due to dissipation of power is carried away by a continuous supply of the
working fluid usually water. The output (power absorbed) can be controlled by
varying the quantity of water circulating in the vortex of the rotor and stator
elements. This is achieved by a moving sluice gate in the dynamometer casing.
III) Eddy current dynamometer: It consists of a stator on which are fitted a
number of electromagnets and a rotor disc and coupled to the output shaft of the
engine. When rotor rotates eddy currents are produced in the stator due to magnetic
flux set up by the passage of field current in the electromagnets. These eddy
currents oppose the rotor motion, thus loading the engine. These eddy currents are
dissipated in producing heat so that this type of dynamometer needs cooling
arrangement. A moment arm measures the torque. Regulating the current in
electromagnets controls the load.
Note: While using with variable speed engines sometimes in certain speed zone the
dynamometer operating line are nearly parallel with engine operating lines which
result in poor stability.
5 Measurement of indicated power
There are two methods of finding the IHP of an engine.
I) Indicator diagram: A dynamic pressure sensor (piezo sensor) is fitted in the
cylinder head to sense combustion pressure. A rotary encoder is fitted on the engine
shaft for crank angle signal. Both signals are simultaneously scanned by an engine
indicator (electronic unit) and communicated to computer. The software in the
computer draws pressure crank-angle and pressure volume plots and computes
indicated power of the engine.
Conversion of pressure crank-angle plot to pressure volume plot:
17.
Apex Innovations
17-06-2008 Im224Page 17
The figure shows crank-slider mechanism. The piston pin position is given by
φθ coscos lrx +=
From figure φθ sinsin lr = and recalling φφ 2
sin1cos −=
( ){ }
−+= θθ 22
sin1cos lrrlrx
The binomial theorem can be used to expand the square root term:
[ ]{ }...sin)/(81sin)/(
2
11/cos 4422
+−−+= θθθ lrlrrlrx ….1
The powers of sin θ can be expressed as equivalent multiple angles:
θθ 2cos2/12/1sin2
−=
θθθ 4cos8/12cos2/18/3sin4
+−= …….2
Substituting the results from equation 2 in to equation 1 gives
( ) ( )[ ]{ }...4cos8/12cos2/18/3)/(812cos2/12/1)/(
2
11/cos 42
++−−−−+= θθθθ lrlrrlrx
The geometry of the engine is such that ( )2
/lr is invariably less than 0.1, in which
case it is acceptable to neglect the ( )4
/lr terms, as inspection of above equation
shows that these terms will be at least an order of magnitude smaller than
( )2
/lr terms.
The approximate position of piston pin end is thus:
( )[ ]{ }θθ 2cos2/12/1)/(
2
11/cos 2
−−+= lrrlrx
Where r =crankshaft throw and l = connecting rod length.
Calculate x using above equation; then )( xrl −+ shall give distance traversed by
piston from its top most position at any angle θ
II) Morse test: It is applicable to multi-cylinder engines. The engine is run at
desired speed and output is noted. Then combustion in one of the cylinders is
stopped by short circuiting spark plug or by cutting off the fuel supply. Under this
condition other cylinders “motor” this cylinder. The output is measured after
adjusting load on the engine to keep speed constant at original value. The difference
in output is measure of the indicated power of cut-out cylinder. Thus for each
cylinder indicated power is obtained to find out total indicated power.
VCR Engines
The standard available engines (with fixed compression ratio) can be modified by
providing additional variable combustion space. This is done by welding a long hollow
sleeve with internal threads to the engine head. A threaded plug is inserted in the
sleeve to vary the combustion chamber volume. With this method the compression
ratio can be changed within designed range.
18.
Apex Innovations
17-06-2008 Im224Page 18
Calculations
• Brake power (kw):
100060
2
x
NT
BP
π
=
60000
)(2 WxRNπ
=
60000
)81.9(785.0 xArmlengthWxxRPMx
=
6075x
TxN
BHP =
• Brake mean effective pressure (bar):
100)/(4/
60
2
xNoOfCylxnNxLxxD
BPx
BMEP
π
=
n = 2 for 4 stroke
n = 1 for 2 stroke
• Indicated power (kw) :From PV diagram
X scale (volume) 1cm = ..m3
Y scale (pressure) 1cm = ..bar
Area of PV diagram = ..cm2
100000)(// ×××= orYscalefactorXscalefactagramAreaofPVdiNmcylcycleworkdone
100060
)/(//
×
××
=
NoOfCylnNcylcycleworkdone
IP
• Indicated mean effective pressure (bar):
100)/(4/
60
2
xNoOfCylxnNxLxxD
IPx
IMEP
π
=
• Frictional power (kw):
BPIPFP −=
BHPIHPFHP −=
FHPIHPBHP −=
• Brake specific fuel consumption (Kg/kwh):
BP
hrkgFuelflowIn
BSFC
/
=
• Brake Thermal Efficiency (%):
CalValhrKgFuelFlowIn
BP
BThEff
×
××
=
/
1003600
19.
Apex Innovations
17-06-2008 Im224Page 19
FuelHP
BHP
OR
MechEffIThEff
BThEff
100
×
=
• Indicated Thermal Efficiency (%):
CalValhrKgFuelFlowIn
IP
IThEff
×
××
=
/
1003600
MechEff
BThEff
IThEff
100×
=
• Mechanical Efficiency (%):
IP
BP
MechEff
100×
=
• Air flow (Kg/hr):
AdenAdenWdenghdCdAirFlow ×××××= 3600)/(24/ 2
π
• Volumetric Efficiency (%):
lAirFlowTheoretica
AirFlow
VolEff
100×
=
AdenNoOfCylnNStrokeD
AirFlow
××××××
×
=
60)/(4/
100
2
π
• Air fuel ratio:
FuelFlow
AirFlow
FA =/
• Heat Balance (KJ/h):
a) CalValFuelFlowedbyFuelHeatSuppli ×=
b) 3600×= BPulWorklentToUsefHeatEquiva
edByFuelHeatSuppli
ulWorklentToUsefHeatEquiva
ulWorkInlentToUsefHeatEquiva
100
%
×
=
C) )12(3 TTWCFateretCoolingWHeatInJack P −××=
edByFuelHeatSuppli
ateretCoolingWHeatInJack
aterInetCoolingWHeatInJack
100
%
×
=
d) Heat in Exhaust (Calculate CPex value):
20.
Apex Innovations
17-06-2008 Im224Page 20
kKgKJ
TTFF
TTWCF
exC P
P
0
/..
)65()21(
)34(4
−×+
−××
=
Where,
Cpex Specific heat of exhaust gas kJ/kg0
K
Cpw Specific heat of water kJ/kg0
K
F1 Fuel consumption kg/hr
F2 Air consumption kg/hr
F4 Calorimeter water flow kg/hr
T3 Calorimeter water inlet temperature 0
K
T4 Calorimeter water outlet temperature 0
K
T5 Exhaust gas to calorimeter inlet temp. 0
K
T6 Exhaust gas from calorimeter outlet temp. 0
K
)3()21()/( TambTexCFFhKJustHeatInExha P −××+=
edByFuelHeatSuppli
ustHeatInExha
ustHeatInExha
100
%
×
=
e) Heat to radiation and unaccounted (%)
(%)}(%)
(%){(%)100(
ustHeatToExhaateretCoolingWHeatInJack
ulWorklentToUsefHeatEquivaedByFuelHeatSuppli
+
+−=
21.
Apex Innovations
17-06-2008 Im224Page 21
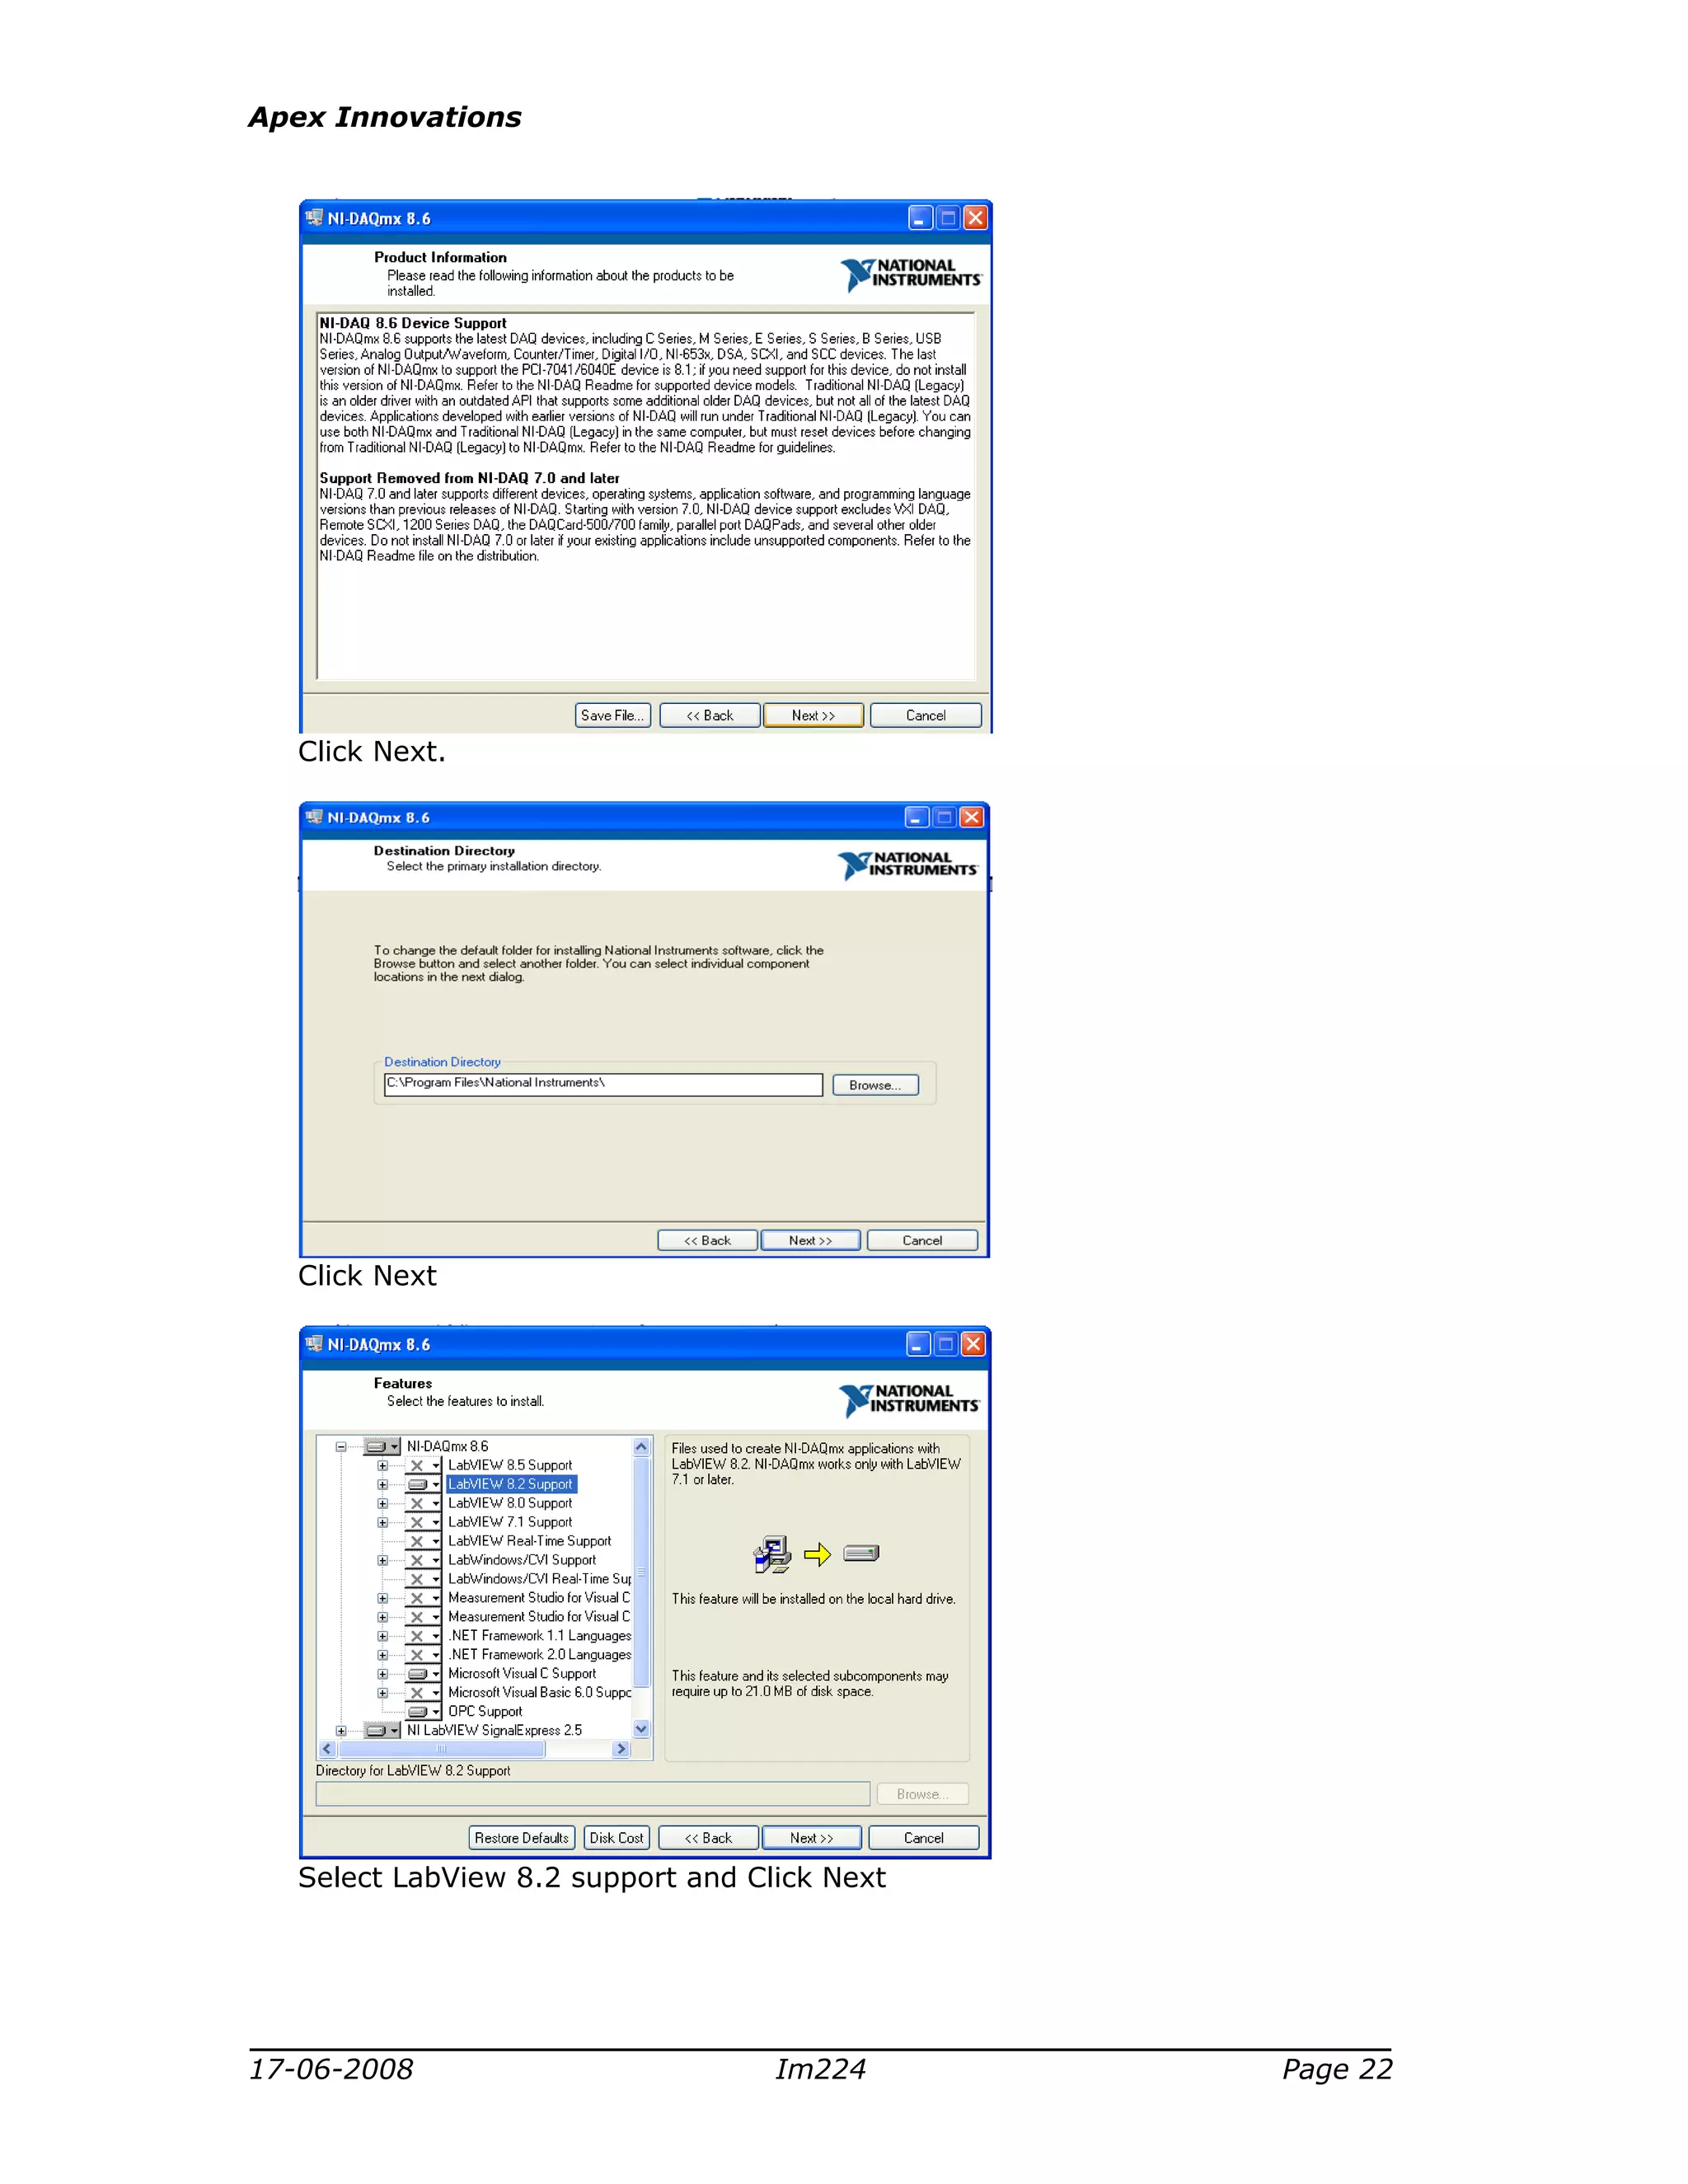
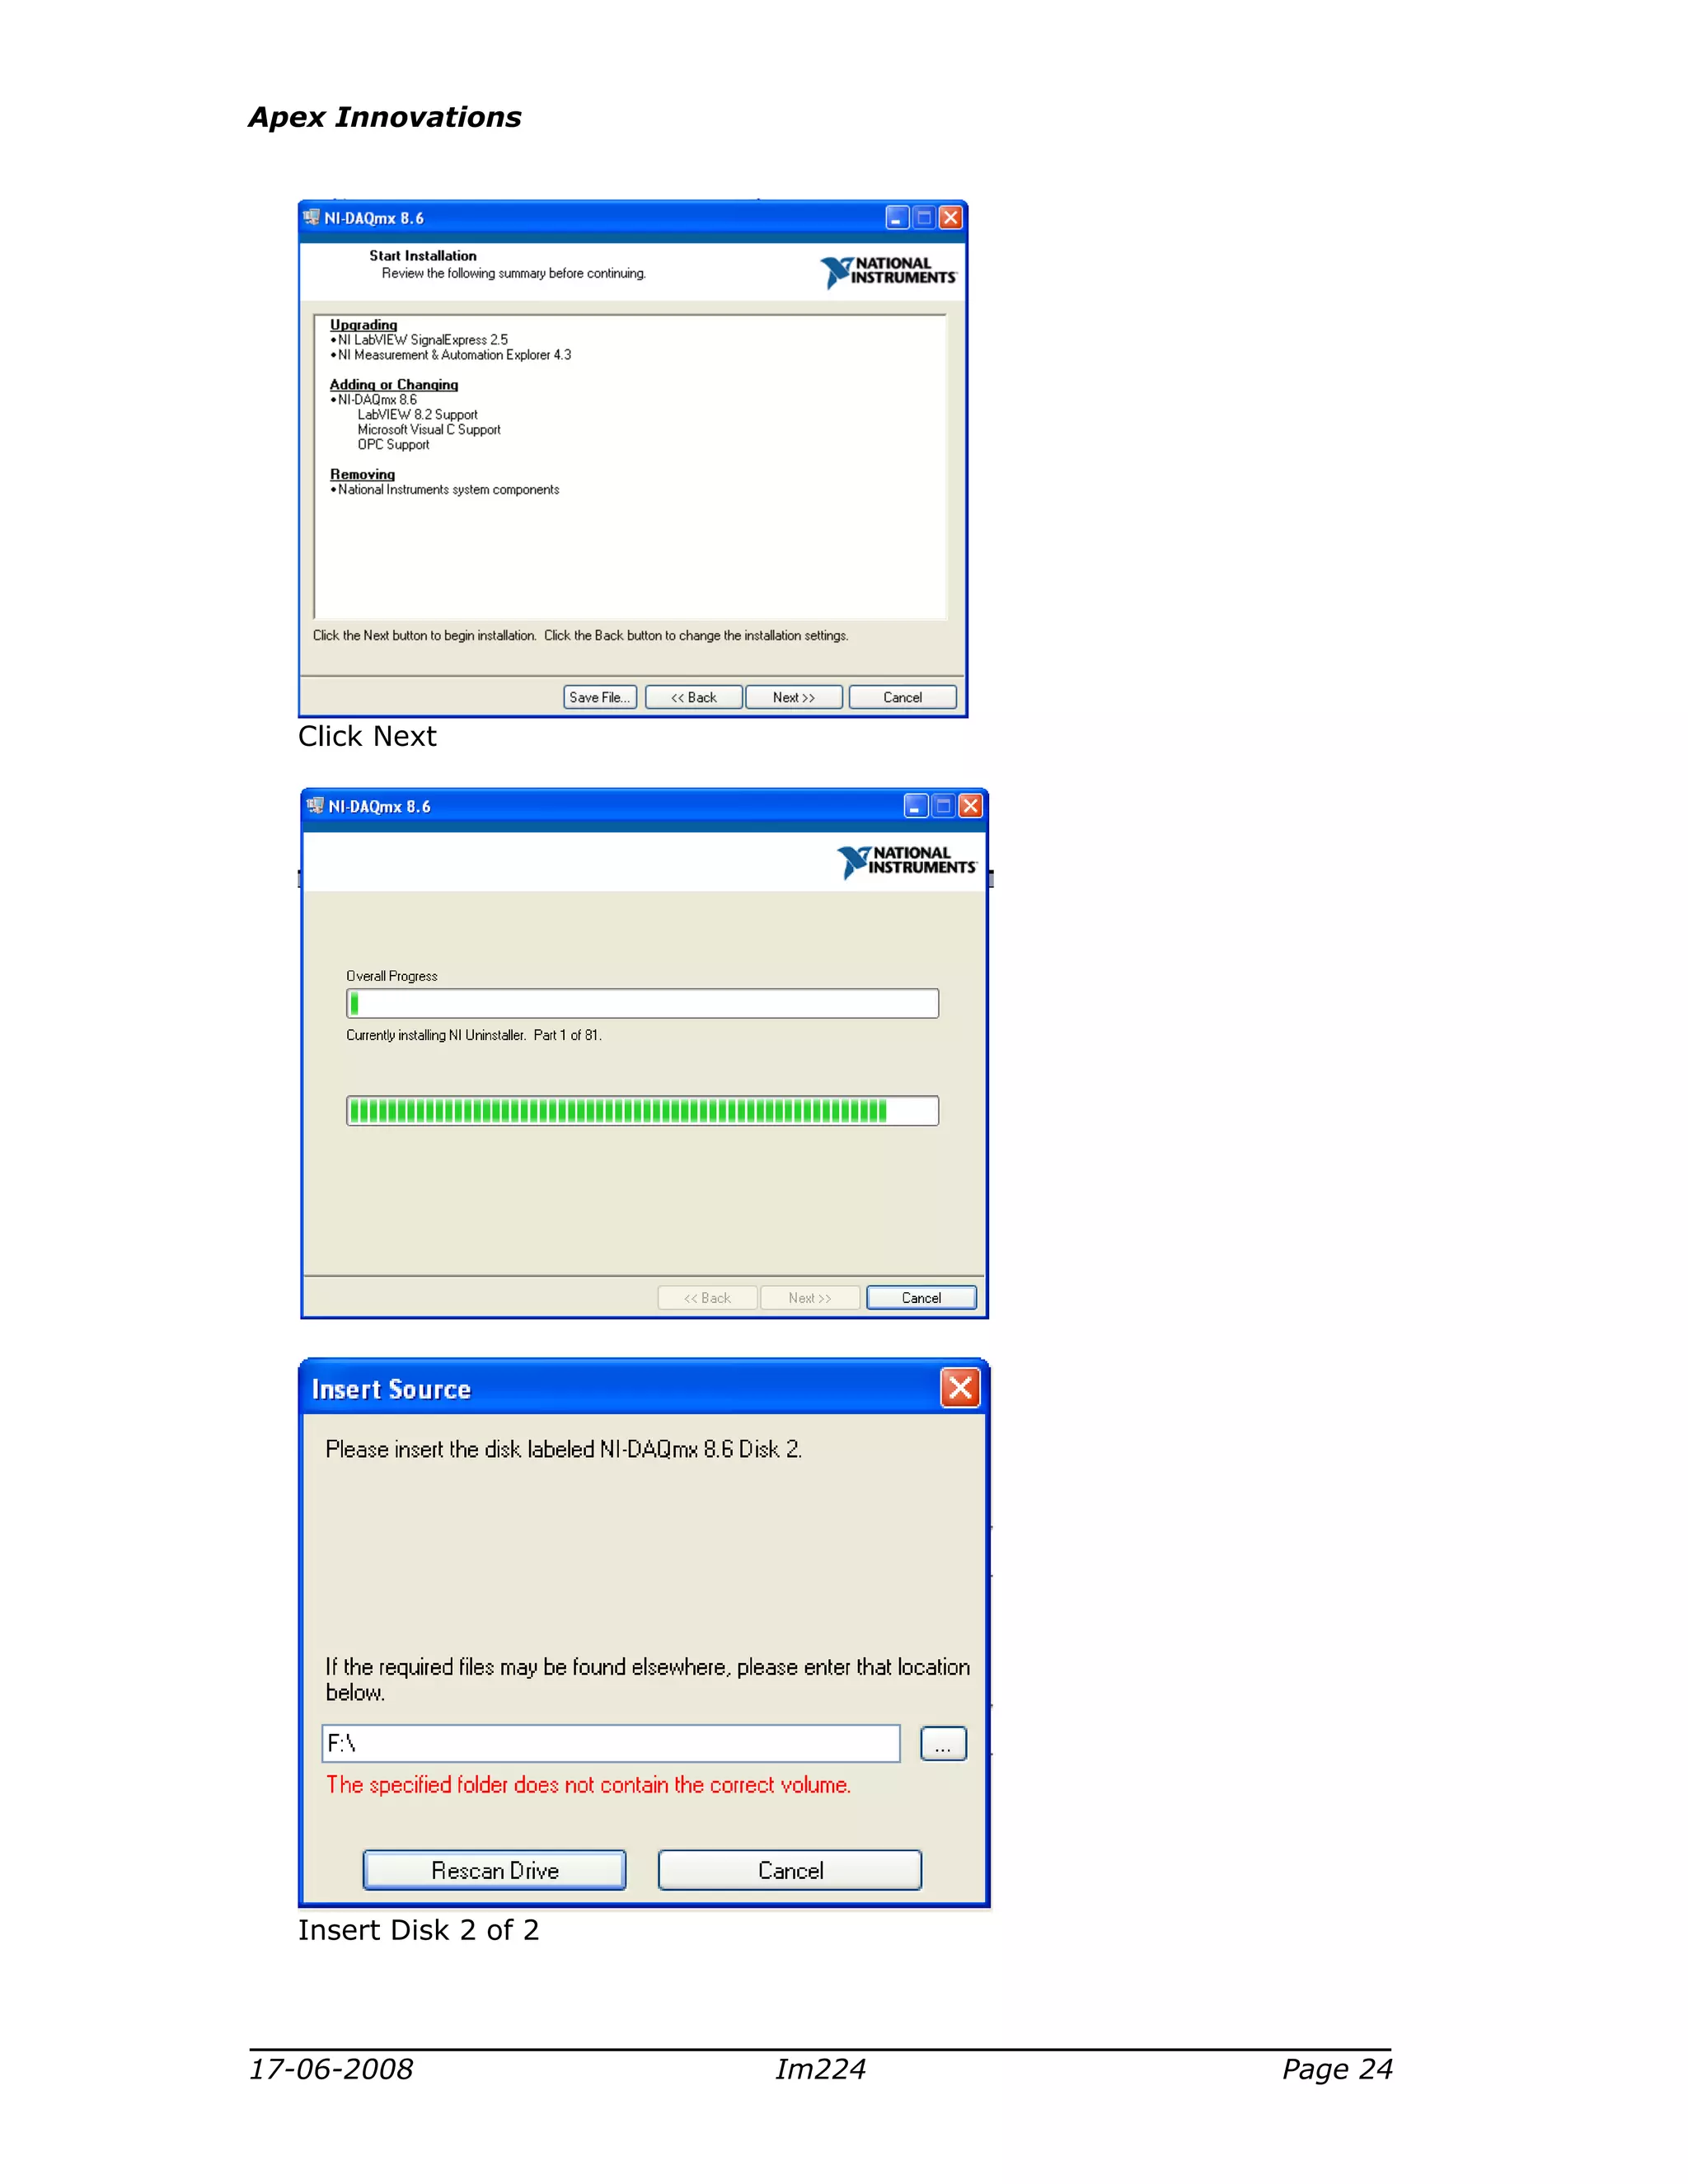
Installing DAQMX Software for Windows XP
Insert NI DAQMX software CD 1 of 2
Click on Install Software
Software
Apex Innovations
17-06-2008 Im224Page 26
Installing USB-6210 Driver
1. Connect USB 6210 to Computer USB port.
Following screen shall appear
2 Select No, not this time & click next
3 Select install the software automatically (Recommended) & click next
27.
Apex Innovations
17-06-2008 Im224Page 27
6. Click Next
6. Click Finish
Conducting Test Run
• Confirm USB cable (From USB-6210 driver to computer USB port) are connected
and engine panel is switched on.
• Click “EngineSoftLV” and then “Run”.
• Click on “File open” screen.
• Click on “Config Setup” screen.
• The current parameter values are displayed on the screen. Note that speed =0 as
engine is not started. Confirm correctness of other parameter values
28.
Apex Innovations
17-06-2008 Im224Page 28
(temperatures and load) with the values displayed on multipoint digital voltmeter
provided on control panel. If some problem is noticed at this stage resolve it
before starting the engine.
• Start the engine and observe the values displayed on the screen. A typical screen
is shown below:
• Wait for @ 3 minutes to achieve steady state. Change the fuel cock to
“measuring” and press “Log” for data logging.
After one minute software will prompt for file name. Enter the file name (file name
should not start with numeric character).
29.
Apex Innovations
17-06-2008 Im224Page 29
1 Study of engine performance (Manual mode)
Object
To study the performance of 1 cylinder, 4 stroke, Diesel engine connected to eddy
current dynamometer in manual mode
Procedure
• Ensure cooling water circulation for eddy current dynamometer and piezo
sensor, engine and calorimeter.
• Start the set up and run the engine at no load for 4-5 minutes.
• Gradually increase the load on the engine by rotating dynamometer loading
unit.
• Wait for steady state (for @ 3 minutes) and collect the reading as per
Observations provided in “Cal224” worksheet in “Engine.xls”.
• Gradually decrease the load.
• Fill up the observations in “Cal224” worksheet to get the results and
performance plots.
Experiments
30.
Apex Innovations
17-06-2008 Im224Page 30
2 Study of engine performance (Computerized mode)
Object
To study the performance of 1 cylinder, 4 stroke, Diesel engine connected to eddy
current dynamometer in computerized mode.
Procedure
• Ensure cooling water circulation for eddy current dynamometer and piezo
sensor, engine and calorimeter.
• Start the set up and run the engine at no load for 4-5 minutes.
• Switch on the computer and run “EnginesoftLV”. Confirm that the
EnginesoftLV configuration data is as given below.
• Gradually increase load on the engine.
• Wait for steady state (for @ 3 minutes) and log the data in the
“EnginesoftLV”.
• Gradually decrease the load.
• View the results and performance plots in “EnginesoftLV”.
Enginesoft Configuration data
Set up constants:
No of PO cycles : 5
Cylinder pressure plot ref : 2010
Fuel read time : 60 sec
Fuel factor : 0.012 kg/Volt
Orifice diameter : 20 mm
Dynamometer arm length : 185 mm
Engine and set up details:
Engine power : 5.2 Kw
Engine max speed : 1500 RPM
Cylinder bore : 87.5mm
Stroke length : 110mm
Connecting rod length : 234mm
Compression ratio : 17.5
Compression type : FCR
Stoke type : Four
No. of cylinders : One
Speed type : Constant
Cooling type : Water
Dynamometer type : Eddy current
Indicator used type : Cylinder pressure
Data acquisition device : USB-6210
Calorimeter used : Pipe in pipe
Theoretical constants:
Fuel density : 830 kg/m^3
Calorific value : 42000 kJ/kg
Orifice coefficient of discharge : 0.60
Sp heat of exhaust gas : 1.1 kJ/kg-K
Max sp heat of exhaust gas : 1.25 kJ/kg-K
Min sp heat of exhaust gas : 1.1 kJ/kg-K
Specific heat of water : 4.186 kJ/kg-K
Water density : 1000 kg/m^3
Ambient temperature : 300
C
Sensor range
Exhaust gas temp. trans. (Engine) : 0-1200 C
31.
Apex Innovations
17-06-2008 Im224Page 31
Air flow transmitter : (-)250 - 0 mm WC
Fuel flow DP transmitter : 0-500 mm WC
Load cell : 0-50 kg
Sensor signal range (input for interface) : 1-5 V
Cylinder pressure transducer : 0-345.5 bar
32.
Apex Innovations
17-06-2008 Im224Page 32
3 Study of Pressure volume plot and indicated power
Object
To draw pressure–crank angle plot, pressure volume plot and calculate indicated
power of the engine.
Procedure
• Run the engine set up at any load and store the observation in a data file or
use previously stored data file in “EnginesoftLV” for indicated power
calculation.
• Export the data file in ms excel worksheet. The pressure crank angle and
volume data is available in excel.
• Refer “IP_cal” worksheet in “Engine.xls”. The sample worksheet shows
pressure crank angle plot, pressure volume plot and indicated power
calculation. The worksheet is for single cylinder four stroke engine with 180
observations per revolution.
• Copy the pressure readings from exported data file in to the IP
_cal worksheet at the respective crank angle.
• Observe the Pressure crank angle diagram, pressure volume diagram and
indicated power value. (The calculations are explained in theory part).
4 Study of valve timing diagram
Object
To study valve timing diagram
TDC
BDC
Exhaust
Compression
Expansion
Induction
2 4
1 5
3
1 Inlet valve opensbefore TDC : 4.5
2 Inlet valve closes after BDC : 35.5
3 Fuel injection starts before TDC : 23
4 Exhaust valve opens before BDC : 35.5
5 Exhaust valve closes after TDC : 4.5
0
0
0
0
0
Valve Timing Diagram
Engine Kirloskar (TV1) 1Cylinder, 4Stroke, Diesel
Procedure
• Switch off the electric supply of the panel box
• Open the cover on the engine head to see the rocker arms.
• Lift up the decompression lever.
33.
Apex Innovations
17-06-2008 Im224Page 33
• Note the TDC mark provided on the flywheel. (Also refer the valve timing
diagram).
• Slowly rotate the flywheel in clockwise direction looking from dynamometer side.
Identify inlet valve and exhaust valve rocker arms
• Observe the movement of rocker arms and understand the valve opening and
closing.
To observe fuel injection it is necessary to remove fuel injector.
Apex Innovations
17-06-2008 Im224Page 35
Rotameter (PG series)
Rotameter works on the principle of variable area. Float is free to move up & down in
a tapered measuring glass tube. Upward flow causes the float to take up a position in
which the buoyancy forces and the weight are balanced. The vertical position of the
float as indicated by scale is a measurement of the instantaneous flow rate.
Technical specifications
Model PG-1 to 21
Make Eureka Industrial Equipments
Pvt. Ltd.
Flow Rate Max. 4000 to 40000 Lph
Packing/Gaskets Neoprene
Measuring tube Borosilicate glass
Float 316SS
Cover Glass
Accuracy +/-2% full flow
Range ability 10:1
Scale length 175-200mm.
Max. Temp. 2000
C
Connection Flanged and Threaded, Vertical
Principle of operation
The rotameter valves must be opened slowly and carefully to
adjust the desired flow rate. A sudden jumping of the float,
which may cause damage to the measuring tube, must be avoided.
Edge
Fig.1
The upper edge of the float as shown in fig. 1 indicates the rate of flow. For
alignment a line marked R.P. is provided on the scale which should coincide with the
red line provided on measuring tube at the bottom.
Maintenance
When the measuring tube and float become dirty it is necessary to remove the tube
and clean it with a soft brush, trichloroethylene or compressed air.
Dismantling of the measuring tube
• Shut off the flow.
• Remove the front and rear covers.
• Unscrew the gland adjusting screws, and push the gland upwards incase of bottom
gland and downwards incase of top gland. Then remove the glass by turning it to
Components’ manuals
36.
Apex Innovations
17-06-2008 Im224Page 36
and fro. Care should be taken, not to drop down the glands. Float or float
retainers. The indicating edge of the float should not be damaged.
Fitting of the measuring tube
Normally the old gland packing is replaced by new ones while fitting back the
measuring tube.
• Put the glands first in their position and then put the packing on the tube.
• Insert the tube in its place.
• Push the glands downwards and upwards respectively and fix them with the gland
adjusting screws.
• Tighten the gland adjusting screws evenly till the gap between the gland and the
bottom plate is approximately 1mm. In case, after putting the loflometer into
operation, still there is leakage, then tighten the gland adjusting screw till the
leakage stops.
• Fix the scale, considering the remark given in the test report.
• Fix the front and rear covers.
Troubleshooting
Problem Check
Leakage on glands Replace gland packing
Showing high/low flow rate than
expected
Consult manufacturers
Showing correct reading initially but
starts showing high reading after
few days
Replace float
Incase of gases, check also leakage
Showing correct reading initially but
starts showing high reading after
some months.
Clean the rotameter by suitable solvent or
soft brush
Fluctuation of float Maintain operating pressure as mentioned
in test report.
Frequent breakage of glass tube Use loflometer to accommodate correct
flow rate.
Maintain operating pressure below
pressure rating of the tube.
Check piping layout.
Manufacturer’s address
If you need any additional details, spares or service support for this unit you may
directly communicate to the manufacturer / Dealer / Indian Supplier.
Eureka Industrial Equipments Pvt. Ltd.
17/20, Royal Chambers,
Paud Road, Pune – 411 038.
Email: eureka.equip@gems.vsnl.net.in
Apex Innovations
17-06-2008 Im224Page 41
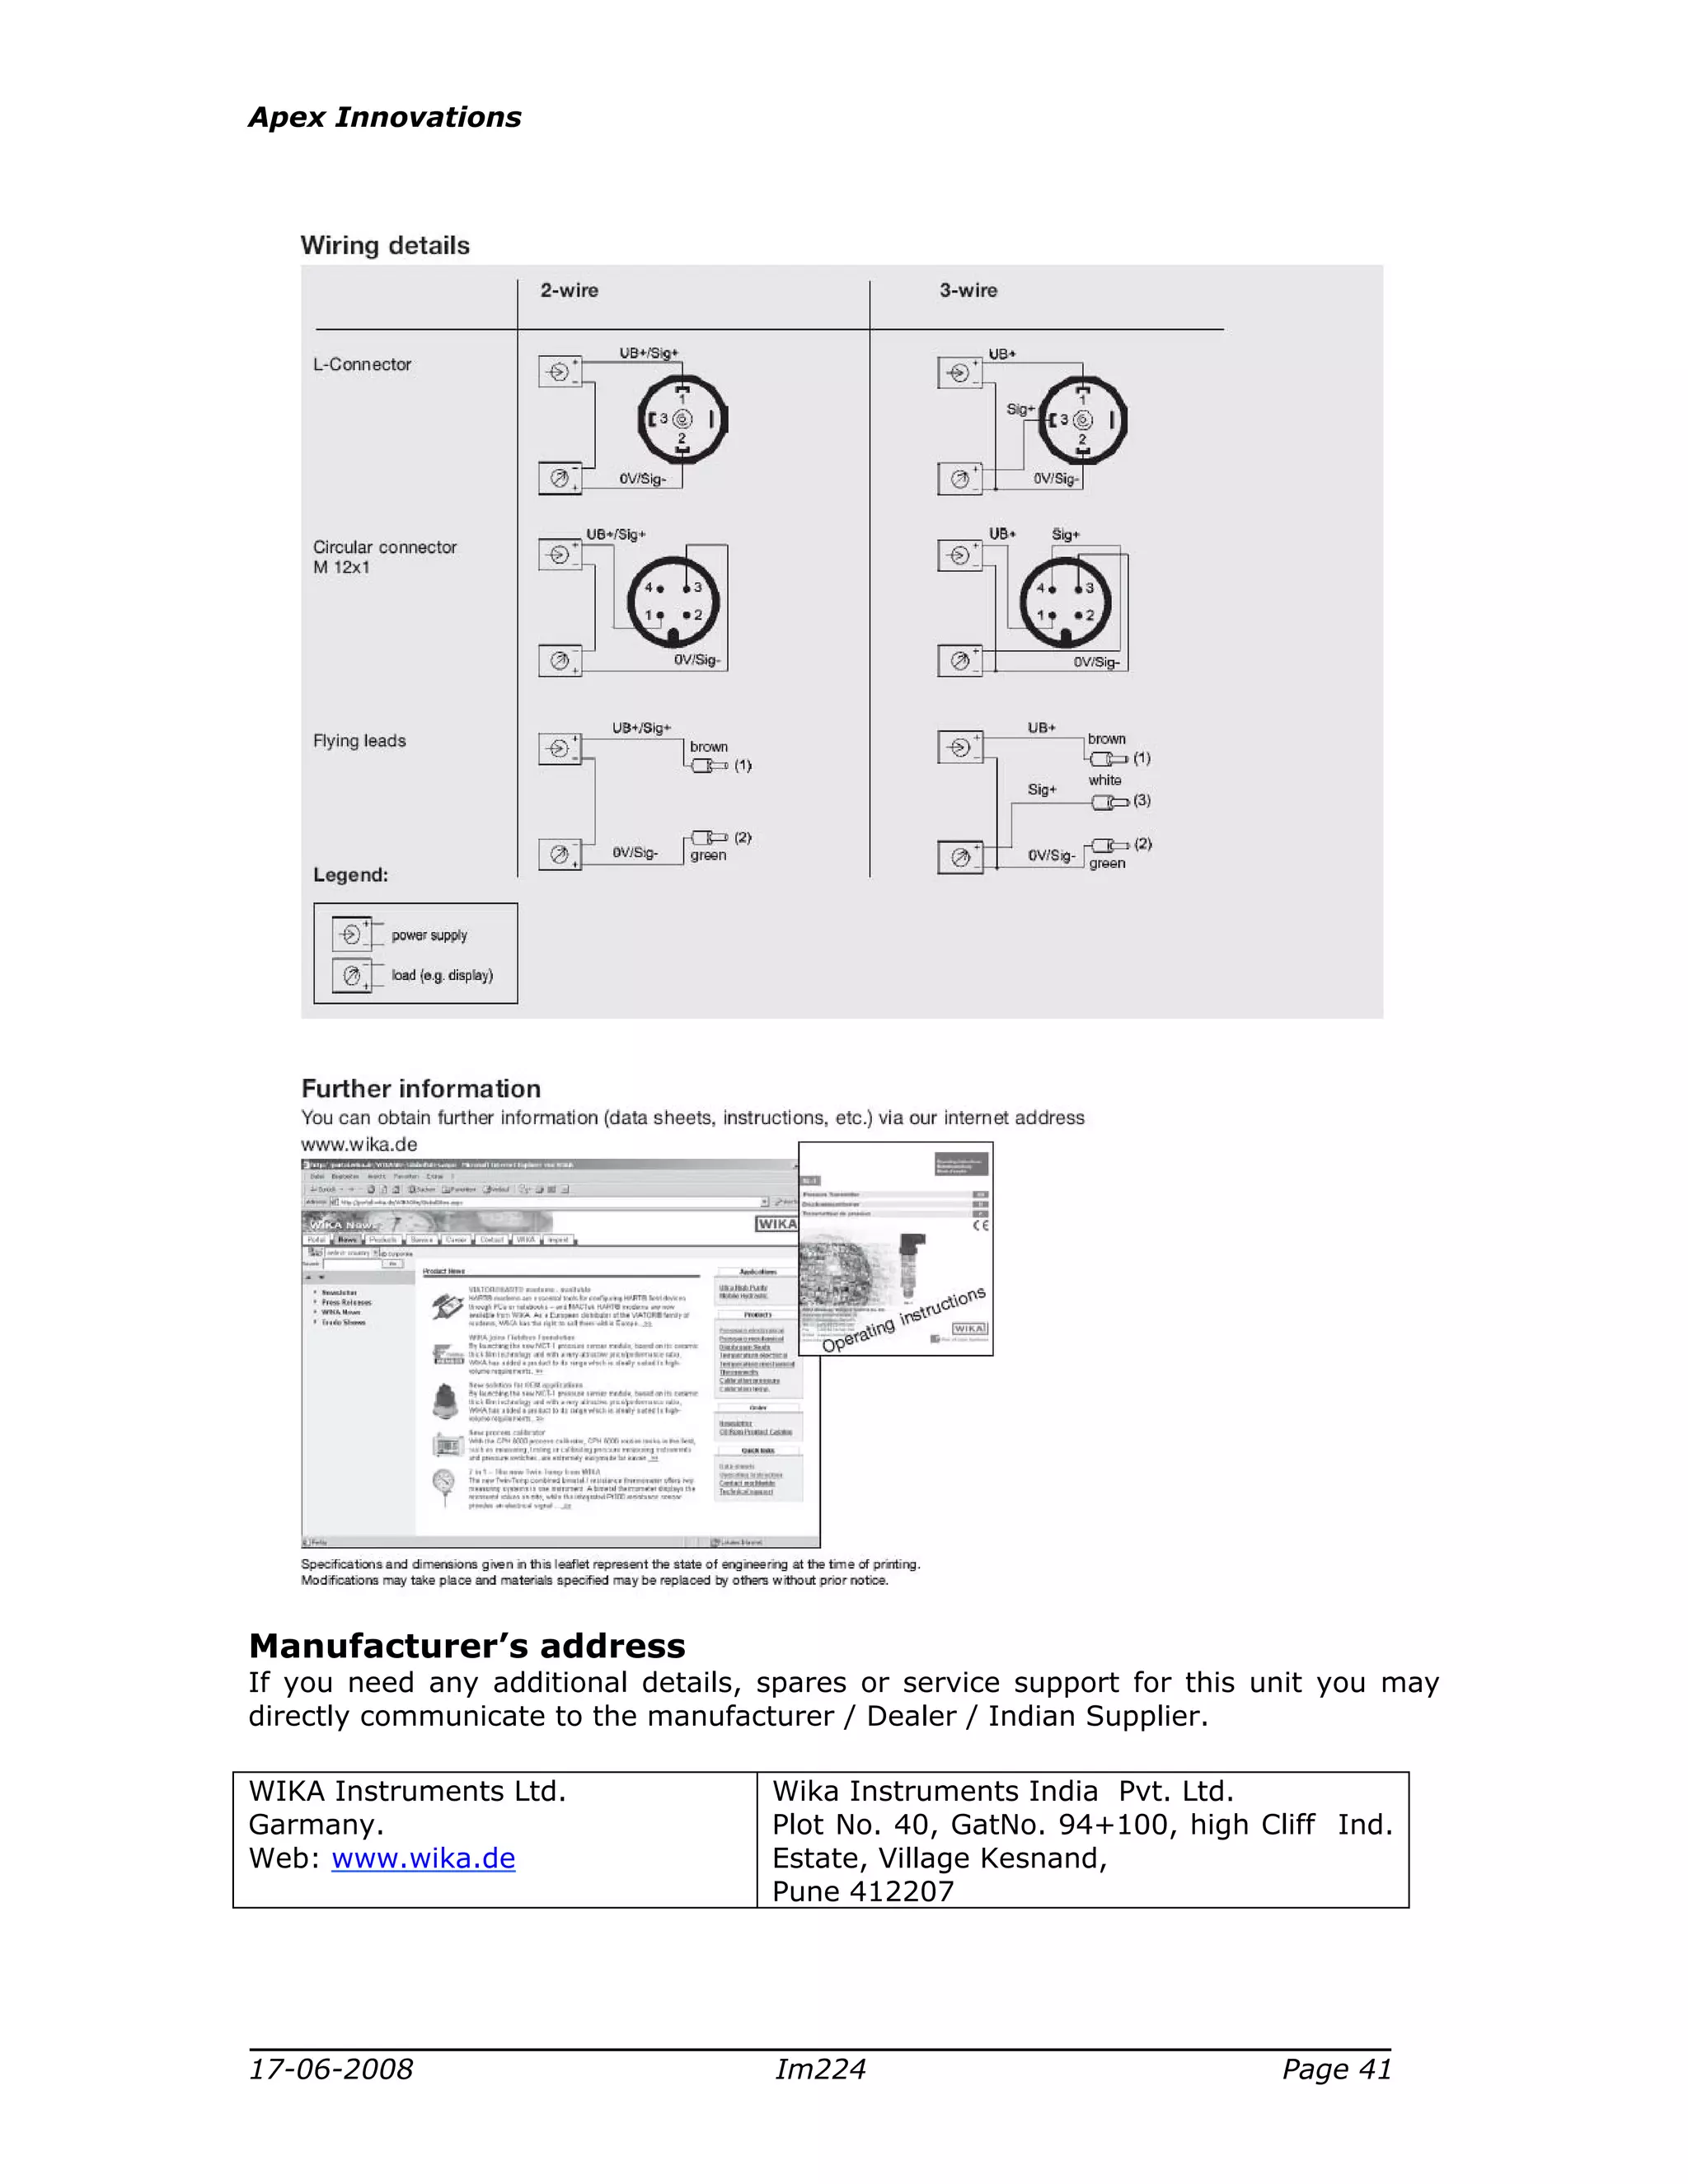
Manufacturer’s address
If you need any additional details, spares or service support for this unit you may
directly communicate to the manufacturer / Dealer / Indian Supplier.
WIKA Instruments Ltd.
Garmany.
Web: www.wika.de
Wika Instruments India Pvt. Ltd.
Plot No. 40, GatNo. 94+100, high Cliff Ind.
Estate, Village Kesnand,
Pune 412207
42.
Apex Innovations
17-06-2008 Im224Page 42
Load cell
Introduction
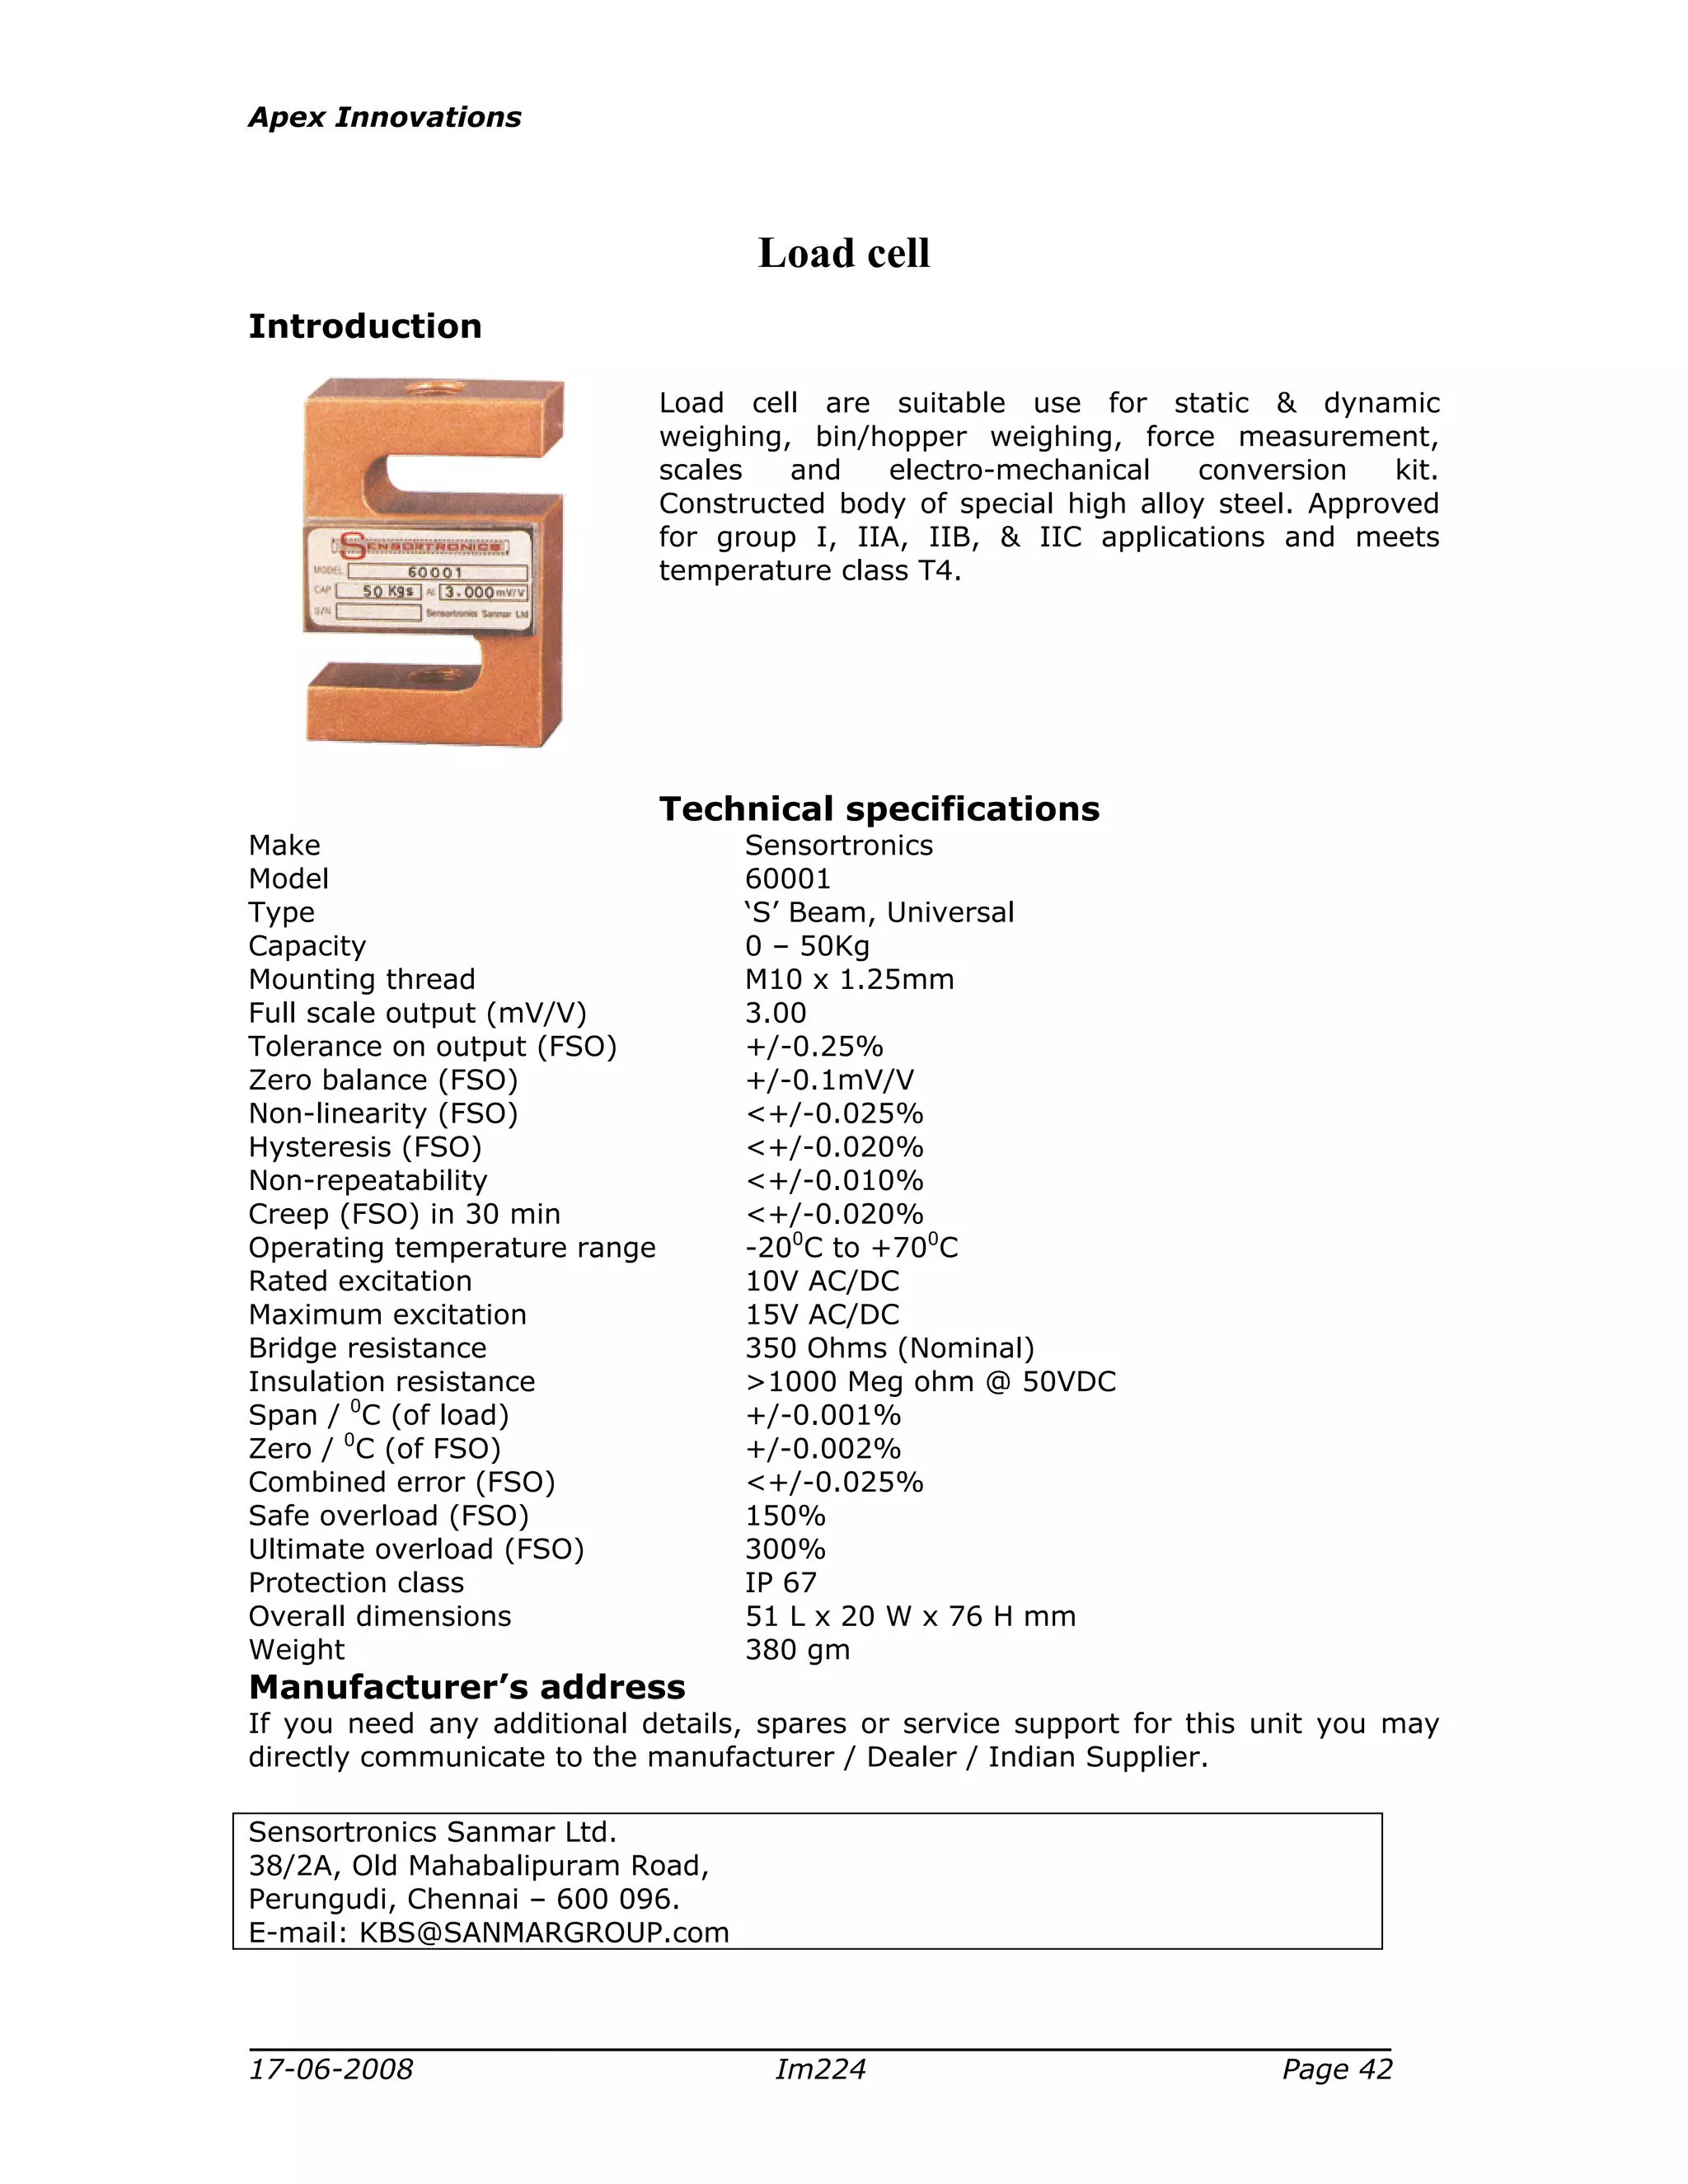
Load cell are suitable use for static & dynamic
weighing, bin/hopper weighing, force measurement,
scales and electro-mechanical conversion kit.
Constructed body of special high alloy steel. Approved
for group I, IIA, IIB, & IIC applications and meets
temperature class T4.
Technical specifications
Make Sensortronics
Model 60001
Type ‘S’ Beam, Universal
Capacity 0 – 50Kg
Mounting thread M10 x 1.25mm
Full scale output (mV/V) 3.00
Tolerance on output (FSO) +/-0.25%
Zero balance (FSO) +/-0.1mV/V
Non-linearity (FSO) <+/-0.025%
Hysteresis (FSO) <+/-0.020%
Non-repeatability <+/-0.010%
Creep (FSO) in 30 min <+/-0.020%
Operating temperature range -200
C to +700
C
Rated excitation 10V AC/DC
Maximum excitation 15V AC/DC
Bridge resistance 350 Ohms (Nominal)
Insulation resistance >1000 Meg ohm @ 50VDC
Span / 0
C (of load) +/-0.001%
Zero / 0
C (of FSO) +/-0.002%
Combined error (FSO) <+/-0.025%
Safe overload (FSO) 150%
Ultimate overload (FSO) 300%
Protection class IP 67
Overall dimensions 51 L x 20 W x 76 H mm
Weight 380 gm
Manufacturer’s address
If you need any additional details, spares or service support for this unit you may
directly communicate to the manufacturer / Dealer / Indian Supplier.
Sensortronics Sanmar Ltd.
38/2A, Old Mahabalipuram Road,
Perungudi, Chennai – 600 096.
E-mail: KBS@SANMARGROUP.com
43.
Apex Innovations
17-06-2008 Im224Page 43
Encoder
Technical specifications
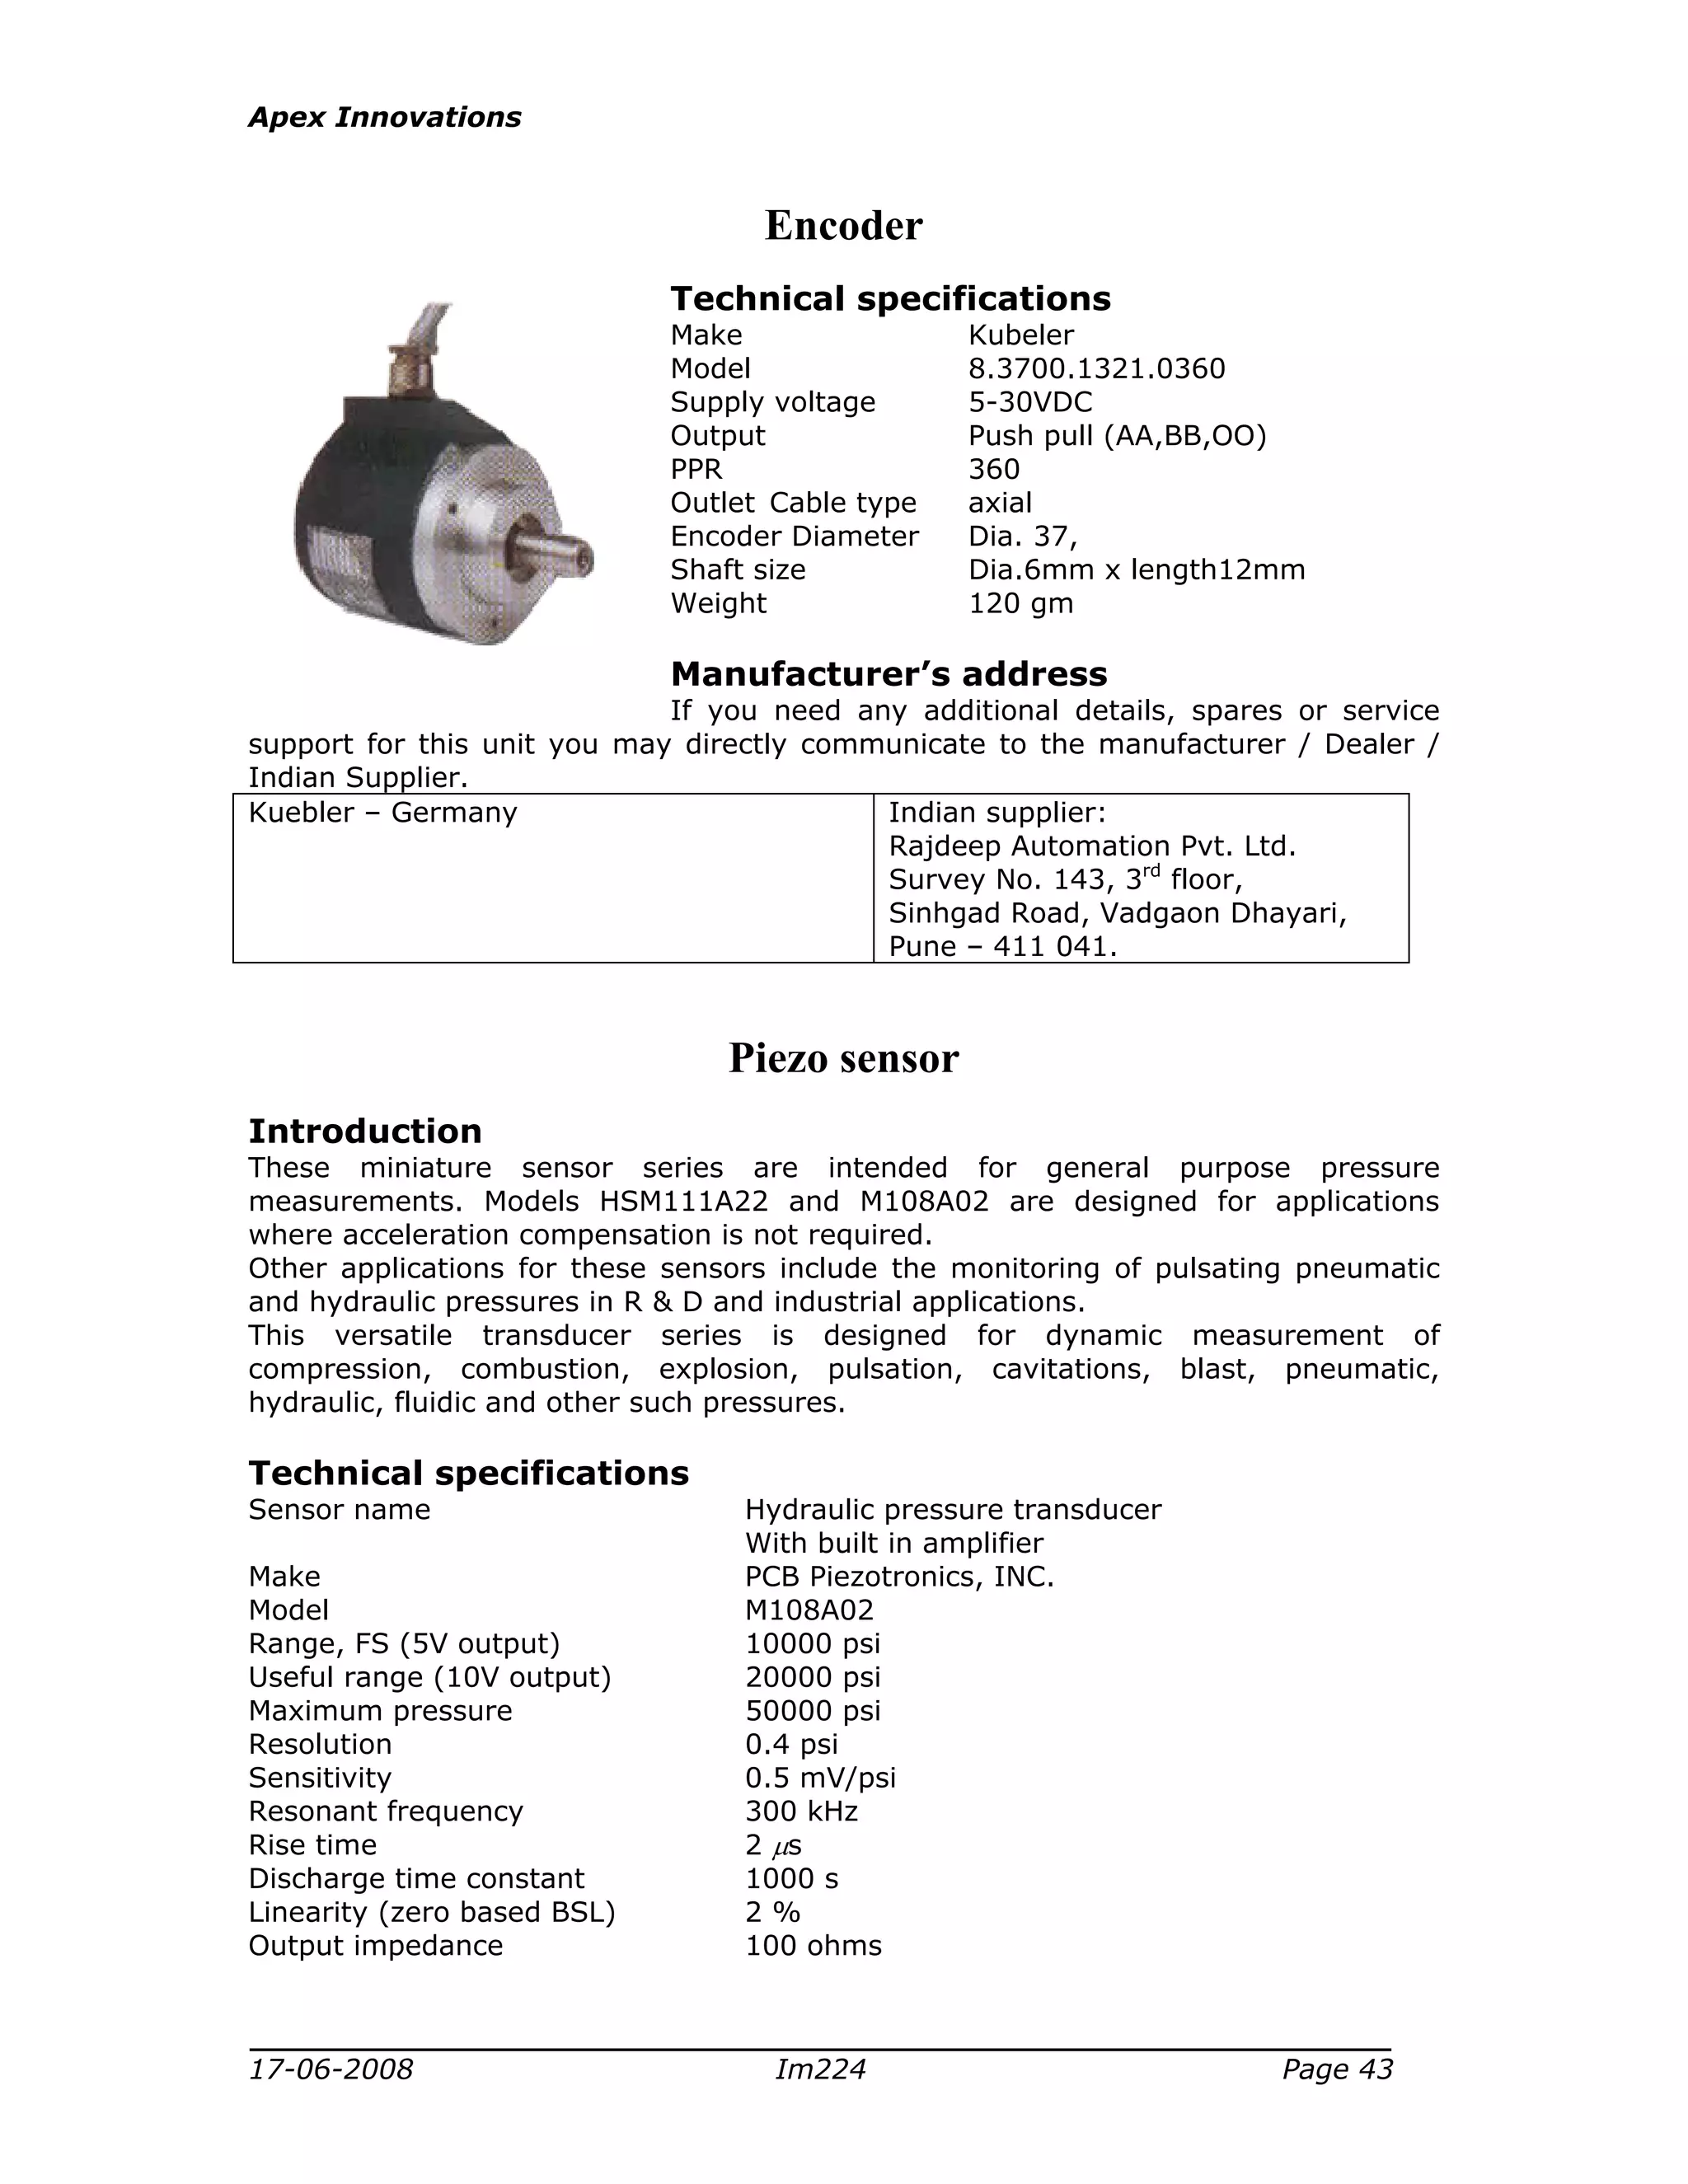
Make Kubeler
Model 8.3700.1321.0360
Supply voltage 5-30VDC
Output Push pull (AA,BB,OO)
PPR 360
Outlet Cable type axial
Encoder Diameter Dia. 37,
Shaft size Dia.6mm x length12mm
Weight 120 gm
Manufacturer’s address
If you need any additional details, spares or service
support for this unit you may directly communicate to the manufacturer / Dealer /
Indian Supplier.
Kuebler – Germany Indian supplier:
Rajdeep Automation Pvt. Ltd.
Survey No. 143, 3rd
floor,
Sinhgad Road, Vadgaon Dhayari,
Pune – 411 041.
Piezo sensor
Introduction
These miniature sensor series are intended for general purpose pressure
measurements. Models HSM111A22 and M108A02 are designed for applications
where acceleration compensation is not required.
Other applications for these sensors include the monitoring of pulsating pneumatic
and hydraulic pressures in R & D and industrial applications.
This versatile transducer series is designed for dynamic measurement of
compression, combustion, explosion, pulsation, cavitations, blast, pneumatic,
hydraulic, fluidic and other such pressures.
Technical specifications
Sensor name Hydraulic pressure transducer
With built in amplifier
Make PCB Piezotronics, INC.
Model M108A02
Range, FS (5V output) 10000 psi
Useful range (10V output) 20000 psi
Maximum pressure 50000 psi
Resolution 0.4 psi
Sensitivity 0.5 mV/psi
Resonant frequency 300 kHz
Rise time 2 µs
Discharge time constant 1000 s
Linearity (zero based BSL) 2 %
Output impedance 100 ohms
44.
Apex Innovations
17-06-2008 Im224Page 44
Acceleration sensitivity 0.01 psi/g
Temperature coefficient 0.03 %/0
F
Temperature range -100 to +250 0
F
Vibration 2000 g peak
Shock 20000 g peak
Sealing Hermetic welded
Excitation (Constant current) 2 to 20 mA
Voltage to current regulator +18 to 28 VDC
Sensing geometry Compression
Sensing element Quartz
Housing material C-300
Diaphragm C-300
Electrical connector 10-32 coaxial jack
Mounting thread M10 x 0.1pitch
Weight 12 gm
Cable model 002C20 white coaxial cable
Technical specifications
Sensor name Dynamic pressure transducer
With built in amplifier
Make PCB Piezotronics, INC.
Model M111A22
Range, FS (5V output) 5000 psi
Useful range (10V output) 10000 psi
Maximum pressure 15000 psi
Resolution 0.1 psi
Sensitivity 1 mV/psi
Resonant frequency 400 kHz
Rise time 2 µs
Discharge time constant 500 s
Low frequency response (-5%) 0.001 Hz
Linearity (Best straight line) 2 %
Output polarity Positive
Output impedance 100 ohms
Output bias 8-14 volt
Acceleration sensitivity 0.002 psi/g
Temperature coefficient 0.03 %/0
F
Temperature range -100 to +275 0
F
Flash temperature 3000 0
F
Vibration / Shock 2000 / 20000 g peak
Ground isolation No (2)
Excitation (Constant current) 2 to 20 mA
Voltage to current regulator +18 to 28 VDC
Sensing geometry Compression
Sensing element Quartz
Housing material 17.4 SS
Diaphragm Invar
Sealing Welded hermetic
Electric connector 10-32 coaxial jack
Mounting thread M7 x 0.75 pitch
Weight (with clamp nut) 6 gm
Cable model 002C20 white coaxial cable
45.
Apex Innovations
17-06-2008 Im224Page 45
Principle of operation
1. Hydraulic pressure transducer: Unlike conventional diaphragm type sensors,
the 108A is pressure sensitive over the entire frontal area. For this reason, extra
care should be exercised to avoid bottoming in mounting hole when recessed
mounted and especially when mounting into existing mounting ports. A torque
wrench should be used to monitor the mounting torque valve when installing the
series 108A.
• Mounting in existing recessed ports: Before installing the sensor in previously
used mounting ports, clean off residue from previous tests. This can be
accomplished by hand reaming the required size reamer. During prolonged testing,
should waveform distortion occur, Remove sensor and remove reside.
• Flash Temperature Effects: The ceramic coating on the diaphragm of these
sensors should render the flash thermal effect insignificant in most cases,
especially when recessed mounted. However, if more protection from flash thermal
effects is required with the recessed mount, the passage can be filled with silicone
grease (DC-4 or equivalent). Several layers of black vinyl electrical tape directly on
the diaphragm have proven effective in many cases. Flash temperature effects are
usually longer term and will show up as baseline shift long after the event to be
measured has passed. For flush mount installations, a silicone rubber coating
approximately 0.010” thick can be effective. General electric RTV type 106 silicone
rubbers are recommended.
2. Dynamic pressure transducer: It is necessary only to supply the sensor with a
2 to 20 mA constant current at +20 to +30 VDC through a current – regulating
diode or equivalent circuit. Most of the signal conditioners manufactured by PCB
have adjustable current features allowing a choice of input currents from 2 to 20
mA. In general, for lowest noise (best resolution), choose the lower current
ranges. When driving long cables (to several thousand feet), use the higher
current, up to 20 mA maximum.
Switch power on and observe reading of bias monitoring voltmeter on front panel
of power unit.
• Flash Temperature Protection
Where flash temperatures such as those generated by combustion processes are
present, it may be necessary to thermally insulate the diaphragm to minimize
spurious signals generated by these effects.
Common black vinyl electrical tape has been found to be an effective insulating
material in many cases. One or more layers may be used across the end of the
diaphragm without affecting response or sensitivity.
A silicone rubber coating approximately 0.010 inches thick has also been proven
effective in many applications. General electric RTV type 106 silicone rubbers are
recommended.
• Low Frequency Response
• The discharge time constant of the sensor.
• If AC – coupled at the power unit, the coupling time constant.
Depending upon the sensor’s built-in discharge time constant, repetitive output
signals slowly or rapidly move toward a stable condition where the average signal
level corresponds to a zero voltage position.
In this position, the area contained by the signal above zero is equalized with the
area below zero. Such output signal behavior is typical of an AC-coupled system.
Since the signal output from the sensor is inherently AC coupled, any static
pressure influence applied to the unit will decay away according to the nature of
the system’s discharge time constant.
46.
Apex Innovations
17-06-2008 Im224Page 46
Troubleshooting
Problem Check
No signal • Remove sensor and clean by dampened cloth
Sensor damaged or ceases to
operate
• Return the equipment to company for repair
Calibration
1. Piezoelectric sensors are dynamic devices, but static calibration techniques
can be employed if discharge time constants are sufficiently long. Generally,
static calibration methods are not employed when testing sensors with a
discharge time constant that is less than several hundred seconds.
2. Direct couple the sensor to the DVM readout using a T-connector from the
“Xducer” jack or use the model 484B in the calibrate mode.
3. Apply pressure with a dead weight tester and take reading quickly. Release
pressure after each calibration point.
4. For shorter TC series, rapid step functions of pressure are generated by a
pneumatic pressure pulse calibrator or dead weight tester and readout is by
recorder or storage oscilloscope.
Manufacturer’s address
If you need any additional details, spares or service support for this unit you may
directly communicate to the manufacturer / Dealer / Indian Supplier.
PCB Piezotronics, Inc.
3425 Walden Avenue,
Depew, New York 14043-2495.
E-mail: pressure@pcb.com
Web: www.pcb.com
Indian supplier:
Structural soluction (India) Pvt. Ltd.
Eddy Current Dynamometer
Introduction
The AG Series eddy current dynamometers designed for the testing of engines up to
400kW (536bhp) and may be used with various control systems. The dynamometer
is bi-directional. The shaft mounted finger type rotor runs in a dry gap. A closed
circuit type cooling system permits for a sump.
Dynamometer load measurement is from a strain gauge load cell and speed
measurement is from a shaft mounted sixty tooth wheel and magnetic pulse pick up.
Technical specifications
Model AG10
Make Saj Test Plant Pvt. Ltd.
End flanges both side Cardon shaft model 1260 type A
Water inlet 1.6bar
Minimum kPa 160
Pressure lbf/in2
23
Air gap mm 0.77/0.63
Torque Nm 11.5
Hot coil voltage max. 60
Continuous current amps 5.0
47.
Apex Innovations
17-06-2008 Im224Page 47
Cold resistance ohms 9.8
Speed max. 10000rpm
Load 3.5kg
Bolt size M12 x 1.75
Weight 130kg
Technical specifications
Model AG20
Make Saj Test Plant Pvt. Ltd.
End flanges both side Cardon shaft model 1260 type A
Water inlet 1.6bar
Minimum kPa 160
Pressure lbf/in2
23
Air gap mm 0.88/0.72
Torque Nm 11.5
Hot coil voltage max. 60
Continuous current amps 5.0
Cold resistance ohms 9.8
Speed max. 10000rpm
Load 5.0Kg
Bolt size M12 x 1.75
Weight 220Kg
Technical specifications
Model AG80
Make Saj Test Plant Pvt. Ltd.
End flanges both side Cardon shaft model 1260 type A
Water inlet 1.0bar
Minimum kPa 100
Pressure lbf/in2
14.5
Air gap mm 1.047/0.855
Torque Nm 11.5
Hot coil voltage max. 75
Continuous current amps 5.0
Cold resistance ohms 12.8
Speed max. 9000rpm
Load 40kg
Bolt size M16 x 2.00
Weight 330kg
Principle of operation
1. The dynamometer unit comprises basically a rotor mounted on a shaft running in
bearings which rotates within a casing supported in ball bearing trunnions which
form part of the bed plate of the machine.
2. Secured in the casing are two field coils connected in series. When these coils are
supplied with a direct current (DC) a magnetic field is created in the casing across
the air gap at either side of the rotor. When the rotor turns in this magnetic field,
eddy currents are induced creating a breaking effect between the rotor and casing.
The rotational torque exerted on the casing is measured by a strain gauge load cell
incorporated in the restraining linkage between the casing and dynamometer bed
plate.
3. To prevent overheating of the dynamometer a water supply pressurized to
minimum indicated in specification is connected to a flanged inlet on the bed plate.
Water passes from the inlet to the casing via a flexible connection; permitting
48.
Apex Innovations
17-06-2008 Im224Page 48
movement of the casing. Water passes through loss (Grooved) plates in the casing
positioned either side of the rotor and absorbs the heat generated.
4. Heated water discharges from the casing through a flexible connection to an outlet
flange on the bed plate. An orifice plate is fitted at the bed plate outlet and a
DIFFERENTIAL pressure switch is connected to water passages either side of the
plate. The switch detects a COOLANT FLOW and will function with a free discharge or
under back pressure.
Troubleshooting
Problem Check
Calibration of dynamometer not coming
in accuracy limit
• Remove the obstruction for the free
movement of casing
• Calibrate the weights from
authorized source.
• Maintain constant water flow
• Clean & lubricate properly with
grease
• Bearings clean & refit properly
• Load cell link tighten properly
• Clean & refit trunnion bearings
Vibrations to dynamometer • Dynamometer foundation bolts
tighten properly
• Arrest engine vibrations
Abnormal noise • Cardon shaft cover secure properly
• Align guard properly
• Replace rotor if warped
• Replace main bearing
Loss plate temperature high • Check correct water flow
• De-scale with suitable solution
• Clear off water passages
Bearing temperature high • Grease with proper brand
• Remove excess grease & avoid over
grease
• Use specified grease and do not mix
two types of grease
• Clear the drain
• Replace the bearings
• Replace shaft & coupling
Dynamometer not rotating • Replace bearings
• Replace rotor / loss plates after
checking
Water leakages at various locations • Replace casing ‘o’ rings
• Loss plates bolts tighten properly
• Replace loss plate ‘o’ rings
• Casing plugs tighten properly
• Replace pipe ‘o’ rings
• Pressure switch connection tighten
properly
Calibration
1. It is important to note that the torque applied during calibration is:
Nm = applied weight (kg) x g x arm length (m) S.I. units
Lbf.ft = applied weight (ibf) x arm length (ft) Imperial units
Kg.m = applied weight (kg) x arm length (m) MKS units
49.
Apex Innovations
17-06-2008 Im224Page 49
2. Switch on the mains electrical supply to the control equipment at least 30
minutes before starting the calibration procedure.
3. Turn on the water supply and allow water to flow through the dynamometer
at normal operating pressure.
4. With no load applied to the dynamometer ensure that the load indicator on
the control unit reads “ZERO” if necessary adjust the control equipment until
“ZERO” is indicated.
Operation
1. New dynamometers are run in before delivery to ensure that all components
run smoothly and grease is evently distributed within the shaft bearings.
2. The dynamometer has been calibrated the power developed by the engine on
test may be calculated using the following formula:
Power (kW) = unitsIinS
RadiansxSpeedNmTorque
..
1000
.)sec/()(
Power (hp) = itsimperialunin
RadiansxSpeedlbfftTorque
.
550
.)sec/()(
3. The dynamometer will be calibrated in either Imperial or S.I. units or MKS as
specified.
Power =
k
WN
Where N = Shaft speed in rev/min
W = Torque (Indicated on torque indicator)
K = Constant dependant on units of power and torque
Manufacturer’s address
If you need any additional details, spares or service support for this unit you may
directly communicate to the manufacturer / Dealer / Indian Supplier.
Saj Test Plant Pvt. Ltd.
72-76, Mundhwa, Pune Cantonment,
Pune – 411 036.
Email:sajdyno@vsnl.com
Apex Innovations
17-06-2008 Im224Page 52
Differential Pressure Transmitter
Introduction
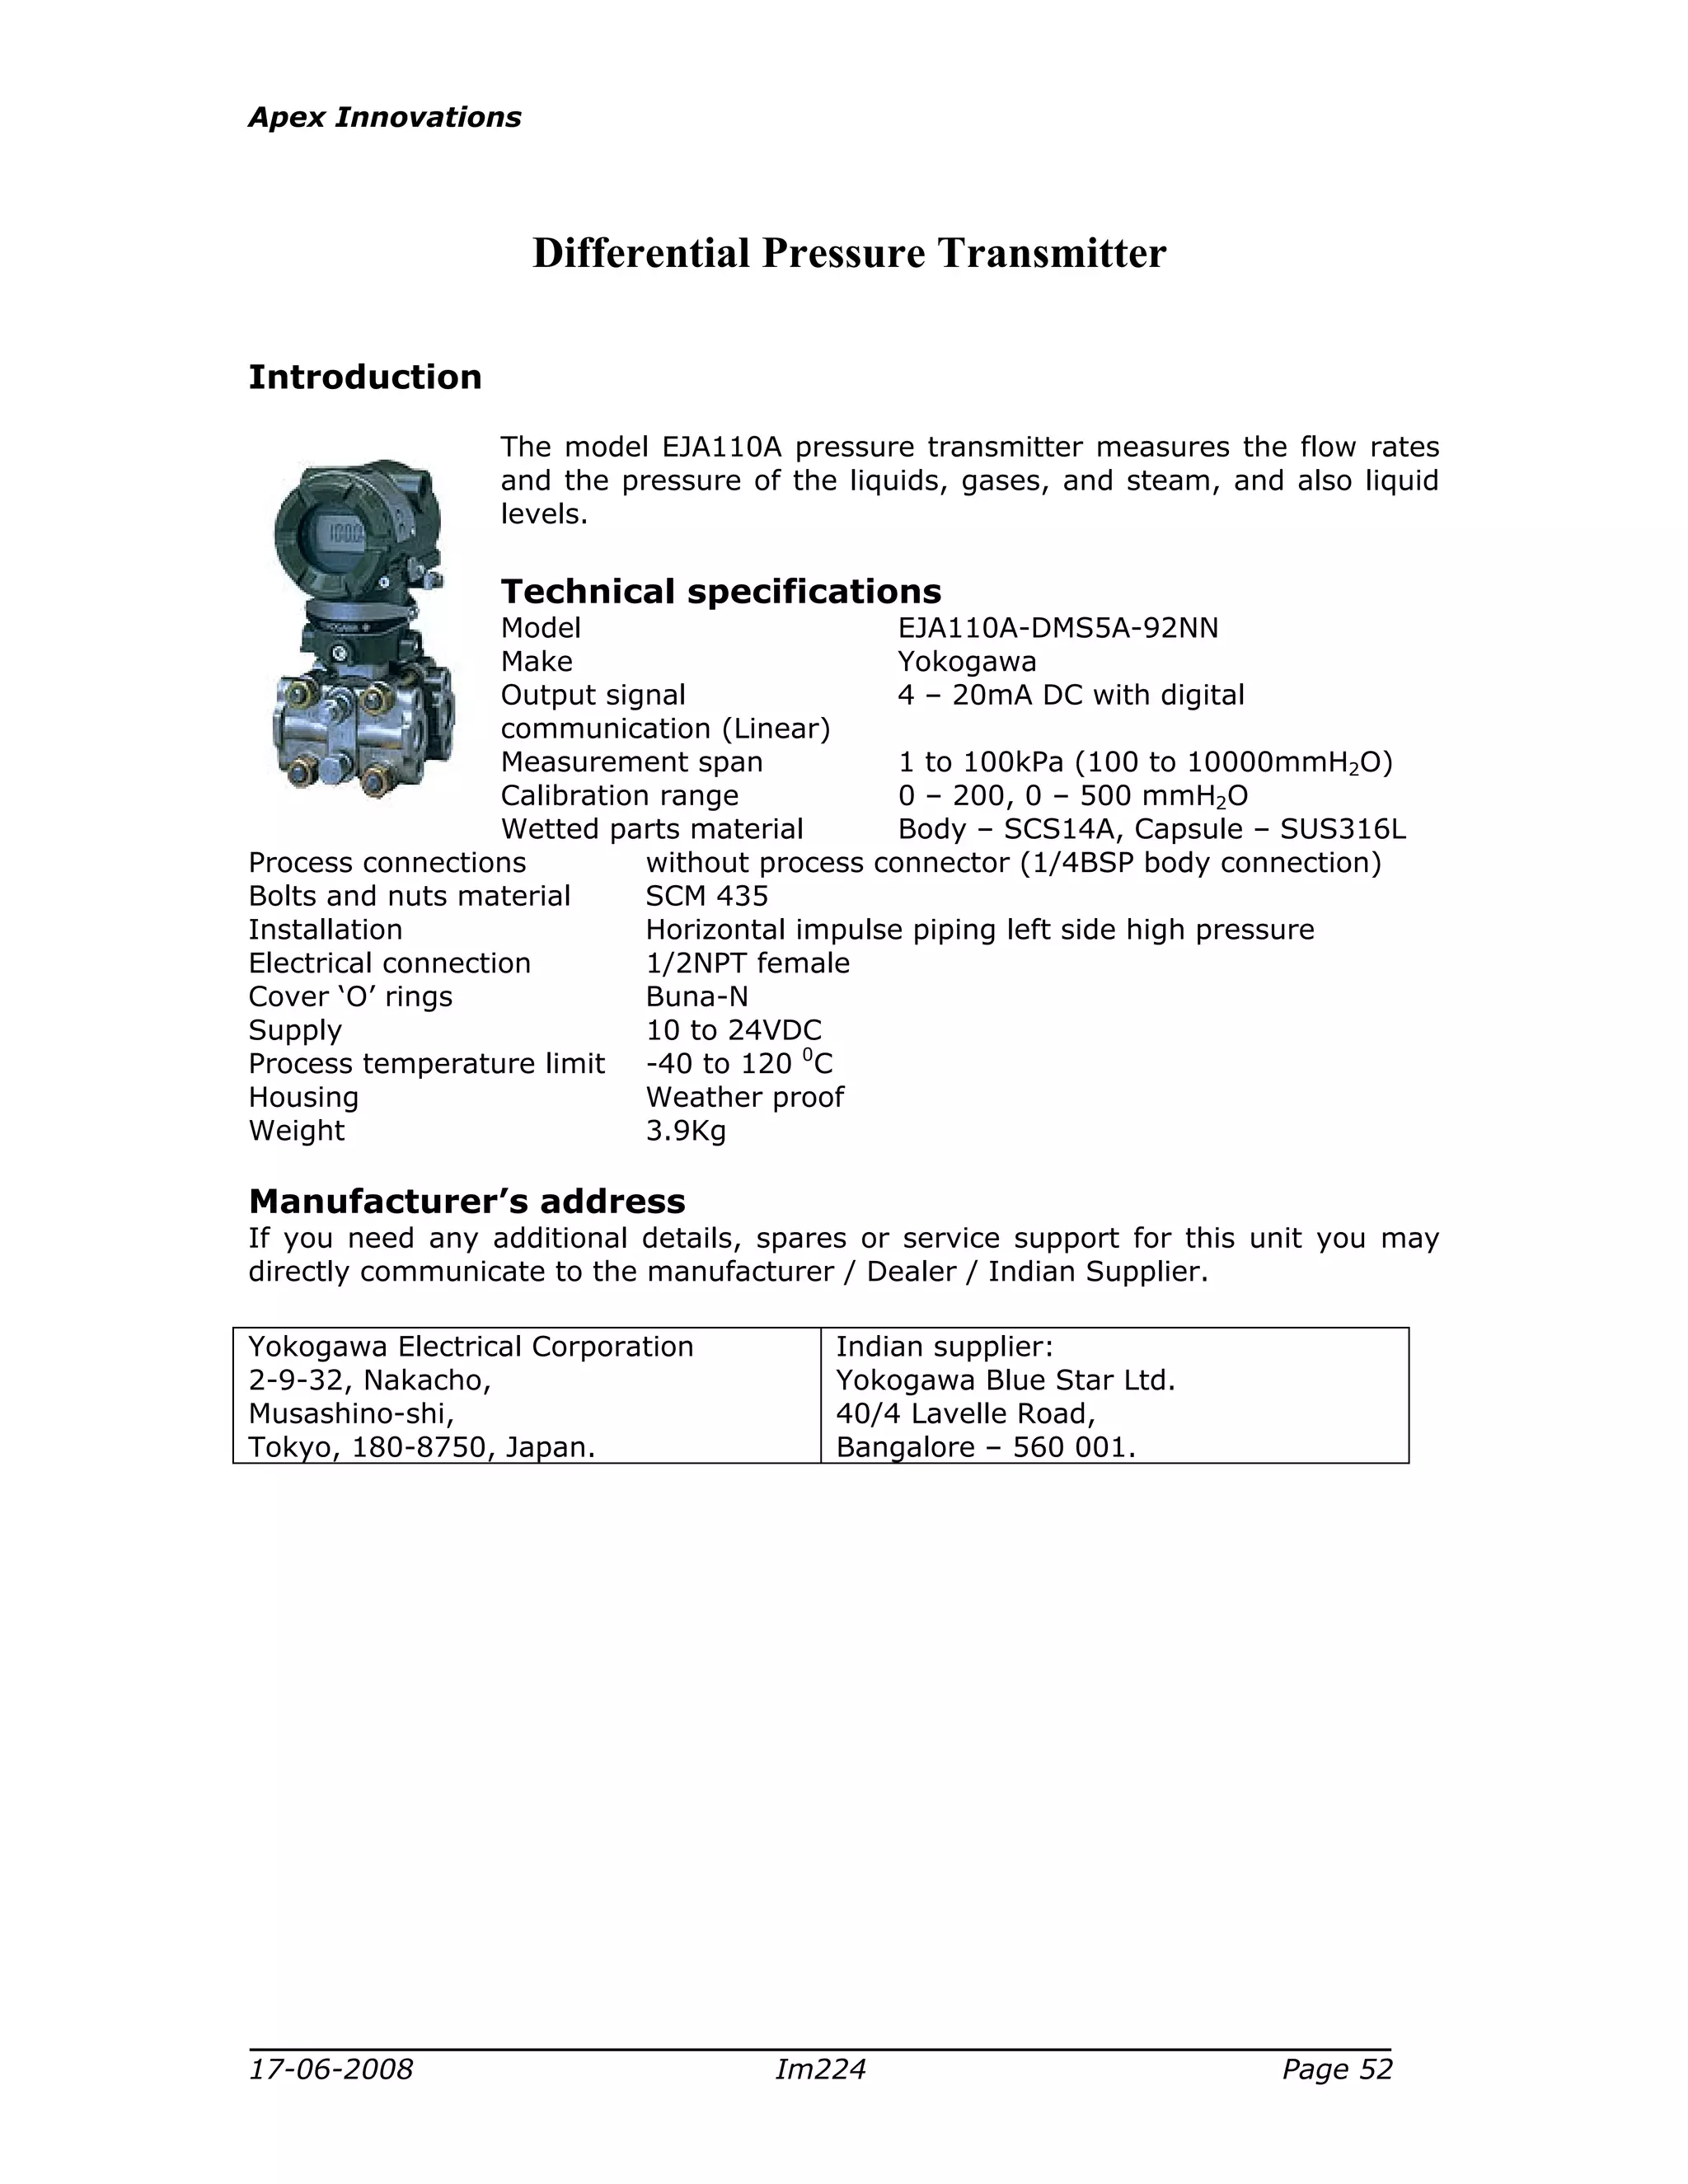
The model EJA110A pressure transmitter measures the flow rates
and the pressure of the liquids, gases, and steam, and also liquid
levels.
Technical specifications
Model EJA110A-DMS5A-92NN
Make Yokogawa
Output signal 4 – 20mA DC with digital
communication (Linear)
Measurement span 1 to 100kPa (100 to 10000mmH2O)
Calibration range 0 – 200, 0 – 500 mmH2O
Wetted parts material Body – SCS14A, Capsule – SUS316L
Process connections without process connector (1/4BSP body connection)
Bolts and nuts material SCM 435
Installation Horizontal impulse piping left side high pressure
Electrical connection 1/2NPT female
Cover ‘O’ rings Buna-N
Supply 10 to 24VDC
Process temperature limit -40 to 120 0
C
Housing Weather proof
Weight 3.9Kg
Manufacturer’s address
If you need any additional details, spares or service support for this unit you may
directly communicate to the manufacturer / Dealer / Indian Supplier.
Yokogawa Electrical Corporation
2-9-32, Nakacho,
Musashino-shi,
Tokyo, 180-8750, Japan.
Indian supplier:
Yokogawa Blue Star Ltd.
40/4 Lavelle Road,
Bangalore – 560 001.


![Apex Innovations
17-06-2008 Im224 Page 17
The figure shows crank-slider mechanism. The piston pin position is given by
φθ coscos lrx +=
From figure φθ sinsin lr = and recalling φφ 2
sin1cos −=
( ){ }
−+= θθ 22
sin1cos lrrlrx
The binomial theorem can be used to expand the square root term:
[ ]{ }...sin)/(81sin)/(
2
11/cos 4422
+−−+= θθθ lrlrrlrx ….1
The powers of sin θ can be expressed as equivalent multiple angles:
θθ 2cos2/12/1sin2
−=
θθθ 4cos8/12cos2/18/3sin4
+−= …….2
Substituting the results from equation 2 in to equation 1 gives
( ) ( )[ ]{ }...4cos8/12cos2/18/3)/(812cos2/12/1)/(
2
11/cos 42
++−−−−+= θθθθ lrlrrlrx
The geometry of the engine is such that ( )2
/lr is invariably less than 0.1, in which
case it is acceptable to neglect the ( )4
/lr terms, as inspection of above equation
shows that these terms will be at least an order of magnitude smaller than
( )2
/lr terms.
The approximate position of piston pin end is thus:
( )[ ]{ }θθ 2cos2/12/1)/(
2
11/cos 2
−−+= lrrlrx
Where r =crankshaft throw and l = connecting rod length.
Calculate x using above equation; then )( xrl −+ shall give distance traversed by
piston from its top most position at any angle θ
II) Morse test: It is applicable to multi-cylinder engines. The engine is run at
desired speed and output is noted. Then combustion in one of the cylinders is
stopped by short circuiting spark plug or by cutting off the fuel supply. Under this
condition other cylinders “motor” this cylinder. The output is measured after
adjusting load on the engine to keep speed constant at original value. The difference
in output is measure of the indicated power of cut-out cylinder. Thus for each
cylinder indicated power is obtained to find out total indicated power.
VCR Engines
The standard available engines (with fixed compression ratio) can be modified by
providing additional variable combustion space. This is done by welding a long hollow
sleeve with internal threads to the engine head. A threaded plug is inserted in the
sleeve to vary the combustion chamber volume. With this method the compression
ratio can be changed within designed range.](https://image.slidesharecdn.com/im224-180723124843/75/engine-specification-17-2048.jpg)