Using K-means algorithm classifier for urban landscapes classification in Tai...Universität Salzburg
Current presentation summarizes spatial analysis studies of Taipei urban growth using ENVI GIS based image classification. The presentation consists in two parts. The first part describes the city, urban and social settings and gives a brie history of the development in 20th century. The second part is focused don the GIS based technical description of the algorithms of image analysis: classification of the multi-temporal Landsat TM series of the selected stud area of Taipei, Taiwan. Methodology aims at spatio-temporal analysis of urban dynamics in study area during 15 years (1990-2005). Research objective: application of geoinformatic tools, remote sensing data and application of methodology to spatial analysis for urban studies, a case study of Taipei. Current presentation consists in 2 parts: 1) Overview of the environmental research problem, urbanization and characteristics of Taipei. Consequences of urban sprawl for the global cities, such as Taipei; 2) Detailed technical description of the GIS part: remote sensing data capture, pre-processing, algorithm processing, image classification and spatial analysis. The spatial analysis performed by means of GIS ENVI enabled to use satellite images for social and urban studies. The spatio-temporal analysis was applied to Landsat TM images taken at 1990 and 2005. Built-in functions of the mathematical algorithms (K-means) enabled to process raster Landsat TM images and to derive information from them.
Advancing the Use of Earth Observation Systems for the Assessment of Sustaina...rsmahabir
Abstract: Decisions made on the use of land in Trinidad and Tobago, with little considerations to environmental impact or physical constraints, have resulted in physical, socio-economic, and environmental problems. As a result of the country’s economic progress, urbanisation and development are fragmenting natural areas and reducing the viability of the environment to support the population. Spatial information is a crucial component in the characterisation and examination of the spatio-temporal dynamics and the consequences of the interaction between human and the environment. This information is of critical importance in the development of models to predict future trends in land cover change and therein, best land use practices to be implemented. However, the lack of data at appropriate scales has made it difficult to accurately examine the land use/cover patterns in the country. This paper argues that the gap in data and information can be managed through the adoption of earth observation technology. Moreover, it reports on the developed methodology, and highlights key results of examining the use of geo-spatial images in addressing sustainability issues associated with development. The developed methodology involves several critical steps in using multi-spectral imagery including cloud and cloud shadow removal, image classification and image fusion. Additionally, a method for improving classification performance using high resolution imagery is discussed. The results demonstrated the accuracy, flexibility and cost-effectiveness of these technologies for mapping the land cover and producing other environmental measures and indicators. Further, these results confirmed the effectiveness of this technology in establishing the necessary baseline and support information for sustainable development in the Caribbean region.
A B S T R A C T
Population and land use out-migrations from urban to peripheral areas can result in non-functional, unmaintained historic structures which deteriorate to the point where removal is cheaper than removal – or demolition by neglect. The increasing rate of neglected historic structures is a growing concern. There is a need for research investigating connections between urban growth management and its effect on neglect. This paper applies Newman’s (2013) conceptual model of measuring neglect to Geographic Information Systems, comparing rates of neglect in historic Doylestown, Quakertown, and Bristol boroughs in Pennsylvania, USA utilizing different amounts of peripheral agricultural preservation. Comparisons are made examining descriptive statistics on existing conditions, a Polychoric correlation evaluating relationships between drivers of neglect, and a cross-comparative GIS spatial analysis. Results indicate as amounts of peripheral preserved farmlands increase, neglect can be lowered.
CONTEMPORARY URBAN AFFAIRS (2018) 2(2), 33-45. Doi: 10.25034/ijcua.2018.3669
www.ijcua.com
CHANGING URBAN LAND USE AND NEIGHBOURHOOD QUALITY: EVIDENCE FROM FEDERAL CAPI...IAEME Publication
Land use change in more recent times is becoming a natural phenomenon in cities
of developing countries. Its causes and consequences were investigated with respect to
FCT, Abuja, Nigeria. The responses of registered estate surveying firms (ESFs)
practicing in FCT Abuja on the pattern of land use dynamics were obtained and
analysed by descriptive statistics such as simple distribution frequency (SDF) and
mean weighted score (MWS). Four major findings were discovered. Firstly, the
predominantly changing land use were agrarian and residential, secondly the
direction of change in land use revolves around public land use, residential, retail and
office property with prevailing observations of new development and redevelopment
involving renovations/rehabilitations and modifications/alterations. Thirdly the major
determinants of land use change were identified as economic and spatial political
factors and lastly the noticeable consequences had been arbitrary land/rental value,
landscape distortion and pressure on urban infrastructure among others. The study
recommended that policymakers and private stakeholders should encourage and
adhere to land use control measures to strike a balance between economic
development and land administrative system to foster a sustainable urban cities.
The characterisation of “living” landscapes: the role of mixed descriptors an...Beniamino Murgante
The characterisation of “living” landscapes: the role of mixed descriptors and volunteering geographic information
Ernesto Marcheggiani, Hubert Gulinck - Katholieke Universiteit Leuven
Andrea Galli - Polytechnic University of Marche
RISK-SENSITIVE MITIGATION PLANNING IN SEISMICALLY VULNERABLE URBAN AREAScivej
Over the past decade, several number of commercial and non-commercial catastrophe risk models havebeen developed to assess the financial losses caused by natural catastrophes including earthquakes. Theoutput of such models are in different sectors such as disaster risks management, financial institutions and
also research centers. Generally, due to great amount of inherent uncertainty in these models the direct
deployment of the results by the user is a tough process. As an example, in disaster risk reduction sector a
common missing link in this context is a decision-support medium that interprets the risk analysis outputs
to the non-technical stakeholders. To overcome this problem, user-friendly analytical tools can be
employed to translate the disaster risk analysis results into an understandable language for the potential
stakeholder user. Presenting two models, attempts to address two different examples of such decisionsupport
tools. The first model, UERI, is structured to incorporate several urban risk components (hazard,physical vulnerability, disaster management facilities and human exposure) based on a number earthquake
risk indicators. The second tooles the use of a mixed integer quadratic programming (MIQP) model to
finds an opt spatil land-use allocation patter a given urban environment area.
Both models are capable of assisting decision-makers in using the output results of existing damage and
loss estimation methodologies and also facilitating the process of risk reduction planning by providing
basic solutions for stakeholders. The proposed models have been applied to a vulnerable urban area in
Tehran, Iran and their performances have been examined.
Detecting Urban Change of Salem City of Tamil Nadu, India from 1990 to 2010 U...drboon
Unplanned city growth is an indicator of rapid industrialization, which usually reduces the quality of the environmental health of a region - sometimes disastrously. Monitoring provides the planners and decision - makers with required information about the current state of development and the nature of changes that have occurred. The study on development of urban lands and the changes in the land use and land cover in Salem city, Tamil Nadu has been monitored by using IRS LISSII III(1991)and IRS-LISS III 2010) satellite data, the Town and Country Planning map(1994) and Survey of India Topo-sheets (1972) with limited field checks. This study highlights the changes in urban development. Mapping of the urban changes in the study area have been interpreted in view of developing urban land with different classes.
A Survey on Landslide Susceptibility Mapping Using Soft Computing Techniquesiosrjce
Landslide is a common phenomenon especially in tectonically fragile and sensitive mountainous
terrain which causes damage to both human lives and environment. The complex geological setting of the areas
in the mountainous region makes the land highly susceptible to landslides. Hence, landslide susceptibility
mapping is an important step towards landslide hazard and risk management. The accurate prediction of the
occurrence of the landslide is difficult and in the recent years various models for landslide susceptibility
mapping has been presented. GIS is a key factor for the modeling of landslide susceptibility maps. This paper
presents the review of ongoing research on various landslide susceptibility mapping techniques in the recent
years.
In recent years researchers have displayed an interest in understanding the rural dynamics in other regions of the world which are also being affected by global processes in different ways and the sum result is great global spatial diversity.
Dimension of Land Use Conversion in Ado-Ekiti Metropolisijceronline
Over the years land use has ever been dynamics due to many factors such as economics, environmental, socio- political, legal among others. In Ado-Ekiti metropolis, due to urbanization the quantum of developable land available continue to decrease daily, hence the high rate of land use conversion. This paper examined land use pattern in Ado- Ekiti and then identified the direction of land use conversion in the study area. Primary data were collected with questionnaire administered on 76 individual property owners who have their properties converted. It was discovered that all the identified properties were originally meant for residential use. The results showed that land use conversion from residential-commercial (68%) was identified followed by residential-institutional (16%), residential-recreational (12%), while residential-others (4%). This study concluded that going by the rate at which residential properties are been converted to other uses in Ado-Ekiti metropolis in the recent time, may lead to serious housing shortage. The implication of this is that house rents will continue to rise to the extent that, low and even medium income earners may not be able to afford accommodation within the study area, unless urgent government intervention.
Identification and Monitoring the Change of Land Use Pattern Using Remote Sen...IOSR Journals
Abstract: Dhaka is one of the fastest growing megacities of the world with a dense population over 15 million.
Being the capital of a developing country like Bangladesh, it is experiencing multi-dimensional problems such
as over urbanization, traffic congestion, water logging, solid waste disposal, black smoke from brick kilns and
industrial emissions, sound pollution, pollution of water bodies by industrial discharge and the newly added
calamity, building collapse. Dhaka is a sheer example of having poor legislative actions, inefficient
management and lack of public awareness, which leads the urbanization to an unplanned and resource
consuming development. This paper presents an integrated study of urbanization trends in Dhaka City,
Bangladesh, by using Geographical Information Systems (GIS) and Remote Sensing (RS). This study explores
the land use change pattern of Dhaka City Corporation over 1990-2010, through interactive supervised land
cover classification using Landsat images by ArcGIS 10. The remotely detected land use/cover change from
1990 to 2010 shows that Dhaka is gradually changing as vegetative cover and open spaces have been
transformed into building areas, low land and water bodies into reclaimed built up lands. These changes are
mainly governed by unplanned urban expansion.
Keywords - ArcGIS 10.0, Dhaka City Corporation, GIS, Land Use Pattern, Remote Sensing
This paper introduces the the context for geodesign, the history of geodesign, the definition of geodesign, the importance of geodesign, the nature of design, managing complexity, the technology of digital geodesign, and creating the future.
Understanding Spatiotemporal Forms, Triggers and Consequences of Urban Dynami...Universität Salzburg
Current research is focused on analysis of the urban dynamics in Taipei urban landscapes, Taiwan. It describes recent trends and directions in the urban city sprawl, urban growth and city sprawl affects ecosystems. Consequences of human impacts include various factors among others: landscape degradation, changes in land cover and land use types, decrease in biodiversity richness within the city, deforestation, urbanization, and wetlands destruction, decrease in species, losses of rare and extinct species. The research discussed land cover/use problem in the rapidly development city. Because of the concentrated population density and environmental pressure within the limited geographic space and resources, the city of Taipei deals with specific urban environmental problems.
S Ramage GEO UN-GGIM HLF Mexico Nov 2017Steven Ramage
Considerations around geospatial approaches for working on the UN 2030 Agenda for sustainable development, including links between different SDGs, civil society participation and standards.
Assessment of Land Use Land Cover Classification through Geospatial Approach:...Premier Publishers
Earth's land use/land cover (LC/LU) classification provides valuable information particularly on natural resources, mapping and its monitoring. There is a significant change on LC/LU across the globe due to the climatic changes, rapid increase in population and over demand of economic natural resources. Remote Sensing (RS) satellite data with its synoptic view and multispectral data provides essential information in proper planning of LU/LC conditions of larger areas. The study aims to map and monitor the existing LU/LC classification scientifically using geospatial tools in database generation, analyses and information extraction. Thematic maps of the study area are prepared using satellite images in conjunction with collateral data Survey of India (SoI) toposheets, forest and wasteland maps. An attempt have been made to delineate the Level-I, Level-II and Level-III LU/LC classification system through NRSC guidelines (2011) using both Digital Image Processing (DIP) and Visual Image Interpretation Techniques (VIIT) by GIS software’s with limited Ground Truth Check (GTC). More accurate classification is observed in case of digital technique as compared to that of visual technique in terms of area statistics. The final results highlight the potentiality of geospatial technique in optimal and sustainable land use planning of natural resource and its management.
GIS: Bringing Geography to the World & the World to Geography; Slide Presenta...Barry Wellar
The slide presentation for GIS: Bringing Geography to the World & the World to Geography, demonstrates the theme that GIS Day is a special occasion, whereby we express what we are thinking and doing in our GIS research, education, training, and applications activities. And, it is also is a time to set forth what we wish others would think about and do, such as providing answers to the question: “What contribution is Geography making to support and encourage the development and use of GIS technology and GIScience methods, techniques, and operations by governments, NGOs, business, researchers, academe, the media, and interest groups?” The impending Research Colloquium on Using the Retrospective Approach to Mine for GIS Nuggets is one such contribution by Geography to GIS. This GIS Day 2014 presentation includes a selection of figures and tables from several Colloquium papers which illustrate how Geography can contribute to both parts of the title, that is, GIS: Bringing Geography to the World and, GIS: Bringing the World to Geography.
Sample from HEADS-ON, HANDS-ON: The Power of Experiential Learning
From John Wiley & Sons, 1983 Reference Guide to Handbook Annuals.
Part of 4-HNational Curriculum
As part of the final course for Exec MBA am surveying my team on the model attached. Excited to see the results and develop action plan for improvement.
Key Aspects of Land Governance: A Policy Framework for Developing CountriesShamsuddin Ahmed
Abstract: This research examines the key aspects of land governance and suggests a policy framework to determine the efficient use of land resources with respect to geographic, economic, and social phenomena of a developing country. It primarily obliges two capacities: the assessment of land use variability, and the identification of development strategies for land use delimitation. Land governance allows local level land use politically, economically and socially transformative, and contributes better physical environment and revenue generation. In a developing country, it is rather sparse from land use regulations to the municipal and rural land use with accessible
implications of housing, farming lands, and public assets. The central argument is that developing countries should have given more responsiveness to land governance for sustainable land use that is a key for agriculture, livelihoods, transits, local food security and poverty alleviation. Despite the fact that the local government and rural development agencies are utilitarian for managing the public goods, they do not always meet the government expenditures mostly because of political, economic, or ecological constraints. This paper warns six strategies and concludes that land management needs an informed policy model capable of monitoring and appraising the impacts of land use towards integrated land governance.
Morphological and GIS-based land use Analysis: A Critical Exploration of a Rural Neighborhood
*Dr.OLUWAGBEMIGA PAUL AGBOOLA1,Dr.MOHDHISYAMRASIDI2,Dr.ISMAIL SAID3, MA. SAMSON OLUTAYO ABOGAN4,MA.ADEBAMBO STEPHEN ADEJUWON5
1Department of Architecture, Faculty of Environmental Studies, Osun State College of Technology, P.M.B.1011, Esa-Oke. Osun State. Nigeria.
2,3Department of Landscape Architecture, Faculty of Built Environment, UniversitiTeknologi Malaysia, Postcode 81310, Johor Bahru, Johor. Malaysia.
4,5Department of Urban and Regional Planning, Faculty of Environmental Studies, Osun State College of Technology, P.M.B. 1011, Esa-Oke. Osun-State. Nigeria.
1E mail: agbofavour41@yahoo.com , 2E mail:hisyamrasidi@gmail.com , 3E mail:ismailbinsaid@gmail.com , 4E mail: agbofavour41@yahoo.com
A B S T R A C T
The significance of neighbourhood in hosting a group of dwellings units and possessing adequate communal facilities could not be overemphasized in the study of people and place relationships. There are two main objectives of this study: (i) to study the neighbourhood’s associated challenges through the size, growth, and land use distribution, and (ii) to investigate the perceived inhabitants’ activities pattern within the neighbourhood. The objectives are explored through a morphological and GIS-based land use analysis of a rural neighbourhood in South-west, Nigeria. The town is studied in three transformation phases, dating back to five decades using ArcGIS version 10.3. The 1st phase spanned between the year 1910 to 1959, while the 2nd and 3rd phases ran through the year 1960 to 1999, and year 2000 to 2015 respectively. The exploration in this study is to document the diverse neighbourhood challenges, features, and prospects, which remain uninvestigated in the case study area for the past years. The first finding revealed that some challenges needed to be resolved in a bid to meet the residents’ current basic needs. The second finding indicated that the rural settlements in Nigeria emanated from the residents’ adaptation to the environmental conditions, cum transformation through human activities. Meanwhile, the third finding established that the human settlements evolved in connection to the local socio-economic, recreation and religious virtues of the traditional marketplace (Oja). In conclusion, human historical and social influences play a significant role in ameliorating the challenges associated with the spatial developments of the settlements. The implication of the study becomes vital to the major stakeholders and professionals in the built environment on the significance of enhancing the sustainable communities in Nigeria.
Land Consumption, Ecosystem Services and Urban Planning Policies: Preliminary...IEREK Press
In the contemporaneity, the issues of land or soil consumption and of the protection of areas that, within the urban areas, provide ecosystem services (ESs) is becoming increasingly important also in relationof the 2030 Sustainable Development Goals. The concept of "Ecosystem Service" appears, in this respect, a fruitful support to define the land consumption effects on the loss of functionality and of settlement quality. Following this considerations the paper presents the first results of a research developed in Tuscany and commissioned by the Regional Government. The research aims to measure the loss of ESs in connection with land use / land cover transformations, and to verify the contribution of soil consumption to these variations. The research use methodologies for elaborating of the geographical data required for territorial governance, LUCL 2010/2016 and Land Cover Flow (LCF) model and the theoretical model of the “Capacity matrix” to provide ecosystem services.
Land Use Growth Simulation and Optimization for Achieving a Sustainable Urban...TELKOMNIKA JOURNAL
Urban areas have been perceived as the source of environmental problems. To avoid improper land use allocation, negative sprawl effects, and other sources of environmental degradation, city planners need tools for simulating and optimizing their proposed plans. This study proposed a “what-if” analysis model that could help the planners in assessing and simulating their urban plans in Bekasi City, Indonesia. As part of Jakarta Metropolitan Area which exhibited a “post-suburbanization” phenomenon, this city faces many problems because of its high urban growth. Since the urban area has higher land use density than the rural area, especially on built-up class, it needs more consideration when allocating this kind of land use. Because each type of built-up class influences another type, it is difficult to allocate manually. Therefore, this study proposed a land-use optimization application to help planners finding the appropriate land use. This study showed that a model with simulation and optimization can be used to handle urban growth.
Implications of Present Land Use Plan on Urban Growth and Environmental Susta...Agboola Paul
Land use, urban development, and environmental sustainability have become an interesting research arena as urban development would change the city landscape as well as generate environmental degradation. This paper looks at the missing link between land use planning and urban growth, and its implications for environmental sustainability in a selected sub-Saharan Africa city of Kaduna, Nigeria. We assessed urban growth from historical GIS data of the city to evaluate the urban expansion. At the same time, regression analysis was used to established relationship between carbon emission and traffic volume in the city.
The Evaluation of Land Use Evolution and Ecological Sensitivity of Guangzhou ...AI Publications
The dynamic stability of the local ecological environment is related to changes in land use patterns and ecological sensitivity. The study aims to identify the land use characteristics and dynamic change features in Guangzhou City using RS and GIS technology. We choose six ecological sensitivity factors, such as land use type, elevation, watershed buffer, vegetation cover, slope, and slope direction, and use the analytical hierarchy process (AHP) to obtain the results of single-factor and comprehensive ecological sensitivity. The findings indicate that, in terms of land use, the area of four types—forest land, grassland, arable land, and unused land—decreased from 2000 to 2020, while the area of water bodies and construction land rose, with a minimal overall change. According to total ecological sensitivity, very sensitive areas make up the majority of the total area and are primarily found along the northern township boundary; very low-sensitive and mildly sensitive areas are mostly found in the south and center. In order to encourage the development of an ecological civilization in the city, Guangzhou City must establish the idea of harmony between people and the land and increase the ecological conservation function.
A B S T R A C T
The significance of neighbourhood in hosting a group of dwellings units and possessing adequate communal facilities could not be overemphasized in the study of people and place relationships. There are two main objectives of this study: (i) to study the neighbourhood’s associated challenges through the size, growth, and land use distribution, and (ii) to investigate the perceived inhabitants’ activities pattern within the neighbourhood. The objectives are explored through a morphological and GIS-based land use analysis of a rural neighbourhood in South-west, Nigeria. The town is studied in three transformation phases, dating back to five decades using ArcGIS version 10.3. The 1st phase spanned between the year 1910 to 1959, while the 2nd and 3rd phases ran through the year 1960 to 1999, and year 2000 to 2015 respectively. The exploration in this study is to document the diverse neighbourhood challenges, features, and prospects, which remain uninvestigated in the case study area for the past years. The first finding revealed that some challenges needed to be resolved in a bid to meet the residents’ current basic needs. The second finding indicated that the rural settlements in Nigeria emanated from the residents’ adaptation to the environmental conditions, cum transformation through human activities. Meanwhile, the third finding established that the human settlements evolved in connection to the local socio-economic, recreation and religious virtues of the traditional marketplace (Oja). In conclusion, human historical and social influences play a significant role in ameliorating the challenges associated with the spatial developments of the settlements. The implication of the study becomes vital to the major stakeholders and professionals in the built environment on the significance of enhancing the sustainable communities in Nigeria.
CONTEMPORARY URBAN AFFAIRS (2018) 2(2), 106-121. Doi:10.25034/ijcua.2018.3675
www.ijcua.com
International Journal of Engineering Research and DevelopmentIJERD Editor
• Electrical, Electronics and Computer Engineering,
• Information Engineering and Technology,
• Mechanical, Industrial and Manufacturing Engineering,
• Automation and Mechatronics Engineering,
• Material and Chemical Engineering,
• Civil and Architecture Engineering,
• Biotechnology and Bio Engineering,
• Environmental Engineering,
• Petroleum and Mining Engineering,
• Marine and Agriculture engineering,
• Aerospace Engineering.
International Journal of Computational Engineering Research(IJCER)ijceronline
International Journal of Computational Engineering Research(IJCER) is an intentional online Journal in English monthly publishing journal. This Journal publish original research work that contributes significantly to further the scientific knowledge in engineering and Technology.
Effectiveness and Capability of Remote Sensing (RS) and Geographic Informatio...nitinrane33
In this research paper, the effectiveness and capability of remote sensing (RS) and geographic information systems (GIS) are investigated as powerful tools for analyzing changes in land use and land cover (LULC), as well as for accuracy assessment. The study employs the literature of satellite imagery and GIS data to evaluate LULC changes over a period and to assess the accuracy of the analysis. Moreover, the research investigates the land use and land cover change detection analysis using RS and GIS, application of artificial intelligence (AI), and Machine Learning (ML) in LULC classification, environment and risk evaluation, stages of process LULC classification, factors affecting the LULC classification, accuracy assessment, and potential applications of RS and GIS in predicting future LULC changes and supporting decision-making processes. The findings of the study suggest that RS and GIS are highly effective and accurate for LULC analysis and assessment, with substantial potential for predicting and managing future changes in land use and land cover. The paper emphasizes the importance of utilizing RS and GIS techniques in the field of sustainable environmental management and resource planning.
Combination of Geographic Information System, Fuzzy Set Theory And Analytic H...IRJESJOURNAL
ABSTRACT :- In Hung Ha district, planning new industrial zones along with enlarging the existing ones are the key policies of the authorities. Locations, however, of the planned industrial zones are facing protests of surrounding residential areas because of environmental impacts. The purpose of this research is to assist Hung Ha government in assessing the suitability of planned locations of industrial zones by utilizing the combinations of Geographic Information System (GIS) technology, Analytic Hierarchy Process (AHP) technique and Fuzzy set theory. Firstly, opinions were surveyed from people residing near planned locations for determining which problems were complained mostly, and subsequently consulted suggestions from the authorities to form affected factors table. Secondly, AHP was applied for calculating weights of criteria and factors, and Fuzzy set theory was employed for obtaining continuous score of relevant degree from 0 to 1. GIS technology was applied throughout the paper from standardizing input spatial data to overlapping layers. The assessment results revealed that all 18 planned industrial zones in the researched district were not rational because of close to residential areas or water sources.
Securing your Kubernetes cluster_ a step-by-step guide to success !KatiaHIMEUR1
Today, after several years of existence, an extremely active community and an ultra-dynamic ecosystem, Kubernetes has established itself as the de facto standard in container orchestration. Thanks to a wide range of managed services, it has never been so easy to set up a ready-to-use Kubernetes cluster.
However, this ease of use means that the subject of security in Kubernetes is often left for later, or even neglected. This exposes companies to significant risks.
In this talk, I'll show you step-by-step how to secure your Kubernetes cluster for greater peace of mind and reliability.
Slack (or Teams) Automation for Bonterra Impact Management (fka Social Soluti...Jeffrey Haguewood
Sidekick Solutions uses Bonterra Impact Management (fka Social Solutions Apricot) and automation solutions to integrate data for business workflows.
We believe integration and automation are essential to user experience and the promise of efficient work through technology. Automation is the critical ingredient to realizing that full vision. We develop integration products and services for Bonterra Case Management software to support the deployment of automations for a variety of use cases.
This video focuses on the notifications, alerts, and approval requests using Slack for Bonterra Impact Management. The solutions covered in this webinar can also be deployed for Microsoft Teams.
Interested in deploying notification automations for Bonterra Impact Management? Contact us at sales@sidekicksolutionsllc.com to discuss next steps.
UiPath Test Automation using UiPath Test Suite series, part 4DianaGray10
Welcome to UiPath Test Automation using UiPath Test Suite series part 4. In this session, we will cover Test Manager overview along with SAP heatmap.
The UiPath Test Manager overview with SAP heatmap webinar offers a concise yet comprehensive exploration of the role of a Test Manager within SAP environments, coupled with the utilization of heatmaps for effective testing strategies.
Participants will gain insights into the responsibilities, challenges, and best practices associated with test management in SAP projects. Additionally, the webinar delves into the significance of heatmaps as a visual aid for identifying testing priorities, areas of risk, and resource allocation within SAP landscapes. Through this session, attendees can expect to enhance their understanding of test management principles while learning practical approaches to optimize testing processes in SAP environments using heatmap visualization techniques
What will you get from this session?
1. Insights into SAP testing best practices
2. Heatmap utilization for testing
3. Optimization of testing processes
4. Demo
Topics covered:
Execution from the test manager
Orchestrator execution result
Defect reporting
SAP heatmap example with demo
Speaker:
Deepak Rai, Automation Practice Lead, Boundaryless Group and UiPath MVP
LF Energy Webinar: Electrical Grid Modelling and Simulation Through PowSyBl -...DanBrown980551
Do you want to learn how to model and simulate an electrical network from scratch in under an hour?
Then welcome to this PowSyBl workshop, hosted by Rte, the French Transmission System Operator (TSO)!
During the webinar, you will discover the PowSyBl ecosystem as well as handle and study an electrical network through an interactive Python notebook.
PowSyBl is an open source project hosted by LF Energy, which offers a comprehensive set of features for electrical grid modelling and simulation. Among other advanced features, PowSyBl provides:
- A fully editable and extendable library for grid component modelling;
- Visualization tools to display your network;
- Grid simulation tools, such as power flows, security analyses (with or without remedial actions) and sensitivity analyses;
The framework is mostly written in Java, with a Python binding so that Python developers can access PowSyBl functionalities as well.
What you will learn during the webinar:
- For beginners: discover PowSyBl's functionalities through a quick general presentation and the notebook, without needing any expert coding skills;
- For advanced developers: master the skills to efficiently apply PowSyBl functionalities to your real-world scenarios.
Elevating Tactical DDD Patterns Through Object CalisthenicsDorra BARTAGUIZ
After immersing yourself in the blue book and its red counterpart, attending DDD-focused conferences, and applying tactical patterns, you're left with a crucial question: How do I ensure my design is effective? Tactical patterns within Domain-Driven Design (DDD) serve as guiding principles for creating clear and manageable domain models. However, achieving success with these patterns requires additional guidance. Interestingly, we've observed that a set of constraints initially designed for training purposes remarkably aligns with effective pattern implementation, offering a more ‘mechanical’ approach. Let's explore together how Object Calisthenics can elevate the design of your tactical DDD patterns, offering concrete help for those venturing into DDD for the first time!
Generating a custom Ruby SDK for your web service or Rails API using Smithyg2nightmarescribd
Have you ever wanted a Ruby client API to communicate with your web service? Smithy is a protocol-agnostic language for defining services and SDKs. Smithy Ruby is an implementation of Smithy that generates a Ruby SDK using a Smithy model. In this talk, we will explore Smithy and Smithy Ruby to learn how to generate custom feature-rich SDKs that can communicate with any web service, such as a Rails JSON API.
Epistemic Interaction - tuning interfaces to provide information for AI supportAlan Dix
Paper presented at SYNERGY workshop at AVI 2024, Genoa, Italy. 3rd June 2024
https://alandix.com/academic/papers/synergy2024-epistemic/
As machine learning integrates deeper into human-computer interactions, the concept of epistemic interaction emerges, aiming to refine these interactions to enhance system adaptability. This approach encourages minor, intentional adjustments in user behaviour to enrich the data available for system learning. This paper introduces epistemic interaction within the context of human-system communication, illustrating how deliberate interaction design can improve system understanding and adaptation. Through concrete examples, we demonstrate the potential of epistemic interaction to significantly advance human-computer interaction by leveraging intuitive human communication strategies to inform system design and functionality, offering a novel pathway for enriching user-system engagements.
DevOps and Testing slides at DASA ConnectKari Kakkonen
My and Rik Marselis slides at 30.5.2024 DASA Connect conference. We discuss about what is testing, then what is agile testing and finally what is Testing in DevOps. Finally we had lovely workshop with the participants trying to find out different ways to think about quality and testing in different parts of the DevOps infinity loop.
Software Delivery At the Speed of AI: Inflectra Invests In AI-Powered QualityInflectra
In this insightful webinar, Inflectra explores how artificial intelligence (AI) is transforming software development and testing. Discover how AI-powered tools are revolutionizing every stage of the software development lifecycle (SDLC), from design and prototyping to testing, deployment, and monitoring.
Learn about:
• The Future of Testing: How AI is shifting testing towards verification, analysis, and higher-level skills, while reducing repetitive tasks.
• Test Automation: How AI-powered test case generation, optimization, and self-healing tests are making testing more efficient and effective.
• Visual Testing: Explore the emerging capabilities of AI in visual testing and how it's set to revolutionize UI verification.
• Inflectra's AI Solutions: See demonstrations of Inflectra's cutting-edge AI tools like the ChatGPT plugin and Azure Open AI platform, designed to streamline your testing process.
Whether you're a developer, tester, or QA professional, this webinar will give you valuable insights into how AI is shaping the future of software delivery.
Smart TV Buyer Insights Survey 2024 by 91mobiles.pdf91mobiles
91mobiles recently conducted a Smart TV Buyer Insights Survey in which we asked over 3,000 respondents about the TV they own, aspects they look at on a new TV, and their TV buying preferences.
Key Trends Shaping the Future of Infrastructure.pdfCheryl Hung
Keynote at DIGIT West Expo, Glasgow on 29 May 2024.
Cheryl Hung, ochery.com
Sr Director, Infrastructure Ecosystem, Arm.
The key trends across hardware, cloud and open-source; exploring how these areas are likely to mature and develop over the short and long-term, and then considering how organisations can position themselves to adapt and thrive.
Essentials of Automations: Optimizing FME Workflows with ParametersSafe Software
Are you looking to streamline your workflows and boost your projects’ efficiency? Do you find yourself searching for ways to add flexibility and control over your FME workflows? If so, you’re in the right place.
Join us for an insightful dive into the world of FME parameters, a critical element in optimizing workflow efficiency. This webinar marks the beginning of our three-part “Essentials of Automation” series. This first webinar is designed to equip you with the knowledge and skills to utilize parameters effectively: enhancing the flexibility, maintainability, and user control of your FME projects.
Here’s what you’ll gain:
- Essentials of FME Parameters: Understand the pivotal role of parameters, including Reader/Writer, Transformer, User, and FME Flow categories. Discover how they are the key to unlocking automation and optimization within your workflows.
- Practical Applications in FME Form: Delve into key user parameter types including choice, connections, and file URLs. Allow users to control how a workflow runs, making your workflows more reusable. Learn to import values and deliver the best user experience for your workflows while enhancing accuracy.
- Optimization Strategies in FME Flow: Explore the creation and strategic deployment of parameters in FME Flow, including the use of deployment and geometry parameters, to maximize workflow efficiency.
- Pro Tips for Success: Gain insights on parameterizing connections and leveraging new features like Conditional Visibility for clarity and simplicity.
We’ll wrap up with a glimpse into future webinars, followed by a Q&A session to address your specific questions surrounding this topic.
Don’t miss this opportunity to elevate your FME expertise and drive your projects to new heights of efficiency.
State of ICS and IoT Cyber Threat Landscape Report 2024 previewPrayukth K V
The IoT and OT threat landscape report has been prepared by the Threat Research Team at Sectrio using data from Sectrio, cyber threat intelligence farming facilities spread across over 85 cities around the world. In addition, Sectrio also runs AI-based advanced threat and payload engagement facilities that serve as sinks to attract and engage sophisticated threat actors, and newer malware including new variants and latent threats that are at an earlier stage of development.
The latest edition of the OT/ICS and IoT security Threat Landscape Report 2024 also covers:
State of global ICS asset and network exposure
Sectoral targets and attacks as well as the cost of ransom
Global APT activity, AI usage, actor and tactic profiles, and implications
Rise in volumes of AI-powered cyberattacks
Major cyber events in 2024
Malware and malicious payload trends
Cyberattack types and targets
Vulnerability exploit attempts on CVEs
Attacks on counties – USA
Expansion of bot farms – how, where, and why
In-depth analysis of the cyber threat landscape across North America, South America, Europe, APAC, and the Middle East
Why are attacks on smart factories rising?
Cyber risk predictions
Axis of attacks – Europe
Systemic attacks in the Middle East
Download the full report from here:
https://sectrio.com/resources/ot-threat-landscape-reports/sectrio-releases-ot-ics-and-iot-security-threat-landscape-report-2024/
Transcript: Selling digital books in 2024: Insights from industry leaders - T...BookNet Canada
The publishing industry has been selling digital audiobooks and ebooks for over a decade and has found its groove. What’s changed? What has stayed the same? Where do we go from here? Join a group of leading sales peers from across the industry for a conversation about the lessons learned since the popularization of digital books, best practices, digital book supply chain management, and more.
Link to video recording: https://bnctechforum.ca/sessions/selling-digital-books-in-2024-insights-from-industry-leaders/
Presented by BookNet Canada on May 28, 2024, with support from the Department of Canadian Heritage.
Transcript: Selling digital books in 2024: Insights from industry leaders - T...
Embedding sustainable development strategies in agent
1. International Journal of Geographical Information Science
Vol. 22, No. 1, January 2008, 21–45
Research Article
Embedding sustainable development strategies in agent-based models for
use as a planning tool
XIA LI* and XIAOPING LIU
School of Geography and Planning, Sun Yat-sen University, Guangzhou, 510275, PR
China
(Received 22 June 2006; in final form 11 January 2007 )
Rapid land development in rapidly growing countries has created a series of land-
use problems. The implementation of sustainable land use can alleviate some of
these problems. It needs a set of tools for the exploration, design, modification,
illustration, and evaluation of alternative planning scenarios. This paper
demonstrates that the integration of cellular automata and agent-based
modelling can provide a spatial exploratory tool for generating alternative
development patterns. Sustainable development strategies are embedded in the
modelling to regulate agents’ behaviours. The use of agents can help to represent
human–environment interactions in solving complex land-use problems. It is able
to examine the effects of different stakeholders in influencing the process of land
development. The proposed model has been applied to the simulation of
planning scenarios for residential development in a rapidly expanding city in the
Pearl River Delta.
Keywords: Agent-based modelling; Cellular automata; GIS; Urban planning
1. Introduction
Rapid urban expansion in rapidly growing countries has created a major concern for
sustainable land use in these regions (Li and Yeh 2001). Massive conversion of non-
urban land into urban land has created a series of land-use problems, such as a
decrease in food production, destruction of sensitive ecosystems, water and air
pollution, and deprivation of future land supply (Yeh and Li 1999, Jantz et al. 2005).
Sustainable land use, which should also coordinate the land-use demands from
multiple aspects and different interest groups, can provide a useful tool to alleviate
some of these land-use problems. The implementation of sustainable land use is
quite complex because it involves social, economic, and environmental factors.
Modelling systems can be developed to provide assistance in implementing the
initiatives of sustainable land use (Zandera and Kachele 1999). These models are
¨
useful for carrying out a scenario analysis which is a promising and interesting
planning tool for investigating future possibilities in a changing environment
(Nijkamp et al. 1997).
Cellular automata (CA), a type of bottom-up approach, have been used to
investigate the ‘business-as-usual’ scenario, that is, further development of present
conditions. These models have been widely used to simulate complex geographical
phenomena which have nonlinear and emergent features (White and Engelen 1993,
*Corresponding author. Email: lixia@mail.sysu.edu.cn
International Journal of Geographical Information Science
ISSN 1365-8816 print/ISSN 1362-3087 online # 2008 Taylor & Francis
http://www.tandf.co.uk/journals
DOI: 10.1080/13658810701228686
2. 22 X. Li and X. Liu
Batty and Xie 1994, Li and Yeh 2000). However, CA have limitations reflecting the
decision behaviours of individuals, such as governments and investors, in shaping
urban growth. The influence of human factors is difficult to include in traditional
CA (Torrens and Benenson 2005).
Agent-based modelling (ABM) can be used as a tool for analysing complex
natural systems (Courdier et al. 2002). A major feature and advantage of ABM is
the ability to produce nonlinear and emergent phenomena based on behaviour of
individuals. In the past, ABM have been used mostly in purely social contexts
(Gilbert and Conte 1995). They were used to validate or illustrate social theories
(e.g. biological, economic, and political theories) or to predict the behaviour of
interacting social entities (e.g. actors in financial markets and consumer behaviour)
(Basu and Pryor 1997). However, this type of model does not make use of spatial
information central to geographical analyses.
Both CA and ABM are limited in their geographic functionality when considered
in isolation (Torrens and Benenson 2005). However, increasingly researchers are
turning to the integration of CA with ABM to produce better simulation results.
Research has indicated that not only the neighbourhoods (or cell states of CA) but
interactions between local actors and their environment must be considered in order
to forecast landscape transition with a higher accuracy (Loibl and Toetzer 2003).
The integration of CA with ABM promises to provide a powerful spatial approach
to the modelling of complex geographic systems that are affected by physical factors
(e.g. land use and accessibility) and individuals (e.g. organizations and human
objects) (Torrens and Benenson 2005).
There are as yet no published studies on the integration of both techniques as a
planning tool for implementing the initiative of sustainable land use. Sustainable
land-use planning generally requires the analysis of a vast array of spatial data. It
needs a set of tools for the exploration, design, modification, illustration, and
evaluation of alternative planning scenarios (Henton and Studwell 2000).
This paper will examine the integration of CA and ABM as a planning tool for
managing residential development. The crucial part of this model is to define agents’
behaviours based on sustainable development strategies. The efficiency criteria in
using land resources are adopted to alleviate land-use conflicts in rapidly growing
cities. This bottom-up approach is well adapted to the simulation of the interactions
and negotiations of different stakeholders. It can provide a useful spatial
exploratory tool for comparing various development options and evaluating the
potential impacts of implementing certain land-use policies.
2. Study area and data
The study area is situated in the Haizhu district of Guangzhou, a rapidly growing
city in the Pearl River Delta, China. Unprecedented land-use changes have been
witnessed in the region in the last two decades (Li and Yeh 2004). The land-use
changes are associated with many environmental problems, such as agricultural land
loss, urban sprawl, and soil erosion (Yeh and Li 1999). In particular, urban
expansion has triggered the loss of a large amount of agricultural land in the Pearl
River Delta.
The spatial information for the proposed integrated CA and ABM model is
obtained using remote sensing and GIS data. The common land-use types in this
study area include urban land, farmland, forest, orchard, and water. GIS are used to
provide the spatial information related to land-use changes. This type of spatial
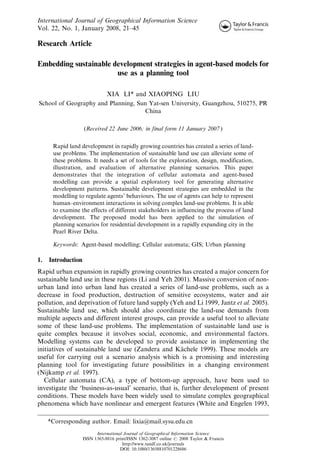
3. Sustainable development strategies 23
information includes the maps of planning schemes, land price, land use, and public
facilities (e.g. hospitals, schools, and parks) (figure 1). Additional information (e.g.
age and income) is also obtained from the statistical yearbooks of Guangzhou and
the Fifth National Censu. The above information is used as the inputs to the
modelling and the basis to define agents’ properties.
3. Integrated CA and ABM planning model
The proposed model consists of three components, GIS, CA, and ABM, for
simulating planning options related to residential development (figure 2). The GIS
component is used to provide the inputs to simulation and model calibration. The
CA component is to reflect neighbourhood influences of physical factors. The ABM
component provides a flexible tool to address the interactions between various
stakeholders that affect residential development. The following sections describe the
detailed procedures in implementing this planning model.
3.1 Retrieving physical factors using GIS
3.1.1 Land use. Land use is one of the important factors in urban simulation.
Agents have different decision behaviours with regard to land-use types. For
Figure 1. Spatial information as the inputs to the simulation.
4. 24 X. Li and X. Liu
Figure 2. Planning model by the integration of cellular automata, agent-based modelling
and GIS.
example, a resident agent has a preference to live in the sites surrounded by a large
area of green land (e.g. forest and orchard) and water, instead of densely developed
land.
3.1.2 Land price. Land price plays a key role in affecting urban development,
especially residential development. Land price is correlated to housing price, which
is a major concern for a potential home buyer. Residents’ financial status determines
their location preferences in buying a home. High-income residents choose locations
of high housing prices to live, while low-income residents choose places of low
housing prices.
3.1.3 Surrounding environment. The attraction of a site for urban development is
related to its surrounding living environment. The surrounding environment is
measured using two indicators, the percentage of green land and the percentage of
water in the neighbourhood. These are calculated using a moving 969 window in
5. Sustainable development strategies 25
classified satellite images. Finally, the utility (attraction) of a site related to this
amenity is obtained using the following equation:
Benv ðiÞ~ 1 Gpercent ðiÞz 1 Wpercent ðiÞ 0ƒGpercent ðiÞzWpercent ðiÞƒ1
2 2 ð1Þ
where Benv(i) is the utility of the surrounding environment, and Gpercent(i) and
Wpercent(i) are the percentages of green land and water at location i, respectively.
These two variables are treated with equal importance, since there is no prior
knowledge.
3.1.4 Accessibility. Accessibility is related to its geographical location (e.g.
distance to roads and town centres) and the conditions of road networks. A site
will be more likely to develop if it is easily accessed. The utility (benefits) of a site
related to the accessibility is represented as follows:
1 : 1 : 1 :
Baccess ðiÞ~ e{b1 Droad ðiÞ z e{b2 Dexpress ðiÞ z e{b3 Dcentre ðiÞ ð2Þ
3 3 3
where Baccess(i) is the utility related to accessibility at location i; the variables
Droad(i), Dexpress(i), and Dcentre(i) are the Euclidean distances to roads, expressways,
and urban centres, respectively; and b1, b2, and b3 are the decay coefficients for
these variables. The same weight (1/3) is also applied to all these variables for
simplicity.
3.1.5 General public facilities. A site will be more likely to develop if it is closer to
facilities, such as hospitals, gardens, commercial centres, and entertainment centers.
Therefore, the utility of a site in terms of facility provision can be represented as
follows:
1 : 1 : 1 : 1 :
Bfacil ðiÞ~ e{b1 Dhospital ðiÞ z e{b1 Dgarden ðiÞ z e{b1 Dcommercial ðiÞ z e{b1 Dentertainment ðiÞ ð3Þ
4 4 4 4
where Bfacil(i) is the utility related to the provision of public facilities at location i,
such as hospitals, gardens, commercial centres and entertainment; and the variables
Dhospital(i), Dgarden(i), Dcommercial(i), and Dentertainment(i) are the Euclidean distances
to these facilities, respectively. The same decay coefficient of b1 in equation (2) is
used, since these facilities are mainly accessed by roads. All these variables are
treated with the same weight (1/4) in the calculation.
3.1.6 Education benefits. Education is an important attraction factor to home
buying. A Euclidean distance function can also be used to represent the accessibility
of a location to education facilities (e.g. schools and libraries). More education
benefits can be achieved if the location is closer to these facilities. This utility is
estimated as follows:
1 : 1 :
Bedu ðiÞ~ e{b1 Dschool ðiÞ z e{b1 Dlibrary ðiÞ ð4Þ
2 2
where Bedu(i) is the utility related to the provision of educational facilities in terms of
schools and public libraries at location i; and the variables Dschool(i) and Dlibrary(i)
are the Euclidean distances to these facilities, respectively. The same decay
coefficient of b1 in equation (2) is used, since these facilities are mainly accessed
by roads. The same weight (1/2) is also used for these two variables.
6. 26 X. Li and X. Liu
3.2 ABM component
This study assumes that land-development patterns are affected by three types of
agents—government agents, developer agents, and resident agents. Government
agents have no location attributes, since their influences are uniform for the whole
region. It is also difficult to define the exact locations for developer agents. The main
objective of developer agents is to make the profit as high as possible. Resident
agents are movable, and their decisions to reside in a place can influence land-
development patterns. The resident agents are randomly located in the initial stage.
They can move into a place for residency according to their financial status and the
site attributes. However, they do not actually move around the landscape with every
time step for reducing computation time.
3.2.1 Implementing the initiatives of sustainable development by government
agents. The strategies of sustainable development can help to develop methods on
how to grow with harmony with the environment (Markandya and Richardson
1992). Some principles related to sustainable development can be incorporated in
formulating land-development plans. In this model, these principles are defined as
follows:
N Land demand is a factor for promoting regional economic development.
However, a mechanism is required to ensure the proper distribution of land
consumption at different planning stages.
N Land development should avoid the use of good-quality agricultural land as
much as possible. This can be realized by incorporating the criterion of spatial
efficiency.
N Negotiations are necessary to achieve practical solutions to land-use conflicts.
In this model, government agents will consider spatial and temporal efficiencies in
using land resources. The first step is to incorporate the criterion of spatial efficiency
for government agents. Government agents will decide if an application for land
development is successful or not, according to a number of factors. Existing land use
is a major factor in determining land-use conversion. Different land uses will have
different values of approval probability for land development. For example, land
development is not allowed in ecological sensitive areas. The probability for land
development in wetland areas or mountainous areas is much lower. The approval
probability is also related to existing plan schemes. It is more likely that an
application can be approved if there are no conflicts with existing land-use plans. In
this study, the approval probability for government agents is defined to represent
various planning objectives.
The second step is to implement the equity of using land resources in a temporal
dimension by government agents. The temporal efficiency criterion is to produce the
maximum benefits from the use of land resources across generations. Tietenberg
(1992) proposes a method to realize efficient allocation of depletable resources and
maintain the equity between generations in a time dimension. It assumes that the
demand curve for a depletable resource is linear and stable over time (figure 3).
Thus, the inverse demand curve in year t can be written as follows:
Dt ~aÀbqt ð5Þ
where a and b are the intersect and slope of the curve of the marginal benefit,
respectively, and qt is the proposed amount of resource consumed in each period t.
7. Sustainable development strategies 27
Figure 3. Maximizing the total net benefit derived from the use of land resources.
Then, the total benefit BT from extracting an amount qt in year t is the integral of
equation (5):
BT ~I ða{bqt Þ dqt
ð6Þ
~aqt {bq2 =2:
t
The marginal cost of extracting that resource is further assumed to be a constant
c. The total cost CT of extracting the amount qt is:
CT ~cqt ð7Þ
where c is a constant.
Then, the efficient allocation of a resource over n years should satisfy the
following maximization condition (Tietenberg 1992):
" #
XÀn Á. t{1
Xn
Max aqt {bq2 2{cqt ð1zrÞ zl Q{
t qt ð8Þ
qt
t~1 t~1
where Q is the total available amount of the resource supplied, and r is the discount
rate.
When the factor of population growth is considered, the maximization is revised
by solving the following equations (Yeh and Li 1998):
.
ða{bqt =Pta {cÞ ð1zrÞt{1 {l~0 t~1, Á Á Á , n
X
n ð9Þ
Q{ qt ~0
T~1
8. 28 X. Li and X. Liu
where Q is the total available amount of land resource supplied. Pta is the projected
additional population in period t.
3.2.2 Making profits for developer agents. The main objective of property
developers is to achieve a certain amount of profit above expectations. The
following equation is used for the assessment of development potentials:
Dt t t t
profit ði Þ~Hprice ðiÞ{Lprice ðiÞ{Dcost ðiÞ ð10Þ
where Dt t
profit ðiÞ represents the investment profit at location i, Hprice ðiÞ is the housing
t t
price, Lprice ðiÞ is the land price, and Dcost ðiÞ is the development cost.
The development probability related to developer agents can thus be represented
as follows:
Dt
profit ðiÞ{Dtprofit
Pt
developer ðk,iÞ~ ð11Þ
Dmprofit {Dtprofit
where Pt developer ðk,iÞ is the development probability related to developer agents,
Dtprofit is a threshold value, and Dmprofit is the maximum value of the investment
profit.
3.2.3 Location choice by resident agents. The behaviours of resident agents are
determined by two types of factors: the location factors and agents’ status factors
(e.g. income and family size). These factors are reflected in a combined utility
function, which is defined to assess the value of residency of each site for a resident
agent. The main objective of resident agents is to maximize the following utility
function as much as possible in site selection. This combined utility function of
location (i) for agent k can be represented as follows:
U ðk,iÞ~wprice :Bprice ðiÞzwenv :Benv ðiÞ
ð12Þ
zwaccess :Baccess ðiÞzwfacil :Bfacil ðiÞzwedu :Bedu ðiÞzetij
where wprice + wenv + waccess + wfacil + wedu51; the variables of Bprice(i), Benv(i),
Baccess(i), Bfacil(i), and Bedu(i) are the utilities (benefits) related to land price,
surrounding environment, accessibility, general facilities, and education for the
development of location (i); the parameters of wprice, wenv, waccess, and wedu are the
preferences (weights) for these variables, respectively; and the term of etij is a
stochastic variable which accounts for unexplained factors in site selection.
These weights are dependent on agents’ status, such as income and family size. In
this study, resident agents are classified into a number of categories according to
their attributes, such as income and family size. The weights are then determined for
each group of agents according to Saaty’s pairwise comparison procedure (Eastman
1999). The heterogeneity of resident agents is reflected by the weights in this
combined utility function.
The probability of selecting a site is estimated according to the utility function.
For resident k, the probability of location (i) to be selected is equal to the utility
probability that the utility value at that location is greater than or equal to those at
other locations (McFadden 1978):
0 expðU ðk,iÞÞ
Pt
resident ðk,iÞ~PðU ðk,iÞ§U ðk,i ÞÞ~ P ð13Þ
expðU ðk,iÞÞ
k
9. Sustainable development strategies 29
3.2.4 Interactions between government agents, developer agents and resident
agents. Although the initial approval probability is determined by governments, it
is subject to changes with the influences from residents and property developers. The
following equation can be used to represent this type of interaction between
government agents, developer agents, and resident agents in affecting the
development probability of a cell (i):
Pt ðiÞ~Pt{1 ðiÞzg:DP1 zzh:DP2 if Pt ðiÞw1, then Pt ðiÞ~1
gov gov gov gov ð14Þ
where the initial value of Pt ðiÞ is P0 ðiÞ, which is related to land-use types; the
gov gov
coefficients g and h are the total numbers applied for development at cell (i) by
resident agents and developer agents, respectively; and DP1 and DP2 are the
incremental probability for each application by developer agents and resident
agents, respectively.
3.3 Integrating CA with ABM
CA are an important component in this integrated model. In this study, the
development probability related to the local interactions of physical factors is
estimated using a logistic-CA model (Wu 2002):
1
Pt ðiÞ~
ca
! :cont ðiÞ:Vt ðiÞ ð15Þ
P
1zexp { D0 z Dh : xh ð i Þ
h
where Pt ðiÞ is the development probability of location (i), determined by the
ca
neighbourhood function, xh is the hth spatial variable, D0 is a constant, and Dh is the
weight of the hth variable. The function of con(i) is a combined physical constraint,
and V(i) is the percentage of developed cells in the neighbourhood.
The final decision is made according to a joint development probability, which
reflects the combined effects of human factors (government agents, resident agents,
and developer agents) and environmental factors. The joint probability is
represented as follows:
Pt ~A:Pt
i
: t : t : t
resident ðk,iÞ Pdeveloper ðk,iÞ Pgov ðiÞ Pca ðiÞ ð16Þ
where A is an adjusted coefficient.
The Monte Carlo method is used to determine the final selection of a location for
development (Wu and Webster 1998). The final land-use conversion is determined
by comparing the development probability with a random variable:
Development, Pt wRandðÞ
i
Stz1 ðiÞ~ ð17Þ
Non À development, Others
where Rand() is a random variable ranging from 0 to 1.
This simulation is to determine which sites will be developed based on the
combined assessment from various individuals. The final decision is based on the
joint probability calculated by equation (16). This equation consists of four
components of interactions for determining land-use conversion. The first three
components are obtained by the ABM method, and the last component is obtained
by the CA method.
10. 30 X. Li and X. Liu
4. Model implementation and results
4.1 Programming
The prototype of this integrated model is developed using the Visual Basic and
ArcObjects component of ARCGIS. The use of ArcObjects can allow this model to
access the spatial data in a GIS database directly. The computation will be too
intensive if the model is implemented using common pure agent-modelling shells
(e.g. the swarm package). They have difficulties in coupling with GIS and CA
directly. Figure 4 shows the interface of this proposed prototype. Agents are only
implied through model results for simplicity.
4.2 Preparing spatial variables and determining model coefficients
The original layers of land-use types, land price, living environment, accessibility,
general public facilities, and education were transformed into a raster format with
the resolution of 1006100 m for the programming. The utility (benefit) of each
spatial variable for land development was estimated using GIS.
Some coefficients should be estimated before calculating the utilities in equations
(2)–(4). The values of b1, b2, and b3 in equation (2), which are related to transport
conditions, can be estimated according to empirical traffic data. It is assumed that a
transport tool with a larger traffic density will have a larger area of influence (a
smaller value for the decay coefficient). For example, expressways which have larger
traffic densities will be assigned smaller values for the coefficient. The following
equation can be used to represent this relationship:
b1 =b2 ~fexpress froad ð18Þ
where froad and fexpress are the average traffic densities for roads and expressways,
respectively.
The same method can be applied to the estimation of b3. If there are z1 number of
roads and z2 number of expressways connected to urban centres, the equation
becomes:
À Á
b1 =b3 ~ z1 :froad zz2 :fexpress froad ð19Þ
Figure 4. Estimating population growth of Guangzhou in 1990–2010.
11. Sustainable development strategies 31
Table 1 provides estimates of froad and fexpress according to statistical data. When
b1 is set to 0.00100, b2 and b3 become 0.00023 and 0.000125, respectively, according
to the above equations. The same value of b1 is also used in equations (3) and (4).
The original spatial variables were normalized into the range of [0, 1] before they
were used for the calculation. The values of the incremental probabilities, DP1 and
DP2, were decided by experiments. In this study, DP1 was set to 0.005 and DP2 was
set to 0.1. The coefficients of the CA component were calibrated according to
logistic regression (Wu 2002). Landsat TM images dated on 30 December 1995 and
13 June 2004 were used to obtain training data about actual land-use conversion.
Table 2 lists the coefficients of the logistic-CA model in equation (15) based on the
regression analysis.
CA and ABM are based on discrete time steps in simulating urban dynamics. Too
few time steps will neglect local interactions and cannot allow spatial details to
emerge (Yeh and Li 2006). An increase in the number of time steps can help to
generate more accurate simulation results. In many applications, 200–300 time steps
are required to guarantee sufficient temporal accuracy for simulation (Yeh and Li
2006). In this study, 1500 time steps are adopted to simulate land development in the
period of 1995–2010. Therefore, 100 time steps correspond to 1 year in the
simulation.
4.3 Implementing sustainable use of land resources by government agents
The initiatives for sustainable use of land resources should be implemented by
government agents, who determine the proper distribution of land consumption
across different planning periods. The first step is to estimate the population growth
before the appropriate land consumption can be obtained for each planning period.
A regression model was established for estimating the population growth using
empirical data (table 3):
Y ðTz1Þ~673300:46e0:0166T ð20Þ
where Y(T + 1) is the predicted population in year T + 1 based on the initial
population in 1990.
Table 1. Traffic densities of roads and expressways according to statistical dataa.
Length Traffic Average Traffic Density
Transport types (km) (1000 persons) (1000 persons km21)
Roads 4637.2 147 330 31.77
Expressways 382.8 52 310 136.7
a
Sources: Guangdong Statistical Yearbook (2000).
Table 2. Coefficients of the logistic-CA model.
D1 D2 D3 D4 D5
Distance to Distance to Distance to Distance to Distance to
D0 main centres sub-centres main roads roads expressways
0.625 20.002 0.005 20.009 20.006 0.002
12. 32 X. Li and X. Liu
Table 3. Empirical data about the population growth in the Haizhu district of Guangzhou in
1990–1999.
Year 1990 1991 1992 1993 1994 1995 1996 1997 1998 1999
Population 684 887 691 557 702 004 710 153 727 045 738 910 751 486 759 256 763 959 778 984
Figure 5 indicates that the regression model can predict the population growth
satisfactorily. The predicted population was used to calculate the optimized land
consumption for each period according to the modified Tietenberg model. The
available land for development was estimated according to land-use information.
The whole study area was 101.40 km2, of which the urban area made up 34.09 km2 in
1995. There was only 66.38% left for future land supply since 33.62% of the area had
been urbanized. The detailed provision of land consumption at each period in 1995–
2010 was obtained by using equation (9), assuming that 50% of the area could be
Figure 5. Interface of the proposed model.
13. Sustainable development strategies 33
Table 4. Optimal land consumption for different periods with various discount rates
according to the Tietenberg’s model.
Land consumption (km2)
Year Population growth r50 r50.02 r50.1
1995–2000 63 880 5.08 6.04 7.66
2000–2005 69 420 5.52 5.39 5.08
2005–2010 75 439 6.01 5.18 3.87
urbanized in 2010 (table 4). The number of new urban cells was then determined for
the simulation.
4.4 Defining resident agents’ properties using empirical data
The decision behaviours of resident agents are defined using aggregated census data
because of the lack of detailed information. Some simplification procedures have to
be carried out for obtaining the attributes of resident agents. First, resident agents
should be classified into a few categories so that their properties can be heuristically
defined. The attributes for the aggregated agents are obtained using social and
economic data. This study considers two major attributes, income and household
size, which are obtained from the statistical yearbook of Guangzhou in 2004, and
the Fifth National Census, respectively.
Residents can be classified into three groups by their income—low-income class
(income,9600 RMB year21), middle-income class (9600 RMB year21,income,
60 000 RMB year21), and high-income class (income.60 000 RMB year21). (1 US$
is roughly equivalent to 7.6951 RMB as of 8 May 2007.) They can also be classified
into two groups by household size: without children and with children. Six classes of
residents were obtained using these two attributes. The actual percentages for these
six groups were calculated according to the statistical yearbook of Guangzhou in
2004, and the Fifth National Census (table 5). These percentages were used to create
the actual numbers for various groups of resident agents in the simulation.
Each group of resident agents has distinct behaviours or preferences in the
location choice of residency. In this model, their preferences are reflected by the
weights in the utility function as described in equation (12). The weights were
obtained by using Saaty’s pairwise comparison procedure (Eastman 1999). The
comparison was mainly based on experts’ knowledge and preferences. A higher
value of the weight means that the variable will be treated more importantly. A
matrix can be constructed to indicate the relative importance based on the
comparison. Saaty (1990) proposes a consistency ratio (CR) to examine the
consistency of the matrix. He suggests that the matrix should be re-evaluated if
Table 5. Proportion of each group of resident agents.
Types of resident agent
Household size Without children With children
Income Low Middle High Low Middle High
income income income income income income
Proportion (%) 9 39 9 6 31 6
14. 34 X. Li and X. Liu
Table 6. Weights for different groups of resident agents obtained using Saaty’s method.
Weights
Types of Land Surrounding Public
residents price environment Accessibility facilities Education Total CR
Low income 0.443 0.093 0.206 0.155 0.103 1 0.042
without children
Low income 0.401 0.081 0.154 0.081 0.283 1 0.087
with children
Middle income 0.175 0.379 0.165 0.194 0.087 1 0.057
without children
Middle income 0.220 0.276 0.142 0.140 0.222 1 0.094
with children
High income 0.048 0.526 0.194 0.141 0.091 1 0.072
without children
High income 0.084 0.434 0.171 0.076 0.235 1 0.064
with children
the ratio value is greater than 0.10. Table 6 shows the results of the weights derived
from Saaty’s method.
4.5 Generating planning scenarios
This simulation assumes that each new urbanized cell can accommodate one
resident agent. The total number of resident agents was determined according to the
allowed amount of land consumption. The discount rate r was set to 0.1 for
calculating the optimal distribution of land consumption. The detailed procedures
for generating development alternatives are as follows:
1. Determining the total number of resident agents according to the allowed
amount of land consumption for each planning period.
2. Using the Monto Carlo method to create a resident agent according to the
proportion of various types of residents based on census data (table 3).
3. The development probability related to the local interactions of physical
factors is estimated by the logistic-CA model, which is calibrated using the
classified satellite images.
4. Using equation (12) and table 6 to compute the utility function for this
resident agent.
5. Selecting the locations with the highest utility values and estimating
development probability for these places according to the interactions
described in equation (16).
6. Determining whether the locations of the highest combined probability values
will be developed using the Monto Carlo method. If yes, the location will be
marked and go to step 2 to create a new resident agent. If no, the next site of
the second highest utility value will be evaluated until this existing agent has
been accommodated.
7. This procedure continues until all the required resident agents have been
accommodated.
This model was used to simulate both baseline development scenarios and
planning development scenarios. The baseline scenarios were generated according to
the development trend. Planning scenarios were produced by incorporating the
15. Sustainable development strategies 35
initiatives of sustainable development in the modelling. The intervention from
government agents is crucial for producing planning scenarios instead of baseline
scenarios. In this study, the intervention was first represented by using the initial
pre-defined approval probability (P0 ) for government agents. There are five
gov
regimes of land development for the simulation, as follows.
4.5.1 Baseline scenario. This simulation is based on the trajectory of past
development. This regime assumes that no sustainable development strategies are
adopted to regulate existing development trends. No spatial and temporal
efficiencies are implemented in this simulation. Table 7 lists the initial pre-defined
approval probability (P0 ) from government agents for this regime. This simulation
gov
can generate the scenario provided that the city continues to develop without any
constraints. Urban planners can compare this baseline scenario with the following
planning scenarios.
4.5.2 Planning scenario 1: compact development. Some government intervention is
implemented by controlling land consumption in the spatio-temporal dimension.
The equity of using land resources is emphasized by properly arranging land-use
conversion at each planning stage according to equation (9). This planning scenario
also adopts a high priority on implementing the spatial efficiency in terms of
compact development by using the initial pre-defined approval probability (P0 )gov
(table 8). Land-use types will not impose restrictions on land development so that
compact patterns can be formulated in the simulation.
Table 7. Initial pre-defined approval probability (P0 ) for simulating baseline
gov
development.
Planning
Existing Urban land Water Farmland Forest Orchard Other
Urban 1.00 0.00 0.00 0.00 0.00 0.00
land
Water 0.02 0.00 0.00 0.00 0.00 0.00
Farmland 0.60 0.00 0.15 0.20 0.20 0.30
Forest 0.65 0.00 0.20 0.25 0.25 0.35
Orchard 0.68 0.00 0.20 0.30 0.20 0.40
Other 0.90 0.00 0.40 0.40 0.45 0.60
Table 8. Initial pre-defined approval probability (P0 ) for simulating planning scenario
gov
1: compact development.
Planning
Existing Urban land Water Farmland Forest Orchard Other
Urban 1.00 0.00 0.00 0.00 0.00 0.00
land
Water 1.00 0.00 0.00 0.00 0.00 0.00
Farmland 1.00 0.00 0.00 0.00 0.00 0.00
Forest 1.00 0.00 0.00 0.00 0.00 0.00
Orchard 1.00 0.00 0.00 0.00 0.00 0.00
Other 1.00 0.00 0.00 0.00 0.00 0.00
16. 36 X. Li and X. Liu
4.5.3 Planning scenario 2: farmland protecting development. This regime is to
ensure the equity of using land resources across generations and avoid the
encroachment on agricultural land as well. The former is realized by arranging the
proper land consumption at different planning stages, and the latter is implemented
by using the initial pre-defined approval probability (P0 ) for government agents
gov
(table 9). A very small probability will be given to the development of agricultural
land. This planning scenario can allow land resources to be used more efficiently
than the baseline pattern.
4.5.4 Planning scenario 3: green-land protecting development. This regime pays
special attention to implementing the concept of ‘garden cities’ while land
consumption is also constrained by the equity criterion. It addresses the growing
concern for a better living environment after residents have secured their basic
housing demand. This is a further development stage compared with planning
scenario 2. Table 10 shows the initial pre-defined approval probability (P0 ) which
gov
imposes extreme restrictions on converting green land and orchard land into
residential use.
4.5.5 Planning scenario 4: housing-demand development. This scenario just
completely satisfies housing demand from resident agents at each location without
government controls. Land-use types do not impose any restrictions on land
development. Therefore, all the initial probability values are set to 1 for this regime.
Figure 6 is the outcome from the simulation of baseline patterns in the study area
in 2000–2010 according to historical growth. Planning scenarios can be simulated by
Table 9. Initial pre-defined approval probability (P0 ) for simulating planning scenario
gov
2: farmland protecting development.
Planning
Existing Urban land Water Farmland Forest Orchard Other
Urban 0.00 0.00 0.00 0.00 0.00 0.00
land
Water 0.00 0.00 0.00 0.00 0.00 0.00
Farmland 0.10 0.00 0.00 0.05 0.05 0.10
Forest 0.75 0.00 0.25 0.30 0.30 0.35
Orchard 0.80 0.00 0.05 0.35 0.25 0.40
Other 0.95 0.00 0.15 0.40 0.45 0.70
Table 10. Initial pre-defined approval probability (P0 ) for simulating planning scenario
gov
3: green-land protecting development.
Planning
Existing Urban land Water Farmland Forest Orchard Other
Urban 0.00 0.00 0.00 0.00 0.00 0.00
land
Water 0.00 0.00 0.00 0.00 0.00 0.00
Farmland 0.65 0.00 0.35 0.20 0.20 0.50
Forest 0.10 0.00 0.05 0.00 0.00 0.10
Orchard 0.15 0.00 0.05 0.00 0.00 0.15
Other 0.95 0.00 0.50 0.30 0.35 0.70
17. Sustainable development strategies 37
Figure 6. Simulation of baseline development patterns of Guangzhou based on historical
trends.
incorporating the criteria of sustainable development and properly modifying the
parameters of this agent-based model. Figure 7(a) is to simulate compact
development, which can reduce the energy consumption in transportation. It is
also able to reduce the encroachment on agricultural land by introducing
government intervention (figure 7(b)). However, this scenario may result in some
fragmented patterns. Planning scenario 3 (green-land protecting development)
emphasizes the preservation of green land and orchard land (figure 7(c)). Planning
scenario 4 (housing-demand development) is associated with significant dispersed
development patterns, since it just satisfies housing demand from resident agents
(figure 7(d)).
18. 38 X. Li and X. Liu
Figure 7. Simulation of planning development patterns of Guangzhou in 2010. (a) Compact
development. (b) Farmland protecting development. (c) Greenland protecting development.
(d) Housing-demand development.
19. Sustainable development strategies 39
4.6 Metrics for the comparisons among the simulated scenarios
Statistical comparisons among the simulated scenarios were carried out for
providing planning implications according to a number of metrics. These metrics,
which will indicate the gain and loss of land development, include the indicators of
compactness, development suitability gain, agricultural suitability loss, green-land
loss, and farmland loss. The first two indicators are related to the gain, and the last
three are related to the loss of land development.
The compactness of land development can be calculated according to the average
comparison between the perimeter of a developed cluster and the standard perimeter
of the circle which has the same area (Li and Yeh 2004). The index can be
represented using the following equation:
sffiffiffiffiffiffiffiffiffiffiffiffi,X
X
CI~ Sj Pj ð21Þ
j j
where CI is the value of the compactness index, and Sj and Pi are the area and
perimeter of the developed cluster (polygon) jj. It is obvious that land development
with average narrow shapes or dispersed development patterns will have low values
for the index.
The developed sites should have higher values of development suitability and
lower values of agricultural suitability for spatial efficiency (Li 2005). Therefore, the
development suitability gain can be obtained by summing up the urban development
suitability for all the developed cells:
X
Dgain ~ Sur ðiÞ ð22Þ
i
where Dgain is the development suitability gain, and Sur(i) is the urban development
suitability at cell i where land development takes place.
The agricultural suitability loss can be calculated using this similar method:
X
Aloss ~ Sag ðiÞ ð23Þ
i
where Aloss is the agricultural suitability loss, and Sag(i) is the agricultural suitability
at cell i where land development takes place.
The last two indicators are to sum up the total amounts of green-land loss and
farmland loss for each scenario. Table 11 is the analysis results from these five
metrics. Figure 8 shows the gain of land development for these simulated scenarios.
The baseline scenario and planning scenario 4 (housing-demand development) have
lower values of the compactness, although they have higher values of development
suitability gain.
Figure 9 further displays the loss related to land development for these scenarios.
The baseline scenario and planning scenario 4 (housing-demand development) have
larger values for the indicators of agricultural suitability loss, green-land loss, and
farmland loss. Planning scenario 1 (compact development) and planning scenario 3
(green-land protecting development) have lower values for the green-land loss.
Planning scenario 2 (farmland protecting development) has the lowest value for
farmland loss.
The final assessment of these scenarios is based on a linear combination of these
five indicators. The values from these five indicators should be normalized into the
20. 40 X. Li and X. Liu
Table 11. Comparisons among the simulated scenarios using various metrics.
Development Agricultural
suitability suitability Green-land Farmland
Development Compactness gain loss loss loss
patterns Year (61023) (6103) (6103) (6106m2) (6106m2)
Baseline scenario 2000 19.1 46.3 72.5 1.4 1.9
2005 19.5 73.7 109.2 4.9 3.1
2010 19.7 91.2 135.8 6.5 4.9
Planning scenario 2000 20.1 44.3 60.1 1.0 1.2
1: compact 2005 22.3 71.9 95.7 2.2 2.5
development 2010 23.4 89.6 106.5 3.0 3.6
Planning scenario 2000 19.9 41.4 57.1 2.9 0.5
2: farmland 2005 21.2 68.4 89.8 4.7 0.8
protecting 2010 21.0 85.2 99.6 6.2 1.1
development
Planning scenario 2000 20.2 39.1 64.8 1.2 0.9
3: green-land 2005 22.4 66.4 103.5 2.5 1.5
protecting 2010 23.8 82.4 115.8 3.4 2.2
development
Planning 2000 18.7 54.9 79.0 3.0 3.1
scenario 4: 2005 18.9 81.4 112.0 7.2 4.3
housing-demand 2010 19.3 102.4 148.6 10.5 5.2
development
Figure 8. Gain of the simulation scenarios.
22. 42 X. Li and X. Liu
range of 0–1 before the use of the linear combination. The normalization is different
for these two types of factors: gain (higher scores are better; e.g. compactness and
development suitability gain) and loss (lower scores are better, e.g. agricultural
suitability loss, green-land loss, farmland loss).
The gain factors are as follows:
x{Min
x0 ~ ð24Þ
Max{Min
The loss factors are as follows:
Max{x
x0 ~ ð25Þ
Max{Min
where x is the original data, Max and Min are the maximum and minimum values,
x9 is the normalized value.
Figure 10 shows the final result from the linear combination of these five
normalized metrics. The same weight is applied to each indicator, since there is no
prior knowledge. It is also clear that the baseline scenario and planning scenario 4
(housing-demand development) have a poorer performance from the assessment.
Planning scenario 1 (compact development) and planning scenario 3 (green-land
protecting development) have a better performance according to the combined
indicator.
Figure 10. Final assessment of the simulated scenarios using a linear combination of five d
metrics.
23. Sustainable development strategies 43
5. Conclusion
This paper has demonstrated that agent-based modelling techniques can be further
extended to the simulation of development alternatives. The strategies for
sustainable development are incorporated in the modelling by properly defining
agents’ behaviours. Spatial efficiency of using land resources is implemented by
selecting suitable sites for development according to planning objectives. The
efficient allocation of land resources over the temporal dimension is realized by
defining decision behaviours of government agents.
Sustainable land development is a complex issue which involves negotiations and
compromises of various stakeholders. Local interactions from this integrated model
are essential for dealing with these complex situations. In this study, the
heterogeneity of agents is reflected by using different sets of weights according to
GIS data. Development plans can be generated to implement sustainable
development initiatives through the interactions between government agents,
developer agents, and resident agents. Since several compromises have been
adopted in the simulation, the simulated alternatives should be more realistic and
practical for planning practice.
Five scenarios of land development have been simulated by using this proposed
model. The effects of these scenarios are compared according to a number of
metrics, such as compactness, development suitability gain, agricultural suitability
loss, green-land loss, and farmland loss. These metrics are used to quantify the gain
and loss of land development by providing planning implications. The comparison
can identify the best scenario for a certain planning objective. For example, the
baseline scenario and planning scenario 4 (housing-demand development) have
lower values for gain, and larger values for loss. However, planning scenario 2
(farmland protecting development) has the lowest values of farmland loss.
A combined index can be devised to take account of all these five metrics. This
index also indicates that the baseline scenario and planning scenario 4 (housing-
demand development) have a poorer performance, whereas planning scenario 1
(compact development) and planning scenario 3 (green-land protecting develop-
ment) have a better performance for land development.
Like other agent-based models, this model also involves many parameters that
have critical effects on the simulation results. Although some calibration procedures
have been carried out, a finer tuning of this model still requires considerable effort.
Further studies should be carried out in developing the methods of calibrating
agents’ properties in a more consistent way. There is still a general lack of detailed
spatial information that can be used to define the decision behaviours of agents for
Chinese cities. More detailed resident agents can be defined to improve simulation
performance when such spatial information is available.
Acknowledgements
This study was supported by the National Outstanding Youth Foundation of China
(Grant No. 40525002), the National Natural Science Foundation of China (Grant
No. 40471105), and the PhD development program from the Ministry of Education
of China (Project No. 20040558023).
References
BASU, N. and PRYOR, R.J., 1997, Growing a Market Economy, Technical Report SAND-97-
2093 (Albuquerque, NM: Sandia National Laboratories).
24. 44 X. Li and X. Liu
BATTY, M. and XIE, Y., 1994, From cells to cities. Environment and Planning B: Planning and
Design, 21, pp. 531–548.
COURDIER, R., GUERRIN, F., ANDRIAMASINORO, F.H. and PAILLAT, J.M., 2002, Agent-based
simulation of complex systems: application to collective management of animal
wastes. Journal of Artificial Societies and Social Simulation, 5. Available online at:
http://jasss.soc.surrey.ac.uk/5/3/courdier.html (accessed 12 January 2006).
EASTMAN, J.R., 1999, Multi-criteria evaluation and GIS. In Geographical Information
Systems, P.A. Longley, M.F. Goodchild, D.J. Maguire and D.W. Rhind (Eds), pp.
493–502 (New York: Wiley).
GILBERT, N. and CONTE, R., 1995, Artificial Societies: the computer simulation of social life.
UCL Press.
HENTON, D. and STUDWELL, K., 2000, Informed Regional Choices: How California’s Regional
Organizations are Applying Planning and Decision Tools (Oakland, CA: California
Center for Regional Leadership).
JANTZ, P., GOETZ, S. and JANTZ, C., 2005, Urbanization and the loss of resource lands in the
Chesapeake bay watershed. Environmental Management, 36, pp. 808–825.
LI, X. and YEH, A.G.O., 2000, Modelling sustainable urban development by the integration
of constrained cellular automata and GIS. International Journal of Geographical
Information Science, 14, pp. 131–152.
LI, X. and YEH, A.G.O., 2001, Zoning land for agricultural protection by the integration of
remote sensing, GIS and cellular automata. Photogrammetric Engineering Remote
Sensing, 67, pp. 471–477.
LI, X. and YEH, A.G.O., 2004, Analyzing spatial restructuring of land use patterns in a fast
growing region using remote sensing and GIS. Landscape and Urban Planning, 69, pp.
335–354.
LI, X., 2005, A four-component efficiency index for assessing land development using
remote sensing and GIS. Photogrammetric Engineering Remote Sensing, 71, pp.
47–57.
LOIBL, W. and TOETZER, T., 2003, Modelling growth and densification processes in suburban
regions—simulation of landscape transition with spatial agents. Environmental
Modelling Software, 18, pp. 553–563.
MARKANDYA, A. and RICHARDSON, J., 1992, The economics of the environment: an
introduction. In Environmental Economics, A. Markandya and J. Richardson (Eds),
pp. 7–25 (London: Earthscan).
MCFADDEN, D., 1978, Modelling the choice of residential location. In Spatial Interaction
Theory Planning Models, A. Karlqvist, L. Lundqvist, F. Snickars and J. Weibull
(Eds), pp. 75–96 (Amsterdam: North Holland).
NIJKAMP, P., OUWERSLOOT, H. and RIENSTRA, S.A., 1997, Sustainable urban transport
systems: an expert-based strategic scenario approach. Urban Studies, 34, pp. 693–712.
SAATY, T.L., 1990, The Analytic Hierarchy Process: Planning, Priority Setting, Resource
Allocation (Pittsburgh, PA: University of Pittsburgh).
STATISTICAL BUREAU OF GUANGZHOU 2000, Guangzhou Statistical Yearbook (China
Statistics Press), pp. 187–190.
TIETENBERG, T., 1992, Environmental and Natural Resource Economics (New York:
HarperCollins).
TORRENS, P.M. and BENENSON, I., 2005, Geographic automata systems. International Journal
of Geographical Information Science, 19, pp. 385–412.
WHITE, R. and ENGELEN, G., 1993, Cellular automata and fractal urban form: a cellular
modelling approach to the evolution of urban land use patterns. Environment and
Planning A, 25, pp. 1175–1199.
WU, F., 2002, Calibration of stochastic cellular automata: the application to rural–urban land
conversions. International Journal of Geographical Information Science, 16, pp.
795–818.
25. Sustainable development strategies 45
WU, F. and WEBSTER, C.J., 1998, Simulation of land development through the integration of
cellular automata and multicriteria evaluation. Environment and Planning B, 25, pp.
103–126.
YEH, A.G.O. and LI, X., 1998, Sustainable land development model for rapid growth areas
using GIS. International Journal of Geographical Information Science, 12, pp. 169–189.
YEH, A.G.O. and LI, X., 1999, Economic development and agricultural land loss in the Pearl
River Delta, China. Habitat International, 23, pp. 373–390.
YEH, A.G.O. and LI, X., 2006, Errors and uncertainties in urban cellular automata.
Computers, Environment and Urban Systems, 30, pp. 10–28.
ZANDERA, P. and KACHELE, H., 1999, Modelling multiple objectives of land use for
¨
sustainable development Agricultural Systems, 59, pp. 311–325.