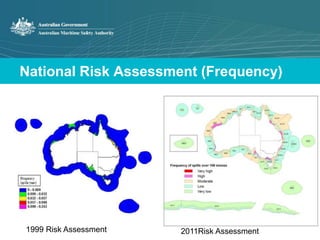
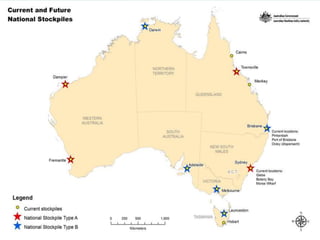
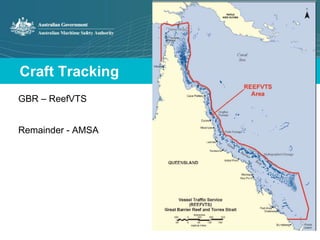
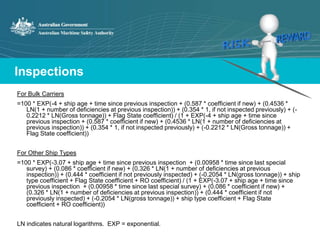
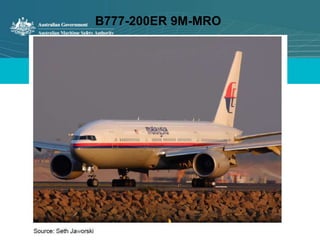
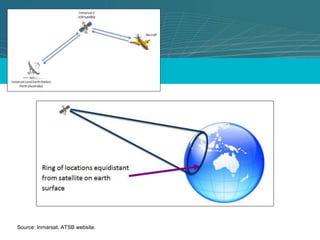
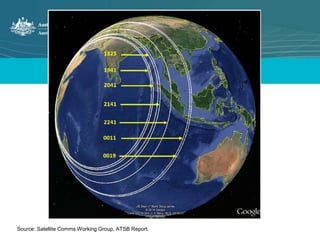
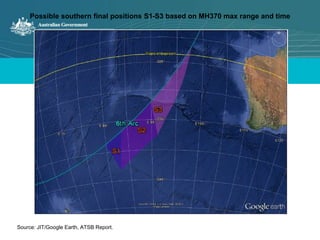
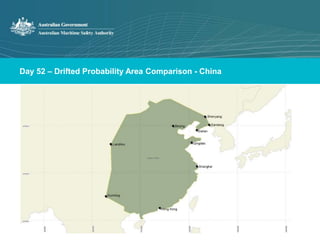
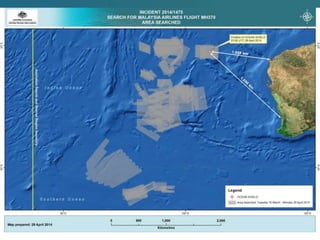
NATIONAL CONFERENCE & 
EXHIBITION 2014 
Embedding Risk in Everything we do. 
Allan Schwartz 
Australian Maritime Safety Authority 
Platinum Sponsor 
Silver 
Sponsor 
Bronze Sponsor 
Risk Manager of the Year 
Award Sponsor 
Conference and Exhibition 
Partners
Who is AMSA??? 
IWRAP Mk2 
IALA’s Quantitative Risk Assessment 
Model
Australian Maritime Safety Authority 
http://www.amsa.gov.au/about-amsa/corporate-information/mission-and-vision/
AMSA’s purpose 
Is to: 
► provide leadership in the development of safety and 
environmental protection standards for responsible 
operation of ships and safety to seafarers; 
► monitor compliance with safety and environment 
protection standards; 
► respond to threats to the marine environment; 
► provide systems that aid safe marine navigation; and 
► rescue people in maritime and aviation distress 
situations.
Australia’s Maritime Zone 
► 3rd largest EEZ – 8.232 m km2 
► 12,000 islands 
► 59,736 kms of coastline 
► 6 maritime boundaries 
► covers all 5 of world’s ocean 
temperature zones
Townsville 
Geraldton
HOW MUCH IS ENOUGH? 
Internal Organisational Risk Management 
Comcover Awards for Excellence in Risk Management
But why???
External Risk 
Response – the obvious one 
• Search and Rescue 
• Pollution Response 
• Casualty/Incident Response
Dornier airborne SAR units
Pacific Adventurer
Pacific Adventurer
Other incidents
Ship banned from Australian ports 
The Australian Maritime Safety Authority has today placed a three-month ban on Vega Auriga (IMO 9347786). 
The Liberian-flagged, 9981gt container vessel now on its way to Auckland, New Zealand from Brisbane, Australia is prohibited from entering any 
Australian port for three months. 
The Australian Maritime Safety Authority (AMSA) reported that the vessel had been detained three times since July 2013 for breaches of the Maritime 
Labour Convention. 
The breaches included improper payment of wages, inadequate living and working conditions and inadequate maintenance making the vessel 
unseaworthy and substandard. 
An AMSA spokesperson told IHS Maritime that the improper payment of wages were systemic, but would not divulge the amount. AMSA had notified 
authorities in the next port of call. 
“New Zealand is aware of the issues, as are all members of the Tokyo MOU (Memorandum of Understanding) on Port State Control,” he told IHS 
Maritime. 
General manager of AMSA’s Ship Safety Division Allan Schwartz stressed that ships trading with Australia must meet international standards. 
“Vessels that do not meet such standards, including standards for the welfare and treatment of crew, pose an increased risk to seafarers, safe operations 
and the marine environment,” he said in a release. 
“Seafarer welfare is just as important as the proper maintenance of ship equipment, and an integral part of safe operations. A failure in either system 
could lead to serious accidents.” 
The ship’s management has been contacted for comment.
What if?
Prevention – the less obvious one
Marine Environment -Emergency Towage 
► minimum level of emergency towage 
around coast for incident management 
► three tiers: 
- Level 1: dedicated ETV (tug) in 
northern Great Barrier Reef & Torres 
Strait 
- Level 2: contracted capability in 
strategic locations 
- Level 3: vessels of opportunity
National Risk Assessment (Frequency) 
1999 Risk Assessment 2011Risk Assessment
National Risk assessment (Environment) 
Environmental Sensitivity Environmental Risk Index
Risk Assessment – Future Trends 
o Increase of 79% in total national port 
traffic 
o Increase of 81% in total national traffic 
o Small commercial vessels assumed to 
remain at present levels 
o Offshore drilling assumed to remain at 
current levels 
o Offshore oil production to reduce by 
89% 
o Condensate production to increase by 
73% (overall decline by 35%) 
o Shore based oil consumption to 
increase by 14% 
Source 2011 2020 
Tonnes/ 
year 
% Tonnes 
/year 
% 
Trading 
ships at sea 
212 22.3 387 32.2 
Trading 
ships in 
port 
174 18.3 337 28.1 
Small 
commercial 
vessels 
2 .2 2 .2 
Offshore 
production 
310 32.7 217 18.1 
Offshore 
drilling 
209 22 209 17.4 
Shore-based 
42 4.5 48 4
Navigation Safety
Traffic Routeing Measures
Craft Tracking 
GBR – ReefVTS 
Remainder - AMSA
Craft Tracking
Under Keel Clearance
The commodities 
boom…
Inspections 
For Bulk Carriers 
=100 * EXP(-4 + ship age + time since previous inspection + (0.587 * coefficient if new) + (0.4536 * 
LN(1 + number of deficiencies at previous inspection)) + (0.354 * 1, if not inspected previously) + (- 
0.2212 * LN(Gross tonnage)) + Flag State coefficient) / (1 + EXP(-4 + ship age + time since 
previous inspection + (0.587 * coefficient if new) + (0.4536 * LN(1 + number of deficiencies at 
previous inspection)) + (0.354 * 1, if not inspected previously) + (-0.2212 * LN(Gross tonnage)) + 
Flag State coefficient)) 
For Other Ship Types 
=100 * EXP(-3.07 + ship age + time since previous inspection + (0.00958 * time since last special 
survey) + (0.086 * coefficient if new) + (0.326 * LN(1 + number of deficiencies at previous 
inspection)) + (0.444 * coefficient if not previously inspected) + (-0.2054 * LN(gross tonnage)) + ship 
type coefficient + Flag State coefficient + RO coefficient) / (1 + EXP(-3.07 + ship age + time since 
previous inspection + (0.00958 * time since last special survey) + (0.086 * coefficient if new) + 
(0.326 * LN(1 + number of deficiencies at previous inspection)) + (0.444 * coefficient if not 
previously inspected) + (-0.2054 * LN(gross tonnage)) + ship type coefficient + Flag State 
coefficient + RO coefficient)) 
LN indicates natural logarithms. EXP = exponential.
Current AIS vessel 
tracks in Australia
Projected Traffic in 
2015
Projected Traffic in 
2020
Projected Traffic in 
2025
Projected Traffic in 
2030
Ports in the North West
Production & exploration 
leases off shore (2009) 
Petroleum – Exploration & Production leases
Existing & Proposed 
Marine Parks 
Marine Parks – Existing & Proposed
The Search for Malaysia Airlines MH370 
AMSA Experience
B777-200ER 9M-MRO
Flight Path derived from RADAR data. 
Source: JIT/Google Earth, ATSB Report.
Source: Inmarsat, ATSB website.
MH370 Handshakes 
Source: ATSB
Source: Satellite Comms Working Group, ATSB Report.
Example of one comparison against actual flight 
MH021 7 March 2014 
Red path = predicted path; Yellow track = actual aircraft track 
Source: Satellite Working Group, ATSB Report.
Possible southern final positions S1-S3 based on MH370 max range and time 
Source: JIT/Google Earth, ATSB Report.
Possible final positions S4-S5 with 7th arc and max range cruise line 
Source: JIT/Google Earth, ATSB Report.
Information: Many Sources – some examples 
 Flight details - plan, fuel load, performance data 
 Emergency equipment - distress beacons, slide rafts, etc 
 B777 structural materials (what will float?) 
 Cargo Manifest (debris analysis) 
 Satellite imagery 
 Contrail analysis – satellite imagery 
 Weather and environmental – atmospheric and oceanographic 
 Underwater hydrophones 
 Logistics – search aircraft, vessels, personnel, equipment, shore-based 
support, communications
Plot of hydrophone acoustic event recorded 
Magenta cross = most probable location of source; yellow area = uncertainty region 
Most Probable Location 
Source: Curtin University, ATSB Report.
Some of the Search Challenges 
 Minimal data to calculate accurate splash point 
 No ELT detections 
 Last known position versus subsequent time flown to unknown location 
 Vast and changing search areas 
 Remote oceanic area, long distance offshore 
 Movement of search areas following JIT analysis – time to redeploy search 
assets. 
 Elapsed time – impact on oceanic drift and debris dispersal 
 Tropical Cyclone influence on drift calculations and search 
 Search aircraft – available endurance 
 Availability of detailed description of cargo from manifest 
 Information on B777 components likely to float.
Some of the Search Challenges 
 Time for ships to reach aircraft sightings 
 Availability of ship-borne helicopters to investigate sightings 
 Sea pollution 
 Poor weather and search conditions on a number of days 
 Elapsed time between satellite imagery analysis and tasking aircraft/ships to 
investigate possible objects 
 Multi-national civil/military coordination and communication 
 Sustainment of large logistical requirements 
 Media appetite. Social media useful. 
 Processing large amount of publicly submitted data online and crowd sourcing 
satellite imagery.
Drift Planning Working Group 
 Supplement standard JRCC drift planning. 
 Purpose – to ensure international best methodology and 
consensus drift modelling techniques applied to MH370 splash 
point area 
 Search area – floating debris 
 “Reverse” drift – from floating debris location backwards 
to estimated splash point.
Drift Planning Working Group 
 Maritime SAR and Oceanography experts: 
 AMSA 
 CSIRO – Marine and Atmospheric Research 
 Asia Pacific Applied Science Associates (APASA) 
 Australian Bureau of Meteorology 
 Global Earth Modelling Systems (GEMS) 
 US Coast Guard 
 Multiple datasets/models 
 SLDMBs
• Zero Leeway model – 
confirms actual 
surface Total Water 
Movement 
• Provides sea water 
temperature – varied 
from 7 to 28oC 
• SLDMB – Self Locating Datum Marker buoy 
• MetOcean Product – GPS receiver and Iridium 
transmitter – average life 21 days 
• Can be deployed from aircraft or vessel
SLDMBs 
• 33 x SLDMB’s successfully 
deployed to validate drift 
modelling 
• Comparisons run against all 
three oceanic current data 
sets used for modelling
Day 52 - Overall Drifted Probability Area
Day 52 – Drifted Probability Area Comparison – East Coast Australia
Day 52 – Drifted Probability Area Comparison - Europe
Day 52 – Drifted Probability Area Comparison – North America
Day 52 – Drifted Probability Area Comparison - China
JACC – Joint Agency Coordination Centre 
 Established 30th March. 
 Ensure the search being coordinated by AMSA and 
ATSB is reinforced by strong liaison with all relevant 
stakeholders, including families of passengers. 
 Staff seconded from relevant departments/agencies. 
 Originally located Perth. Moved to Canberra 9th May 
2014.
Search Phase Transition – 28th April 2014 
• Search for floating debris suspended 
• Transition to intensified underwater search 
• Search led by ATSB 
• Overall investigation – Malaysian Government
End of Search Phase – 28th April 2014 
• 42 day search. 345 flight sorties. 3177 total flight hours. 
• 4.7 million square km cumulative search area 
• Search aircraft: 
• Civil – Australia and NZ (10) 
• Military – Australia (5), USA (2), China (2), New Zealand (2), Japan 
(3), Malaysia (2), Republic of Korea (2) 
• Search vessels: 
• Civil – Merchant ships 
• Military – Australia, China, USA, UK, Malaysia
Ocean Shield TPL search coverage 4-14 April 2014 
Source: Phoenix International and ATSB Report.
Next search phase 
 Led by ATSB. 
 Further work continued to refine analysis of both flight and satellite data by 
specialists from UK, USA and Australia. 
 Priority area determined approximately 60,000 km2 
 This area subject of surface search Day 21-26. 
 Bathymetry of ocean floor since mid-May. Contracted vessel and Chinese 
military vessel. 
 Tender for specialist company capable of deep-water search for MH370. 
 Intensified underwater search planned to commence August 2014. 
Expected to take 12 months.
Comparison with AF447 
 1st June 2009 
 Air France Airbus A330, Flight AF447 
 Rio de Janeiro to Paris 
 228 persons on board 
 Crashed in remote area, Atlantic Ocean 
 Investigation - French BEA (Bureau d'Enquêtes et 
d'Analyses pour la sécurité de l'aviation civile)
Comparison with AF447 
AF447 MH370 
Flight Planned Route Was on planned route when reported 
missing. 
Deviated significantly from planned route to 
take up unknown route. 
Last Known Position Was reporting by ACARS every 10 minutes. 
ACARS failure messages from AF447 were 
received by Air France including a Last 
Known Position (LKP). 
Was reporting by ACARS up till disappeared. 
No further data other than satellite pings via 
INMARSAT. 
Speed Known = Mach 0.82 derived from ACARS 
message information. 
Unknown.
Comparison with AF447 
AF447 MH370 
Search Area Initial Search Area: 
40NM (74KM) radius centred on Last Known 
Position (LKP) 
= 17,000 square KM. 
Initial Australian Search Area: 
693,170 square KM = 40 times larger than 
AF447 initial search area. 
Cumulative Australian search area total 
18MAR to 28APR (last day search for 
surface debris): 
Almost 4.7 million square KM. 
Search for Surface Debris 26 days. 
This was based on no further bodies or 
aircraft debris being found for the final 9 
days of the search. 
- Aircraft search operations ceased. 
- Ship search operations ceased, except 
for French Navy vessels which 
remained conducting acoustic search 
for the ULBs. 
In Australian SRR = 42 days
Comparison with AF447 
AF447 MH370 
First Floating Debris Found Day 5 about 70KM from LKP. 
NOTE – the BEA report states that this 
(distance) considerably complicated the 
search for the underwater wreckage. 
Nil associated with MH370. 
Floating Debris/Bodies Marine pollution contributed to confusion in 
the early days of the search. Air searches 
found lots of debris – it was difficult for air 
crews to distinguish between marine 
pollution and small debris that may have 
been from AF447. It was not until ships 
arrived in the area working with aircraft that 
debris was able to be identified properly. 
About 50 bodies were recovered by ships. 
Same experience with marine pollution. 
Datum Buoys deployed 9 33
Comparison with AF447 
AF447 MH370 
“Drift Committee” An expert working group of experts in SAR 
drift, oceanography, meteorology, etc 
attempted to estimate the crash location 
through “reverse drift” calculations. 
Various positions were calculated by 
different agencies using different methods 
and models with up to a 100KM variance. 
Similar expert working group formed within 
AMSA’s RCC Australia. 
Nil surface debris located to allow “reverse 
drift” calculation. 
Satellite imagery No useful results. 
Images from civil and military satellites were 
used. 
Aircraft flown to investigate objects 
detected by satellite failed to identify debris 
from AF447. 
Similar experienced.
Comparison with AF447 
AF447 MH370 
Wreckage Location 6.5NM (12KM) from LKP. 
Depth 3900 metres. 
Wreckage found 2APR11 (671 days after 
AF447 missing) following detection by AUVs 
of a concentration of SONAR returns. 
Wreckage spread over area of 10,000 
square metres. Few large parts found. 
2 further months spent recovering flight 
recorders and aircraft parts, mapping debris 
and recovering human remains. 
Unknown. 
Search area depth 3800 - 4800 metres.
Comparison with AF447 
AF447 MH370 
Cost of SAR Operation Estimated 80 million Euro 
($118 million AUD) 
TBA 
Cost of Undersea 
Operation 
Estimated 31 million Euro 
($46 million AUD) 
TBA 
Total Cost of SAR and 
Undersea Operations 
Estimated 111 million Euro 
($164 million AUD) 
TBA
NATIONAL CONFERENCE & 
EXHIBITION 2014 
Title of presentation 
Presented by Insert Name 
Insert Company Details 
Platinum Sponsor 
Silver 
Sponsor 
Bronze Sponsor 
Risk Manager of the Year 
Award Sponsor 
Conference and Exhibition 
Partners

Embedding Risk in Everything we do

  • 1.
    NATIONAL CONFERENCE & EXHIBITION 2014 Embedding Risk in Everything we do. Allan Schwartz Australian Maritime Safety Authority Platinum Sponsor Silver Sponsor Bronze Sponsor Risk Manager of the Year Award Sponsor Conference and Exhibition Partners
  • 2.
    Who is AMSA??? IWRAP Mk2 IALA’s Quantitative Risk Assessment Model
  • 3.
    Australian Maritime SafetyAuthority http://www.amsa.gov.au/about-amsa/corporate-information/mission-and-vision/
  • 4.
    AMSA’s purpose Isto: ► provide leadership in the development of safety and environmental protection standards for responsible operation of ships and safety to seafarers; ► monitor compliance with safety and environment protection standards; ► respond to threats to the marine environment; ► provide systems that aid safe marine navigation; and ► rescue people in maritime and aviation distress situations.
  • 5.
    Australia’s Maritime Zone ► 3rd largest EEZ – 8.232 m km2 ► 12,000 islands ► 59,736 kms of coastline ► 6 maritime boundaries ► covers all 5 of world’s ocean temperature zones
  • 6.
  • 7.
    HOW MUCH ISENOUGH? Internal Organisational Risk Management Comcover Awards for Excellence in Risk Management
  • 8.
  • 9.
    External Risk Response– the obvious one • Search and Rescue • Pollution Response • Casualty/Incident Response
  • 12.
  • 14.
  • 15.
  • 17.
  • 20.
    Ship banned fromAustralian ports The Australian Maritime Safety Authority has today placed a three-month ban on Vega Auriga (IMO 9347786). The Liberian-flagged, 9981gt container vessel now on its way to Auckland, New Zealand from Brisbane, Australia is prohibited from entering any Australian port for three months. The Australian Maritime Safety Authority (AMSA) reported that the vessel had been detained three times since July 2013 for breaches of the Maritime Labour Convention. The breaches included improper payment of wages, inadequate living and working conditions and inadequate maintenance making the vessel unseaworthy and substandard. An AMSA spokesperson told IHS Maritime that the improper payment of wages were systemic, but would not divulge the amount. AMSA had notified authorities in the next port of call. “New Zealand is aware of the issues, as are all members of the Tokyo MOU (Memorandum of Understanding) on Port State Control,” he told IHS Maritime. General manager of AMSA’s Ship Safety Division Allan Schwartz stressed that ships trading with Australia must meet international standards. “Vessels that do not meet such standards, including standards for the welfare and treatment of crew, pose an increased risk to seafarers, safe operations and the marine environment,” he said in a release. “Seafarer welfare is just as important as the proper maintenance of ship equipment, and an integral part of safe operations. A failure in either system could lead to serious accidents.” The ship’s management has been contacted for comment.
  • 21.
  • 24.
    Prevention – theless obvious one
  • 25.
    Marine Environment -EmergencyTowage ► minimum level of emergency towage around coast for incident management ► three tiers: - Level 1: dedicated ETV (tug) in northern Great Barrier Reef & Torres Strait - Level 2: contracted capability in strategic locations - Level 3: vessels of opportunity
  • 26.
    National Risk Assessment(Frequency) 1999 Risk Assessment 2011Risk Assessment
  • 27.
    National Risk assessment(Environment) Environmental Sensitivity Environmental Risk Index
  • 28.
    Risk Assessment –Future Trends o Increase of 79% in total national port traffic o Increase of 81% in total national traffic o Small commercial vessels assumed to remain at present levels o Offshore drilling assumed to remain at current levels o Offshore oil production to reduce by 89% o Condensate production to increase by 73% (overall decline by 35%) o Shore based oil consumption to increase by 14% Source 2011 2020 Tonnes/ year % Tonnes /year % Trading ships at sea 212 22.3 387 32.2 Trading ships in port 174 18.3 337 28.1 Small commercial vessels 2 .2 2 .2 Offshore production 310 32.7 217 18.1 Offshore drilling 209 22 209 17.4 Shore-based 42 4.5 48 4
  • 31.
  • 33.
  • 36.
    Craft Tracking GBR– ReefVTS Remainder - AMSA
  • 37.
  • 38.
  • 40.
  • 41.
    Inspections For BulkCarriers =100 * EXP(-4 + ship age + time since previous inspection + (0.587 * coefficient if new) + (0.4536 * LN(1 + number of deficiencies at previous inspection)) + (0.354 * 1, if not inspected previously) + (- 0.2212 * LN(Gross tonnage)) + Flag State coefficient) / (1 + EXP(-4 + ship age + time since previous inspection + (0.587 * coefficient if new) + (0.4536 * LN(1 + number of deficiencies at previous inspection)) + (0.354 * 1, if not inspected previously) + (-0.2212 * LN(Gross tonnage)) + Flag State coefficient)) For Other Ship Types =100 * EXP(-3.07 + ship age + time since previous inspection + (0.00958 * time since last special survey) + (0.086 * coefficient if new) + (0.326 * LN(1 + number of deficiencies at previous inspection)) + (0.444 * coefficient if not previously inspected) + (-0.2054 * LN(gross tonnage)) + ship type coefficient + Flag State coefficient + RO coefficient) / (1 + EXP(-3.07 + ship age + time since previous inspection + (0.00958 * time since last special survey) + (0.086 * coefficient if new) + (0.326 * LN(1 + number of deficiencies at previous inspection)) + (0.444 * coefficient if not previously inspected) + (-0.2054 * LN(gross tonnage)) + ship type coefficient + Flag State coefficient + RO coefficient)) LN indicates natural logarithms. EXP = exponential.
  • 43.
    Current AIS vessel tracks in Australia
  • 44.
  • 45.
  • 46.
  • 47.
  • 48.
    Ports in theNorth West
  • 49.
    Production & exploration leases off shore (2009) Petroleum – Exploration & Production leases
  • 50.
    Existing & Proposed Marine Parks Marine Parks – Existing & Proposed
  • 52.
    The Search forMalaysia Airlines MH370 AMSA Experience
  • 53.
  • 54.
    Flight Path derivedfrom RADAR data. Source: JIT/Google Earth, ATSB Report.
  • 56.
  • 57.
  • 58.
    Source: Satellite CommsWorking Group, ATSB Report.
  • 59.
    Example of onecomparison against actual flight MH021 7 March 2014 Red path = predicted path; Yellow track = actual aircraft track Source: Satellite Working Group, ATSB Report.
  • 60.
    Possible southern finalpositions S1-S3 based on MH370 max range and time Source: JIT/Google Earth, ATSB Report.
  • 61.
    Possible final positionsS4-S5 with 7th arc and max range cruise line Source: JIT/Google Earth, ATSB Report.
  • 62.
    Information: Many Sources– some examples  Flight details - plan, fuel load, performance data  Emergency equipment - distress beacons, slide rafts, etc  B777 structural materials (what will float?)  Cargo Manifest (debris analysis)  Satellite imagery  Contrail analysis – satellite imagery  Weather and environmental – atmospheric and oceanographic  Underwater hydrophones  Logistics – search aircraft, vessels, personnel, equipment, shore-based support, communications
  • 63.
    Plot of hydrophoneacoustic event recorded Magenta cross = most probable location of source; yellow area = uncertainty region Most Probable Location Source: Curtin University, ATSB Report.
  • 64.
    Some of theSearch Challenges  Minimal data to calculate accurate splash point  No ELT detections  Last known position versus subsequent time flown to unknown location  Vast and changing search areas  Remote oceanic area, long distance offshore  Movement of search areas following JIT analysis – time to redeploy search assets.  Elapsed time – impact on oceanic drift and debris dispersal  Tropical Cyclone influence on drift calculations and search  Search aircraft – available endurance  Availability of detailed description of cargo from manifest  Information on B777 components likely to float.
  • 65.
    Some of theSearch Challenges  Time for ships to reach aircraft sightings  Availability of ship-borne helicopters to investigate sightings  Sea pollution  Poor weather and search conditions on a number of days  Elapsed time between satellite imagery analysis and tasking aircraft/ships to investigate possible objects  Multi-national civil/military coordination and communication  Sustainment of large logistical requirements  Media appetite. Social media useful.  Processing large amount of publicly submitted data online and crowd sourcing satellite imagery.
  • 66.
    Drift Planning WorkingGroup  Supplement standard JRCC drift planning.  Purpose – to ensure international best methodology and consensus drift modelling techniques applied to MH370 splash point area  Search area – floating debris  “Reverse” drift – from floating debris location backwards to estimated splash point.
  • 67.
    Drift Planning WorkingGroup  Maritime SAR and Oceanography experts:  AMSA  CSIRO – Marine and Atmospheric Research  Asia Pacific Applied Science Associates (APASA)  Australian Bureau of Meteorology  Global Earth Modelling Systems (GEMS)  US Coast Guard  Multiple datasets/models  SLDMBs
  • 68.
    • Zero Leewaymodel – confirms actual surface Total Water Movement • Provides sea water temperature – varied from 7 to 28oC • SLDMB – Self Locating Datum Marker buoy • MetOcean Product – GPS receiver and Iridium transmitter – average life 21 days • Can be deployed from aircraft or vessel
  • 69.
    SLDMBs • 33x SLDMB’s successfully deployed to validate drift modelling • Comparisons run against all three oceanic current data sets used for modelling
  • 71.
    Day 52 -Overall Drifted Probability Area
  • 72.
    Day 52 –Drifted Probability Area Comparison – East Coast Australia
  • 73.
    Day 52 –Drifted Probability Area Comparison - Europe
  • 74.
    Day 52 –Drifted Probability Area Comparison – North America
  • 75.
    Day 52 –Drifted Probability Area Comparison - China
  • 76.
    JACC – JointAgency Coordination Centre  Established 30th March.  Ensure the search being coordinated by AMSA and ATSB is reinforced by strong liaison with all relevant stakeholders, including families of passengers.  Staff seconded from relevant departments/agencies.  Originally located Perth. Moved to Canberra 9th May 2014.
  • 77.
    Search Phase Transition– 28th April 2014 • Search for floating debris suspended • Transition to intensified underwater search • Search led by ATSB • Overall investigation – Malaysian Government
  • 78.
    End of SearchPhase – 28th April 2014 • 42 day search. 345 flight sorties. 3177 total flight hours. • 4.7 million square km cumulative search area • Search aircraft: • Civil – Australia and NZ (10) • Military – Australia (5), USA (2), China (2), New Zealand (2), Japan (3), Malaysia (2), Republic of Korea (2) • Search vessels: • Civil – Merchant ships • Military – Australia, China, USA, UK, Malaysia
  • 81.
    Ocean Shield TPLsearch coverage 4-14 April 2014 Source: Phoenix International and ATSB Report.
  • 82.
    Next search phase  Led by ATSB.  Further work continued to refine analysis of both flight and satellite data by specialists from UK, USA and Australia.  Priority area determined approximately 60,000 km2  This area subject of surface search Day 21-26.  Bathymetry of ocean floor since mid-May. Contracted vessel and Chinese military vessel.  Tender for specialist company capable of deep-water search for MH370.  Intensified underwater search planned to commence August 2014. Expected to take 12 months.
  • 84.
    Comparison with AF447  1st June 2009  Air France Airbus A330, Flight AF447  Rio de Janeiro to Paris  228 persons on board  Crashed in remote area, Atlantic Ocean  Investigation - French BEA (Bureau d'Enquêtes et d'Analyses pour la sécurité de l'aviation civile)
  • 85.
    Comparison with AF447 AF447 MH370 Flight Planned Route Was on planned route when reported missing. Deviated significantly from planned route to take up unknown route. Last Known Position Was reporting by ACARS every 10 minutes. ACARS failure messages from AF447 were received by Air France including a Last Known Position (LKP). Was reporting by ACARS up till disappeared. No further data other than satellite pings via INMARSAT. Speed Known = Mach 0.82 derived from ACARS message information. Unknown.
  • 86.
    Comparison with AF447 AF447 MH370 Search Area Initial Search Area: 40NM (74KM) radius centred on Last Known Position (LKP) = 17,000 square KM. Initial Australian Search Area: 693,170 square KM = 40 times larger than AF447 initial search area. Cumulative Australian search area total 18MAR to 28APR (last day search for surface debris): Almost 4.7 million square KM. Search for Surface Debris 26 days. This was based on no further bodies or aircraft debris being found for the final 9 days of the search. - Aircraft search operations ceased. - Ship search operations ceased, except for French Navy vessels which remained conducting acoustic search for the ULBs. In Australian SRR = 42 days
  • 87.
    Comparison with AF447 AF447 MH370 First Floating Debris Found Day 5 about 70KM from LKP. NOTE – the BEA report states that this (distance) considerably complicated the search for the underwater wreckage. Nil associated with MH370. Floating Debris/Bodies Marine pollution contributed to confusion in the early days of the search. Air searches found lots of debris – it was difficult for air crews to distinguish between marine pollution and small debris that may have been from AF447. It was not until ships arrived in the area working with aircraft that debris was able to be identified properly. About 50 bodies were recovered by ships. Same experience with marine pollution. Datum Buoys deployed 9 33
  • 88.
    Comparison with AF447 AF447 MH370 “Drift Committee” An expert working group of experts in SAR drift, oceanography, meteorology, etc attempted to estimate the crash location through “reverse drift” calculations. Various positions were calculated by different agencies using different methods and models with up to a 100KM variance. Similar expert working group formed within AMSA’s RCC Australia. Nil surface debris located to allow “reverse drift” calculation. Satellite imagery No useful results. Images from civil and military satellites were used. Aircraft flown to investigate objects detected by satellite failed to identify debris from AF447. Similar experienced.
  • 89.
    Comparison with AF447 AF447 MH370 Wreckage Location 6.5NM (12KM) from LKP. Depth 3900 metres. Wreckage found 2APR11 (671 days after AF447 missing) following detection by AUVs of a concentration of SONAR returns. Wreckage spread over area of 10,000 square metres. Few large parts found. 2 further months spent recovering flight recorders and aircraft parts, mapping debris and recovering human remains. Unknown. Search area depth 3800 - 4800 metres.
  • 90.
    Comparison with AF447 AF447 MH370 Cost of SAR Operation Estimated 80 million Euro ($118 million AUD) TBA Cost of Undersea Operation Estimated 31 million Euro ($46 million AUD) TBA Total Cost of SAR and Undersea Operations Estimated 111 million Euro ($164 million AUD) TBA
  • 92.
    NATIONAL CONFERENCE & EXHIBITION 2014 Title of presentation Presented by Insert Name Insert Company Details Platinum Sponsor Silver Sponsor Bronze Sponsor Risk Manager of the Year Award Sponsor Conference and Exhibition Partners