A very common method is the Elliott Wave Principle. Back in 1939, observing natural patterns, R.N. Elliott noticed that all cyclical movements occur in some sort of waves, related to Fibonacci numbers.The most common pattern is the so-called “Five- wave pattern”. Three out of five waves (marked 1, 3, 5) follow the trend, while two others (2 and 4) are countertrend interruptions. These interruptions are apparently a requisite for the trend to occur. Typically, this five-wave rise is followed by a three-wave downward correction forming an eight-wave cycle. Interestingly this pattern has a so-called “fractal” structure, in other words, it repeats itself on different scales.
By following Elliott Wave, we can predict the next move of the market and, for instance, foresee the trend change. http://www.bitcoinprice.mobi/subscribe/
http://www.thechartist.com.au/membership-packages/chart-research.html
Elliot wave rules and guidelines to help us determine high-probability patter position of a market
TD Sequential Count is the famous Timing Technic of T.Demark.
This count is the way to know where price are trend , where price are decline and where price may reverse.
This is my TRT-POV on Module 9 - Elliott Waves and Cycles of Time. I tried to simplify the Elliott Wave Theory as best as I could so that newbies will be able to understand the theory and the principles behind it. I also covered the 3 Cardinal Rules in using the Elliott Wave Theory for trading decision making.
Elliott Waves Trading Strategies
Elliott wave analysis is useful in providing the most likely next direction, but often traders may be unsure exactly when to enter and exit based upon analysis.
If the market is predicted to move lower then obviously you would wait for prices to stop falling before buying, or for more aggressive traders they may sell short. If your wave count expects price to move upwards then obviously you would buy. Trying to trade against the main trend is extremely risky. The wave count should tell you what the main trend is.
Elliott Wave Theory was developed by R.N. Elliott and popularized by
Robert Prechter. This theory asserts that crowd behavior ebbs and flows
in clear trends. Based on this ebb and flow, Elliott identified a certain
structure to price movements in the financial markets. The article serves
as a basic introduction to Elliott Wave Theory. A basic 5-wave impulse
sequence and 3-wave corrective sequence are explained. While Elliott
Wave Theory gets much more complicated than this 5-3 combination,
this article will only focus on the very basics.
As the name suggests, FOREX Autopilot is a software application that does FOREX trading in an automated manner.
The program has automated trading bots in a software format, which you install on your computer. You have to do nothing more than this installation but to keep your PC on. You will find that these trading bots will handle all the FOREX transactions for you all through the night and in the morning, you see that you have a swollen account!
Naturally, there is much criticism whether such a thing really works but FOREX Autopilot is genuine software released by Marcus Leary, a FOREX expert who also has innate Internet marketing knowledge.
The Elliott Wave theory is based on how groups of people behave. Mass psychology with swings from pessimism to optimism and back is described as the basis for the patterns the Elliott wave is suppose to identify.
Click here for more information on range trading
http://www.netpicks.com/simple-range-trading-strategy/
Here is some information on range trading:
It’s been said that a market only trends 30% of the time.
I can’t quantify that figure but having a range trading strategy to take advantage of the other 70% is good business.
Range trading is not difficult however it does require discipline and a method of determining when a trading range is in play.
For more information on range trading click here:
http://www.netpicks.com/simple-range-trading-strategy/
"Si quieres generar ingresos de manera astuta sin tener que trabajar todos los días y seguir con tu vida normal no ingreses acá!
Pero si quieres cambiar y ser diferentes a los demás ingresa a este archivo y aprende técnicas básicas de trading! Y gana en tan solo un mes miles de dólares.
Ojo el documento fue pagado un costo de 30$ pero mi gente les dejo el totalmente gratis🥰🥰🥰🥰🥰🤑🤑🤑🤑🤑, muy aparte de esto por ingresar a mi link generas 0,20 $ cada vez que ingreses en la que tu puedes crear tu cuenta y compartir y seguir publicando en diferentes lugares de la red para generar ingresos adicionales. Es fantástico verdad😎😎😎😎
👇👇👇👇👇👇
https://bit.ly/3QJXv2d
forex trading strategy that you can make money with. Can also be use by using your android and iphone metatrader.
The settings on the indicator are easy to setup. The strategy best time frame is h4 and hourly chart.
http://www.pipsumo.com/2017/04/parabolic-sar-trading-strategy.html
With a Prediction every month, Short-Term Updates Weeky and Price Alerts when market conditions warrant it, you’re constantly kept up-to-date history BTCUSD price chart of the day to Trade bitcoin. You’ll receive Signals when to buy, when to sell and when to hold on tight. Read more: http://www.bitcoinprice.mobi/prediction/
Elliot Wave Labeling — Used to forecast market trends by identifying extremes in investor psychology, highs and lows in prices and other collective cyclical factors. Get Study and wave counts Short-Term Updates http://www.bitcoinprice.mobi/subscribe/
Spectra-Physics is a brand within the MKS Instruments Light & Motion division. The Spectra-Physics product portfolio consists of a broad spectrum of lasers for precision industrial and scientific research applications. Spectra-Physics products combine groundbreaking laser technologies with deep applications expertise to deliver disruptive performance and lower total cost of ownership. From the manufacturing floor and semiconductor fab to the research laboratory, Spectra-Physics lasers enhance our customers’ capabilities and productivity in the semiconductor, industrial technologies, life and health sciences, and research markets.
Wavelets are mathematical functions. The wavelet transform is a tool that cuts up data, functions or operators into different frequency components and then studies each component with a resolution matched to its scale. It is needed, because analyzing discontinuities and sharp spikes of the signal and applications as image compression, human vision, radar, and earthquake prediction. Wai Mar Lwin | Thinn Aung | Khaing Khaing Wai "Applications of Wavelet Transform" Published in International Journal of Trend in Scientific Research and Development (ijtsrd), ISSN: 2456-6470, Volume-3 | Issue-5 , August 2019, URL: https://www.ijtsrd.com/papers/ijtsrd27958.pdfPaper URL: https://www.ijtsrd.com/mathemetics/applied-mathematics/27958/applications-of-wavelet-transform/wai-mar-lwin
Development of Seakeeping Test and Data Processing Systemijceronline
International Journal of Computational Engineering Research (IJCER) is dedicated to protecting personal information and will make every reasonable effort to handle collected information appropriately. All information collected, as well as related requests, will be handled as carefully and efficiently as possible in accordance with IJCER standards for integrity and objectivity.
How to get verified on Coinbase Account?_.docxBuy bitget
t's important to note that buying verified Coinbase accounts is not recommended and may violate Coinbase's terms of service. Instead of searching to "buy verified Coinbase accounts," follow the proper steps to verify your own account to ensure compliance and security.
how to swap pi coins to foreign currency withdrawable.DOT TECH
As of my last update, Pi is still in the testing phase and is not tradable on any exchanges.
However, Pi Network has announced plans to launch its Testnet and Mainnet in the future, which may include listing Pi on exchanges.
The current method for selling pi coins involves exchanging them with a pi vendor who purchases pi coins for investment reasons.
If you want to sell your pi coins, reach out to a pi vendor and sell them to anyone looking to sell pi coins from any country around the globe.
Below is the contact information for my personal pi vendor.
Telegram: @Pi_vendor_247
Financial Assets: Debit vs Equity Securities.pptxWrito-Finance
financial assets represent claim for future benefit or cash. Financial assets are formed by establishing contracts between participants. These financial assets are used for collection of huge amounts of money for business purposes.
Two major Types: Debt Securities and Equity Securities.
Debt Securities are Also known as fixed-income securities or instruments. The type of assets is formed by establishing contracts between investor and issuer of the asset.
• The first type of Debit securities is BONDS. Bonds are issued by corporations and government (both local and national government).
• The second important type of Debit security is NOTES. Apart from similarities associated with notes and bonds, notes have shorter term maturity.
• The 3rd important type of Debit security is TRESURY BILLS. These securities have short-term ranging from three months, six months, and one year. Issuer of such securities are governments.
• Above discussed debit securities are mostly issued by governments and corporations. CERTIFICATE OF DEPOSITS CDs are issued by Banks and Financial Institutions. Risk factor associated with CDs gets reduced when issued by reputable institutions or Banks.
Following are the risk attached with debt securities: Credit risk, interest rate risk and currency risk
There are no fixed maturity dates in such securities, and asset’s value is determined by company’s performance. There are two major types of equity securities: common stock and preferred stock.
Common Stock: These are simple equity securities and bear no complexities which the preferred stock bears. Holders of such securities or instrument have the voting rights when it comes to select the company’s board of director or the business decisions to be made.
Preferred Stock: Preferred stocks are sometime referred to as hybrid securities, because it contains elements of both debit security and equity security. Preferred stock confers ownership rights to security holder that is why it is equity instrument
<a href="https://www.writofinance.com/equity-securities-features-types-risk/" >Equity securities </a> as a whole is used for capital funding for companies. Companies have multiple expenses to cover. Potential growth of company is required in competitive market. So, these securities are used for capital generation, and then uses it for company’s growth.
Concluding remarks
Both are employed in business. Businesses are often established through debit securities, then what is the need for equity securities. Companies have to cover multiple expenses and expansion of business. They can also use equity instruments for repayment of debits. So, there are multiple uses for securities. As an investor, you need tools for analysis. Investment decisions are made by carefully analyzing the market. For better analysis of the stock market, investors often employ financial analysis of companies.
The secret way to sell pi coins effortlessly.DOT TECH
Well as we all know pi isn't launched yet. But you can still sell your pi coins effortlessly because some whales in China are interested in holding massive pi coins. And they are willing to pay good money for it. If you are interested in selling I will leave a contact for you. Just telegram this number below. I sold about 3000 pi coins to him and he paid me immediately.
Telegram: @Pi_vendor_247
Empowering the Unbanked: The Vital Role of NBFCs in Promoting Financial Inclu...Vighnesh Shashtri
In India, financial inclusion remains a critical challenge, with a significant portion of the population still unbanked. Non-Banking Financial Companies (NBFCs) have emerged as key players in bridging this gap by providing financial services to those often overlooked by traditional banking institutions. This article delves into how NBFCs are fostering financial inclusion and empowering the unbanked.
how to sell pi coins effectively (from 50 - 100k pi)DOT TECH
Anywhere in the world, including Africa, America, and Europe, you can sell Pi Network Coins online and receive cash through online payment options.
Pi has not yet been launched on any exchange because we are currently using the confined Mainnet. The planned launch date for Pi is June 28, 2026.
Reselling to investors who want to hold until the mainnet launch in 2026 is currently the sole way to sell.
Consequently, right now. All you need to do is select the right pi network provider.
Who is a pi merchant?
An individual who buys coins from miners on the pi network and resells them to investors hoping to hang onto them until the mainnet is launched is known as a pi merchant.
debuts.
I'll provide you the Telegram username
@Pi_vendor_247
If you are looking for a pi coin investor. Then look no further because I have the right one he is a pi vendor (he buy and resell to whales in China). I met him on a crypto conference and ever since I and my friends have sold more than 10k pi coins to him And he bought all and still want more. I will drop his telegram handle below just send him a message.
@Pi_vendor_247
Exploring Abhay Bhutada’s Views After Poonawalla Fincorp’s Collaboration With...beulahfernandes8
The financial landscape in India has witnessed a significant development with the recent collaboration between Poonawalla Fincorp and IndusInd Bank.
The launch of the co-branded credit card, the IndusInd Bank Poonawalla Fincorp eLITE RuPay Platinum Credit Card, marks a major milestone for both entities.
This strategic move aims to redefine and elevate the banking experience for customers.
what is the future of Pi Network currency.DOT TECH
The future of the Pi cryptocurrency is uncertain, and its success will depend on several factors. Pi is a relatively new cryptocurrency that aims to be user-friendly and accessible to a wide audience. Here are a few key considerations for its future:
Message: @Pi_vendor_247 on telegram if u want to sell PI COINS.
1. Mainnet Launch: As of my last knowledge update in January 2022, Pi was still in the testnet phase. Its success will depend on a successful transition to a mainnet, where actual transactions can take place.
2. User Adoption: Pi's success will be closely tied to user adoption. The more users who join the network and actively participate, the stronger the ecosystem can become.
3. Utility and Use Cases: For a cryptocurrency to thrive, it must offer utility and practical use cases. The Pi team has talked about various applications, including peer-to-peer transactions, smart contracts, and more. The development and implementation of these features will be essential.
4. Regulatory Environment: The regulatory environment for cryptocurrencies is evolving globally. How Pi navigates and complies with regulations in various jurisdictions will significantly impact its future.
5. Technology Development: The Pi network must continue to develop and improve its technology, security, and scalability to compete with established cryptocurrencies.
6. Community Engagement: The Pi community plays a critical role in its future. Engaged users can help build trust and grow the network.
7. Monetization and Sustainability: The Pi team's monetization strategy, such as fees, partnerships, or other revenue sources, will affect its long-term sustainability.
It's essential to approach Pi or any new cryptocurrency with caution and conduct due diligence. Cryptocurrency investments involve risks, and potential rewards can be uncertain. The success and future of Pi will depend on the collective efforts of its team, community, and the broader cryptocurrency market dynamics. It's advisable to stay updated on Pi's development and follow any updates from the official Pi Network website or announcements from the team.
what is the best method to sell pi coins in 2024DOT TECH
The best way to sell your pi coins safely is trading with an exchange..but since pi is not launched in any exchange, and second option is through a VERIFIED pi merchant.
Who is a pi merchant?
A pi merchant is someone who buys pi coins from miners and pioneers and resell them to Investors looking forward to hold massive amounts before mainnet launch in 2026.
I will leave the telegram contact of my personal pi merchant to trade pi coins with.
@Pi_vendor_247
BYD SWOT Analysis and In-Depth Insights 2024.pptxmikemetalprod
Indepth analysis of the BYD 2024
BYD (Build Your Dreams) is a Chinese automaker and battery manufacturer that has snowballed over the past two decades to become a significant player in electric vehicles and global clean energy technology.
This SWOT analysis examines BYD's strengths, weaknesses, opportunities, and threats as it competes in the fast-changing automotive and energy storage industries.
Founded in 1995 and headquartered in Shenzhen, BYD started as a battery company before expanding into automobiles in the early 2000s.
Initially manufacturing gasoline-powered vehicles, BYD focused on plug-in hybrid and fully electric vehicles, leveraging its expertise in battery technology.
Today, BYD is the world’s largest electric vehicle manufacturer, delivering over 1.2 million electric cars globally. The company also produces electric buses, trucks, forklifts, and rail transit.
On the energy side, BYD is a major supplier of rechargeable batteries for cell phones, laptops, electric vehicles, and energy storage systems.
1. Chapter 10 Wave Ratios and Measurements
10~ 179
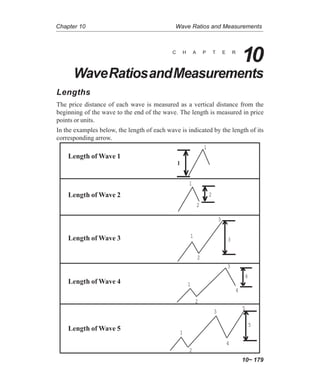
Lengths
The price distance of each wave is measured as a vertical distance from the
beginning of the wave to the end of the wave. The length is measured in price
points or units.
In the examples below, the length of each wave is indicated by the length of its
corresponding arrow.
C H A P T E R
WaveRatiosandMeasurements
10
Length of Wave 2
2
1
2
2
Length of Wave 3
Length of Wave 4
1
1
Length of Wave 1
2
Length of Wave 5
1
3
4
5
1
3
3
2
1
3
4
4
5
2. eSignal, Part 2 Applying Technical Analysis
10~ 180
Fibonacci Ratios of Waves
Fibonacci Ratio Background
Fibonacci ratios are mathematical ratios derived from the Fibonacci sequence.
The Fibonacci sequence is the work of Leonardo Fibonacci, circa 1180 CE. The
Fibonacci sequence is used in many applications, including engineering, space
studies, stock market actions, and many other fields. This is all the information
one needs as to the origin of the Fibonacci ratios, at least for trading purposes.
The most common Fibonacci ratios used in the stock markets are:
1 - 1.618 - 2.618 - 4.23 - 6.85 (multiples)
0.14 - 0.25 - 0.38 - 0.5 & 0.618 (ratios)
The ratios used in this manual slightly deviate from the standard Fibonacci ratios
listed below. These deviated ratios best fit the short-term wave pattern.
The first wave in an Elliott sequence is Wave 1. The measurement of Wave 1 is
used to find ratios of other waves. These ratios are not rules, but guidelines in
estimating the lengths of different waves.
Ratios for Wave 2
Fibonacci Rule for Wave 2:
Wave 2 is always related to Wave 1.
Common Ratios for Wave 2:
Wave 2 = either 50% of Wave 1
or 62% of Wave 1
of Wave 1
1
LengthofWaveOne
}
50%
2
62%
3. Chapter 10 Wave Ratios and Measurements
10~ 181
Ratios for Wave 3
Wave 3 is related to Wave 1 by one of the following:
Wave 3 = either 1.62 x length of Wave 1
or 2.62 x length of Wave 1
or 4.25 x length of Wave 1
The most common multiples are 1.62 and 2.62. However, if the 3rd
Wave is an
extended wave, then 2.62 and 4.25 ratios are more common.
Ratios for Wave 4
Wave 4 is related to Wave 3 by one of the following:
Wave 4 = either 24% of Wave 3
or 38% of Wave 3
or 50% of Wave 3
The 24% and 38% are the most common ratios for Wave 4.
Times
Length
ofWave 1
1
2
3
3
4.25
2.62
3
1.62
Lengthof
WaveOne
1
3
LengthofWave3
4
4
24%
38%
Times
Length
of Wave 3
2
4. eSignal, Part 2 Applying Technical Analysis
10~ 182
Ratios for Wave 5
Wave 5 has two different relationships. Both are shown below.
If Wave 3 is greater than 1.62 or extended, then Wave 5 ratios are as
follows:
Wave 5 either = Wave 1 or
= 1.62 x Wave 1 or
= 2.62 x Wave 1
If Wave 3 is less than 1.62, Wave 5 ratios are as follows:
When Wave 3 is less than 1.62, the 5th
Wave overextends itself. From research,
the ratio of Wave 5 will be based on the entire length from the beginning of Wave
1 to the top of Wave 3.
Extended Wave 5 = either 0.62 x length
(beginning of Wave 1 to top of Wave 3) or
= length of
(beginning of Wave 1 to top of Wave 3) or
= 1.62 x length of
(beginning of Wave 1 to top of Wave 3)
3
4
5
1
5 based on length of 1
1 2
1
2
3
4
5
5 based on length of 1 3
1
3
5. Chapter 10 Wave Ratios and Measurements
10~ 183
Elliott Channels for Top of a Wave 5
Once the 5th
Wave starts, the Elliott Channel Technique can be used to project
the end of the 5th
Wave. Once Wave 4 has been completed, draw a straight line
between Waves 2 and 4.
Now draw two lines parallel to the lower channel line connecting the tops of
Waves 1and 3.
Expect Wave 5 to end on one of the two upper channel lines. Usually, if Wave 3
was a normal wave, Wave 5 tends to end on the channel drawn from the Wave
3 top. If Wave 3 was extended and a runaway type of wave, Wave 5 tends to
end on the channel drawn from the top of Wave 1.
Lower
Channel Line
1
2
3
4
Lower
Channel Line
5
5
1
2
3
4
Wave1Upper
Channel Line
6. eSignal, Part 2 Applying Technical Analysis
10~ 184
Statistical Analysis of Wave 2 Ratios
73% Retraced between
50% and 60%
Only 12% held within a
38% retracement
of Wave One
38%
1
2
15% Retraced below
the 62% level
62%
2
1
50%
62%
2
1
7. Chapter 10 Wave Ratios and Measurements
10~ 185
Wave 2 Ratio
Figure 10-1: Daily Chart,Alcoa
In the Alcoa Inc. (AA) chart above, Wave 2 retraced between 50% and 62% of
Wave 1.
8. eSignal, Part 2 Applying Technical Analysis
10~ 186
Statistical Analysis of Wave 3 Ratios
Less than 3 = 1
only 2% of the time
3
1
2
3
1
2
1.75 X 1
1.6 X 1
45% of the time}
2.62 X 1
1.75 X 1
1
2
3
30% of
the time}
15% of the
time
1.60 X 1
1 X 1 }
3
1
2
2.62 X 1
1
2
Greater than 2.62 X 1
8% of the time
3
9. Chapter 10 Wave Ratios and Measurements
10~ 187
Wave 3 Ratios
Figure 10-2: Daily Chart,Alcoa
In the Alcoa Inc. (AA) chart above, Wave 3 wound up between 1.618 and 2.618
of Wave 1.
10. eSignal, Part 2 Applying Technical Analysis
10~ 188
Statistical Analysis of Wave 4 Ratios
More than 62% Retracement of Wave 3 = 10% of the time
Retrace 24-30% of Wave 3
only 15% of the time
50%
30%
}Retrace between 30-50% of
Wave 3 60% of the time
50%
62%
} Retrace between 50-62% of
Wave 3 15% of the time
3
1
1
2
2
2
3
1
3
24%
30% }
11. Chapter 10 Wave Ratios and Measurements
10~ 189
Wave 4 Ratios
Figure 10-3: Daily Chart,Alcoa
In the Alcoa Inc. (AA) chart above, Wave 4 retraced between 24% and 38% of
Wave 3.
12. eSignal, Part 2 Applying Technical Analysis
10~ 190
Elliott / Fibonacci Ratios
Wave 5
Extended if Wave 3 is less than 1.62 X Wave One
5 = .62 X Length of 0 to 3
5 = 1 X Length of 0 to 3
5 = 1.62 X Length of 0 to 3
3
0
1
2
3
4
28000
28200
28100
28400
28300
1
2
3
4
5
?
13. Chapter 10 Wave Ratios and Measurements
10~ 191
Elliott / Fibonacci Ratios for Wave 5
Even when Wave 3 is extended, our research has found that the Wave 5 sequence
will often end inside the ratios calculated from 0–3 where 0 (Zero) is the start of
Wave 1. This is the start of the new Five-Wave sequence. The length of 0–3 is
extended from the end of Wave 4.
Wave 5 usually ends inside the windows of 62% of 0–3 and equal to 0–3 added
to the end of Wave 4.
Figure 10-4: Daily Chart,Alcoa
14. eSignal, Part 2 Applying Technical Analysis
10~ 192
NotesNotes