Downloaded 270 times


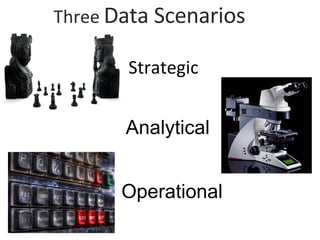

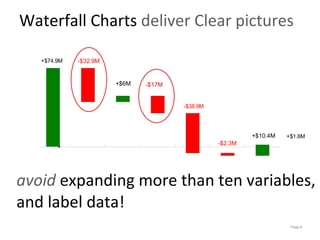

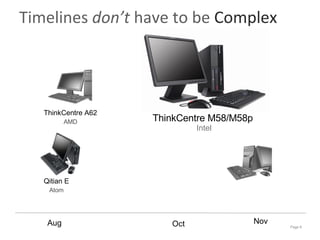


The document discusses effective strategies for communicating data through visualizations. It identifies three common data scenarios - strategic, analytical, and operational - and provides examples of visualizations that work best for each scenario. Key recommendations include keeping visualizations simple, using labels and context to ensure understandability, and designing for the limitations of human memory and cognition.