
![InfoVis interaction experience Interface manipulation activities Sense-making activities Insight, positive experience [in uninterrupted harmony]](https://image.slidesharecdn.com/uxcampeurope10infovisjansrutek-100531133958-phpapp01/75/Information-Visualization-not-just-eye-candy-22-2048.jpg)

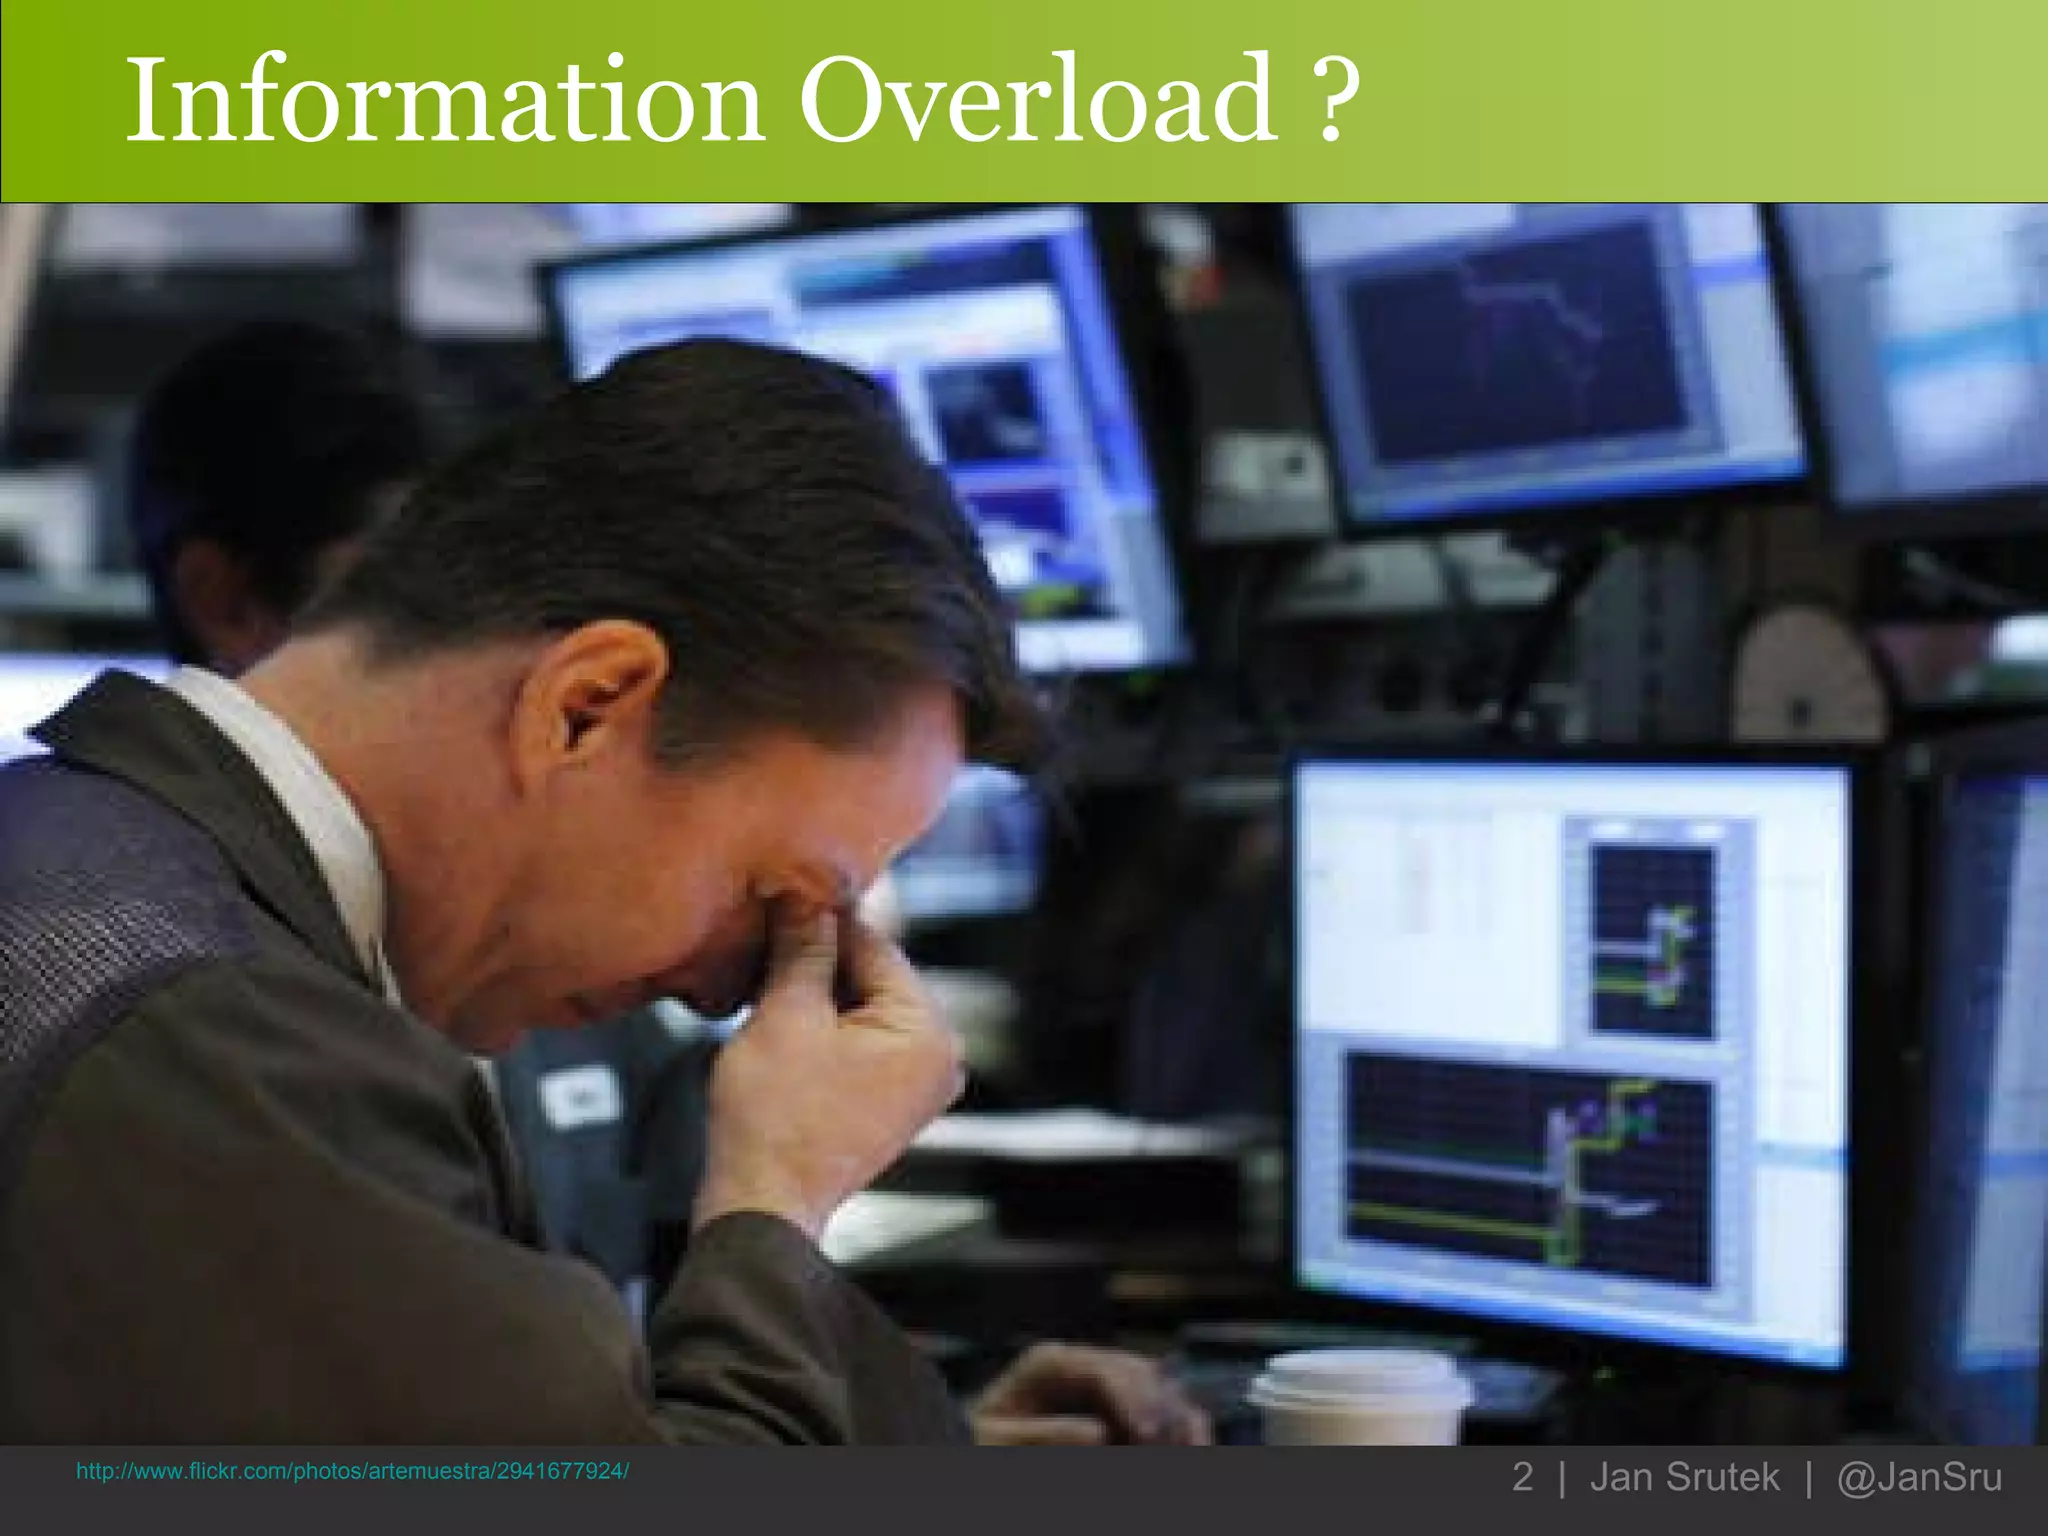
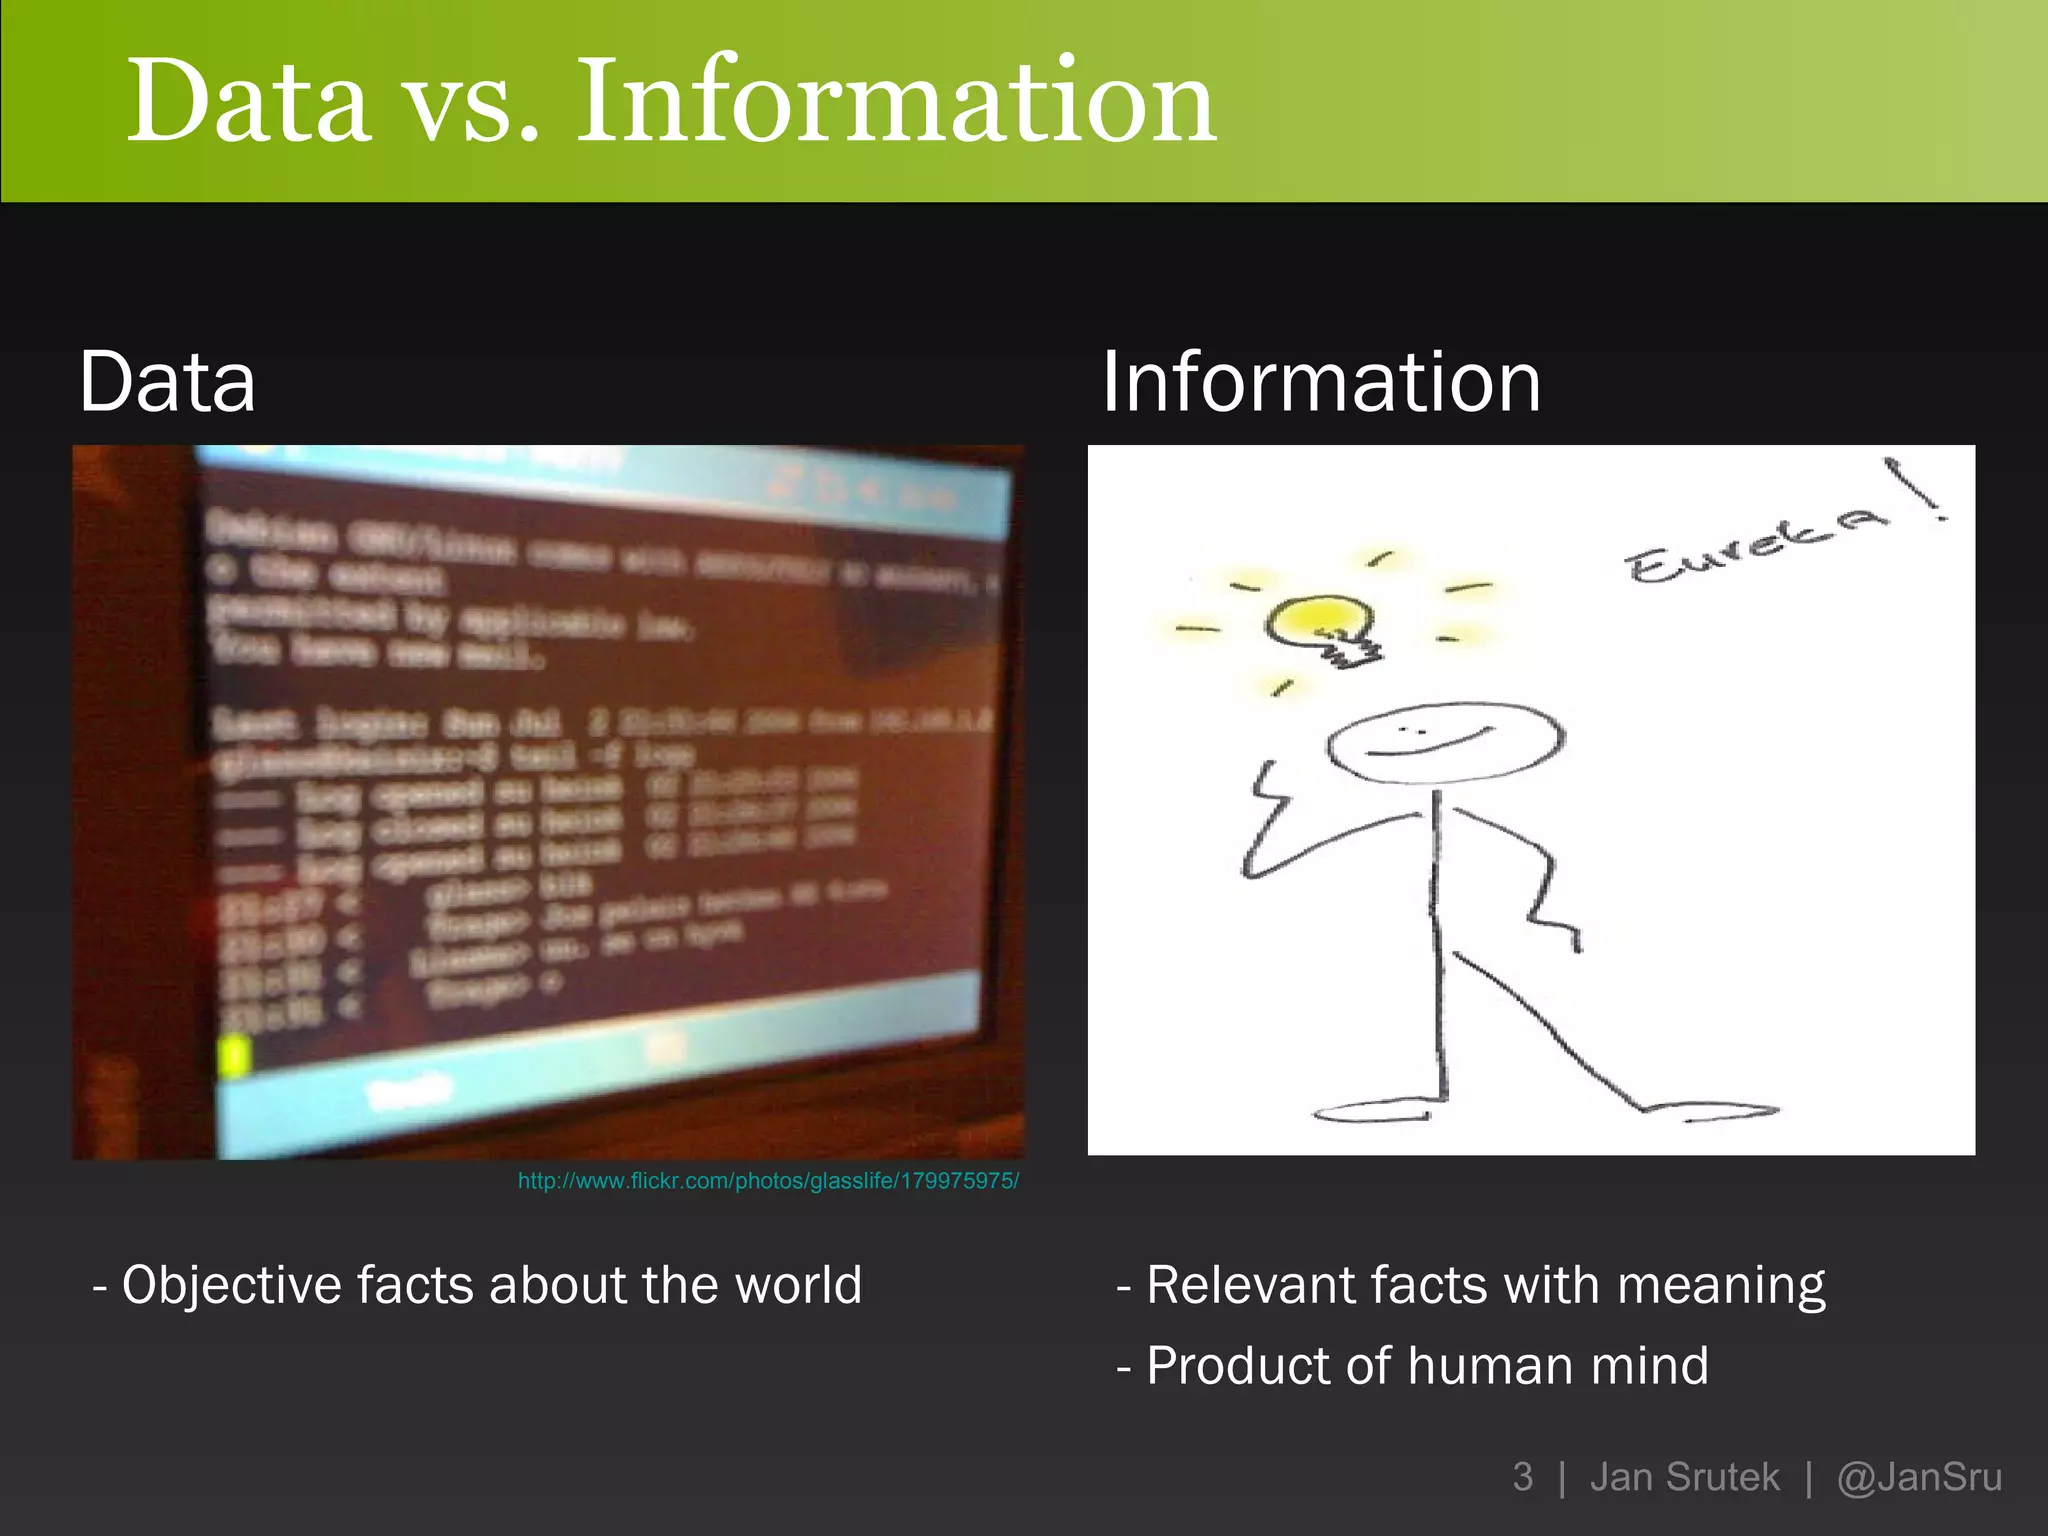
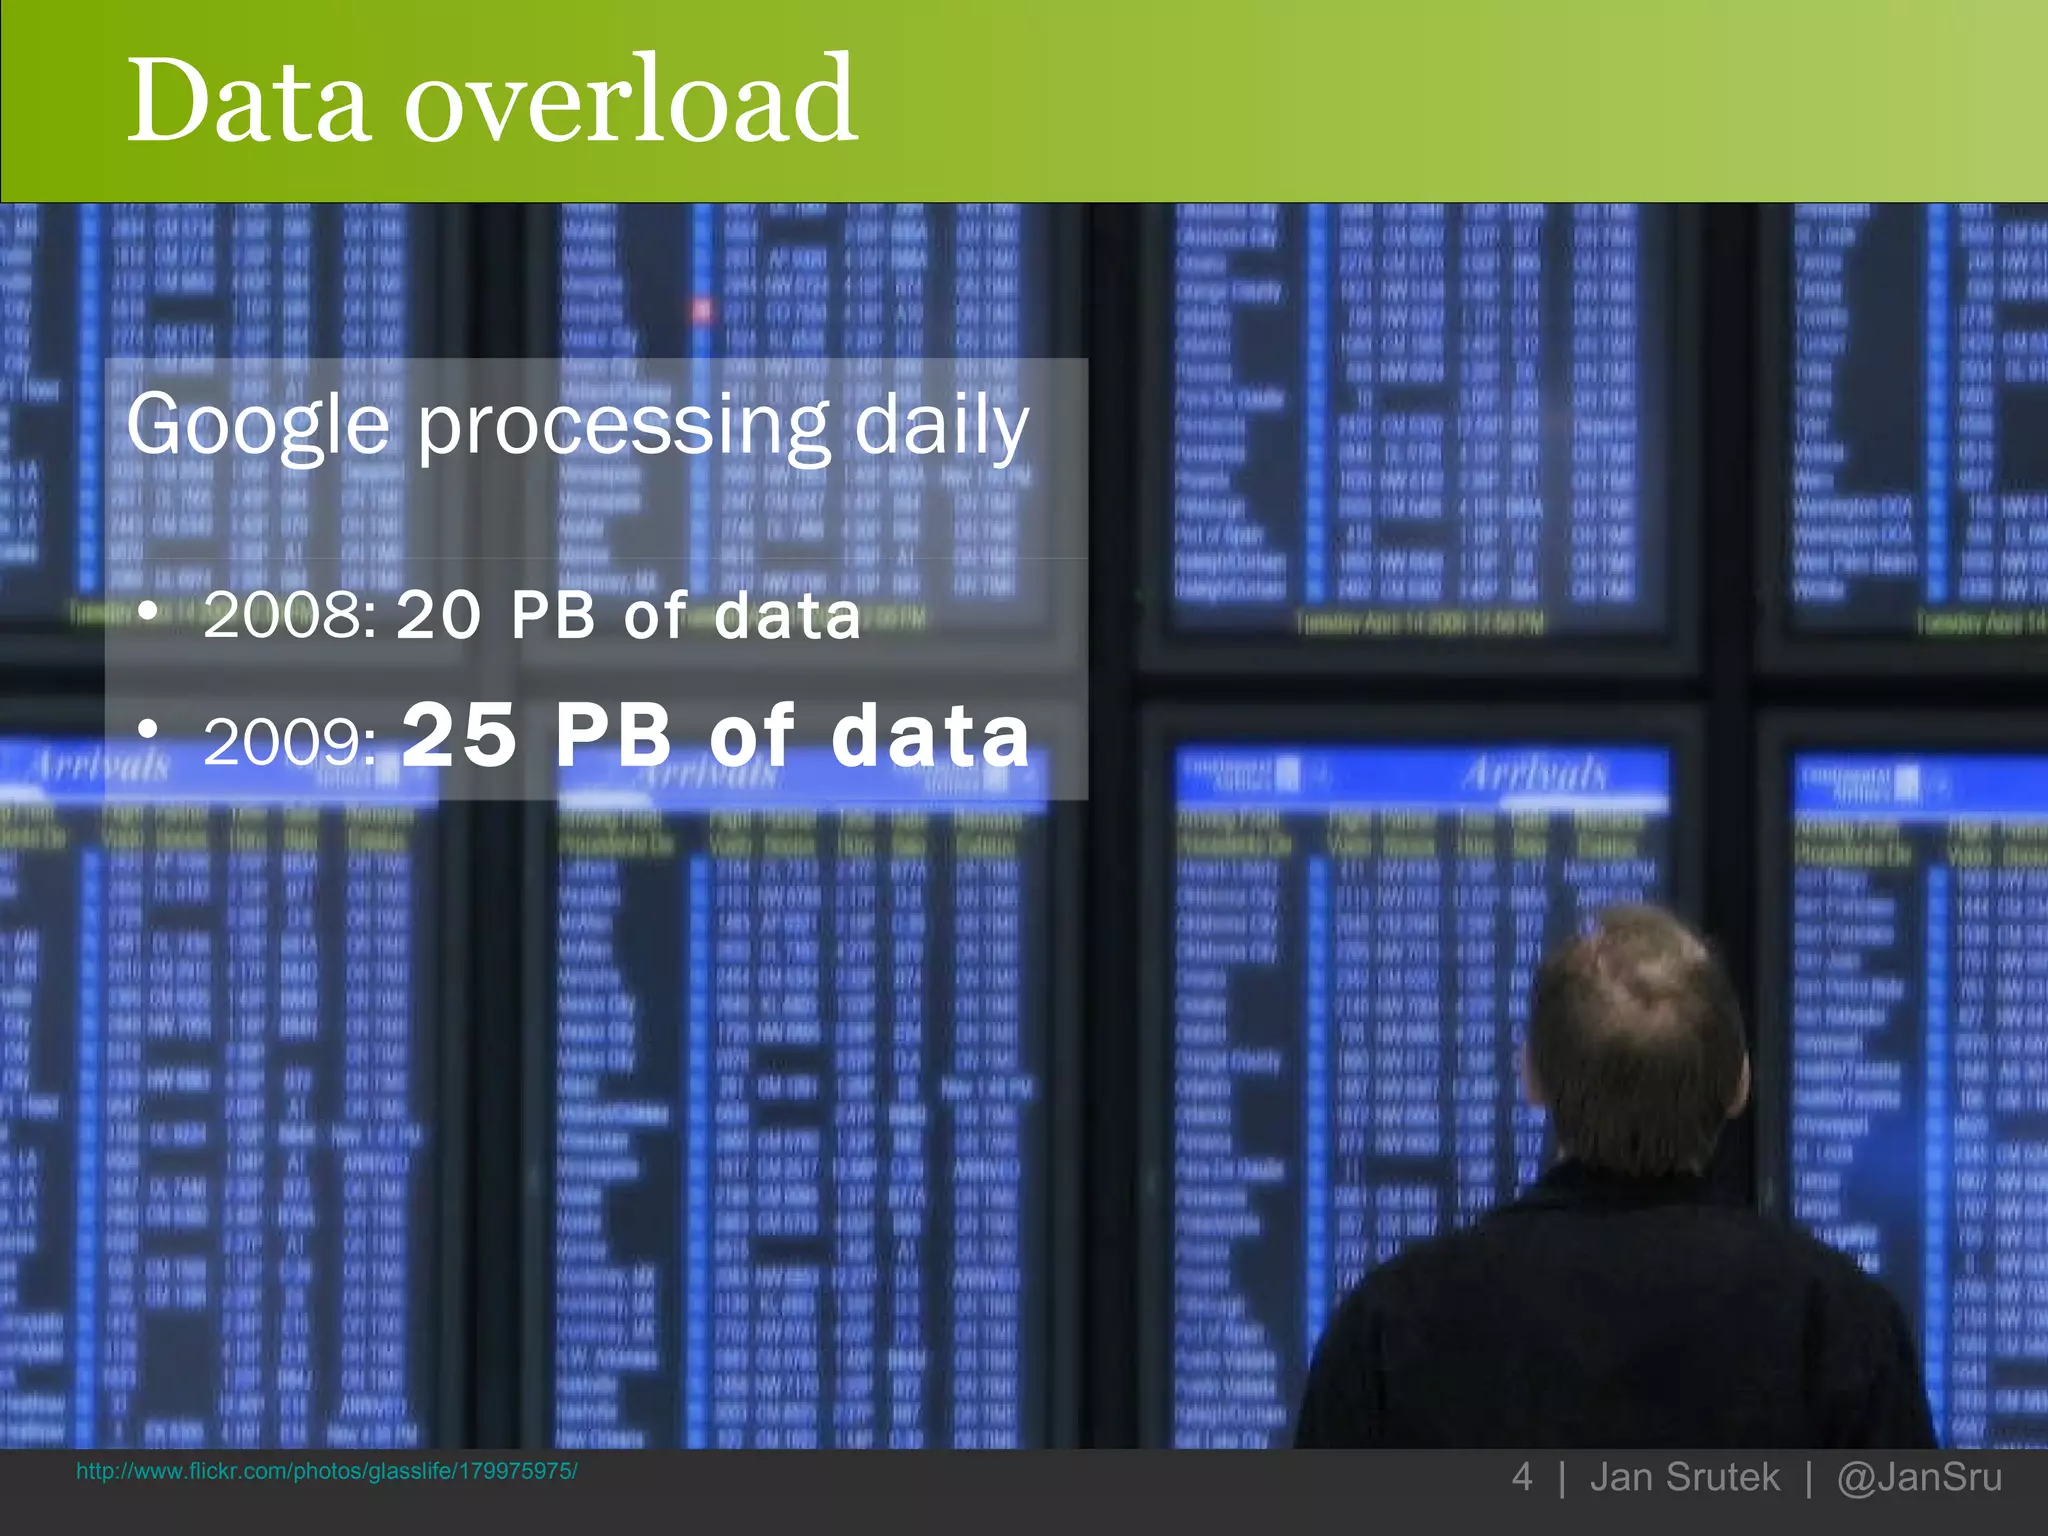
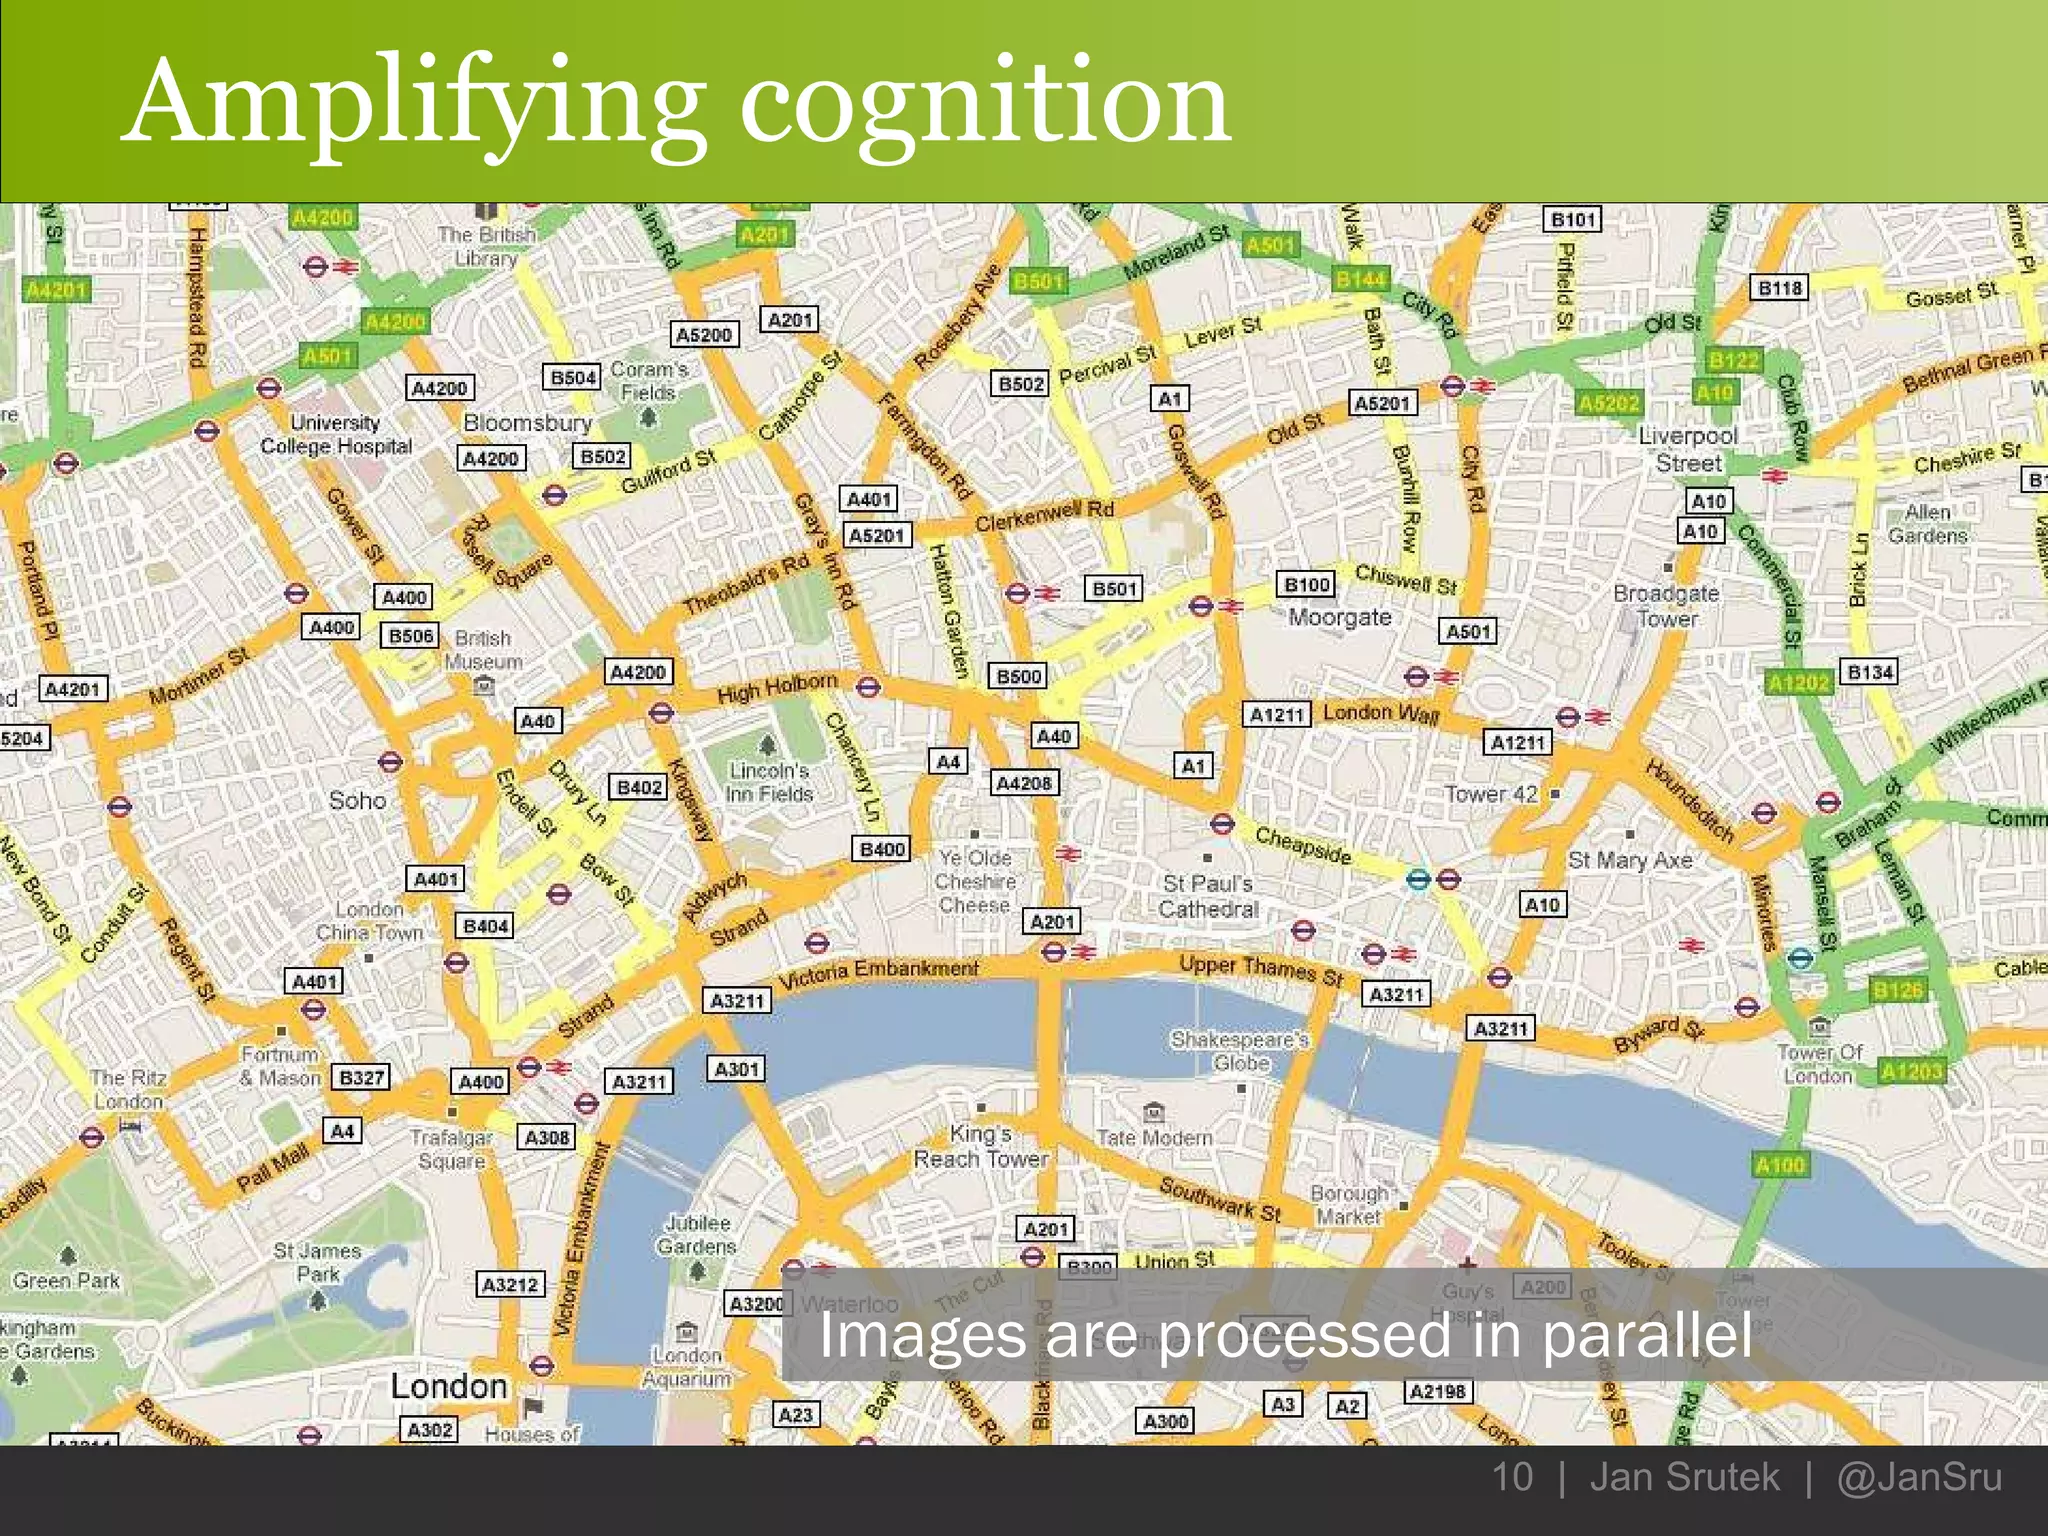
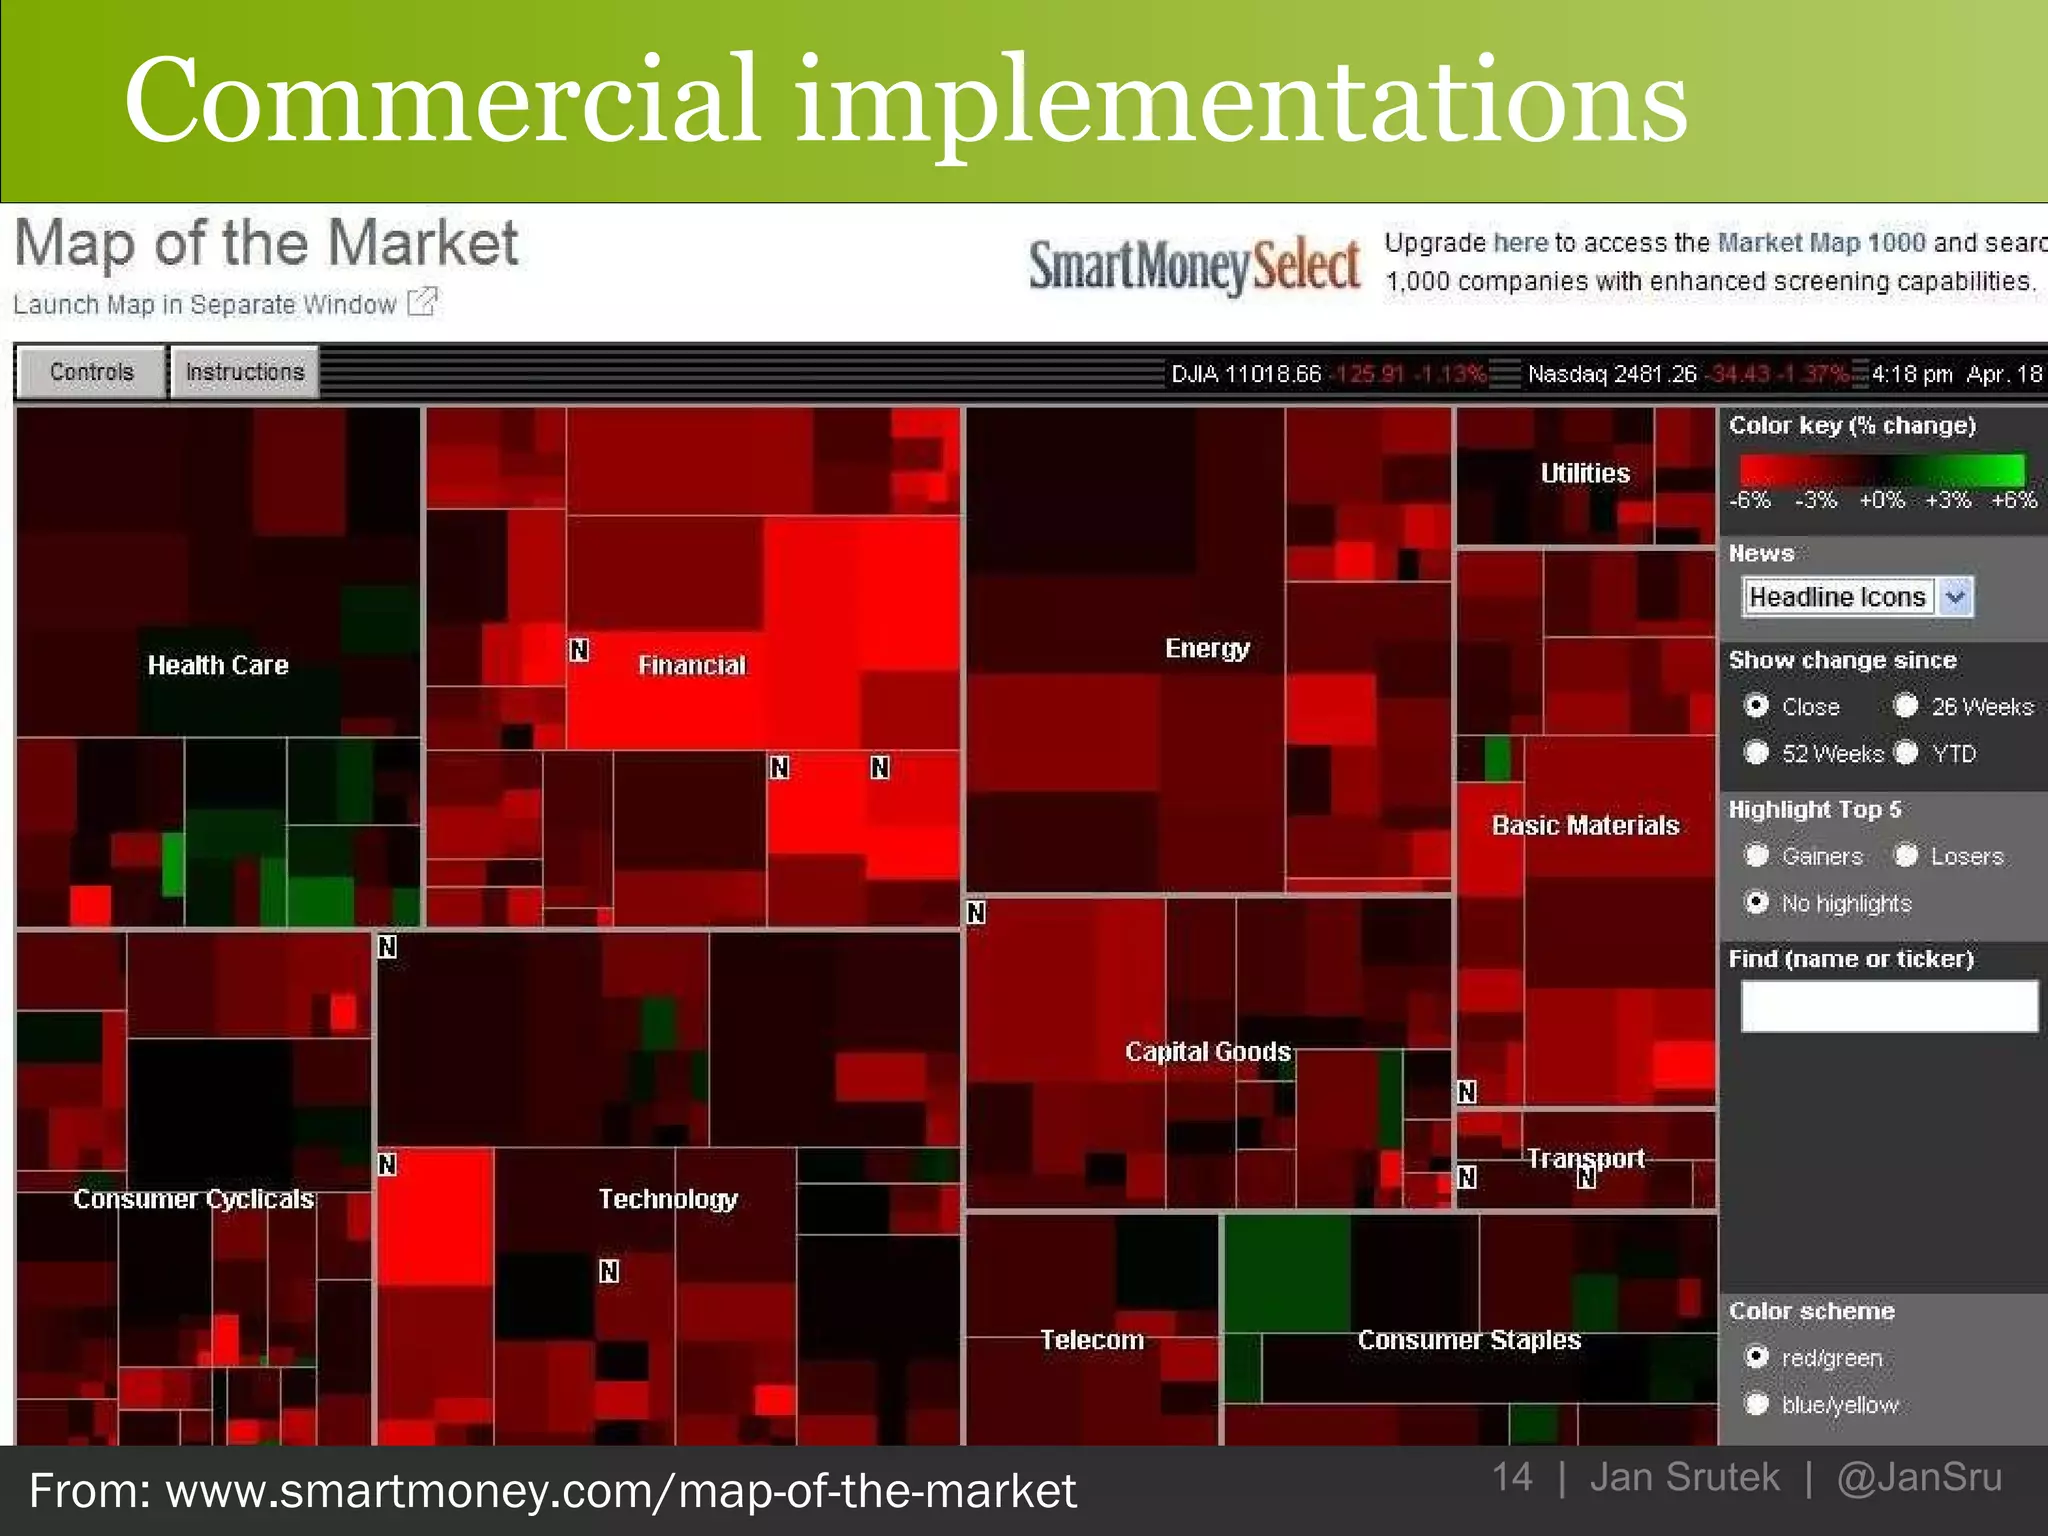
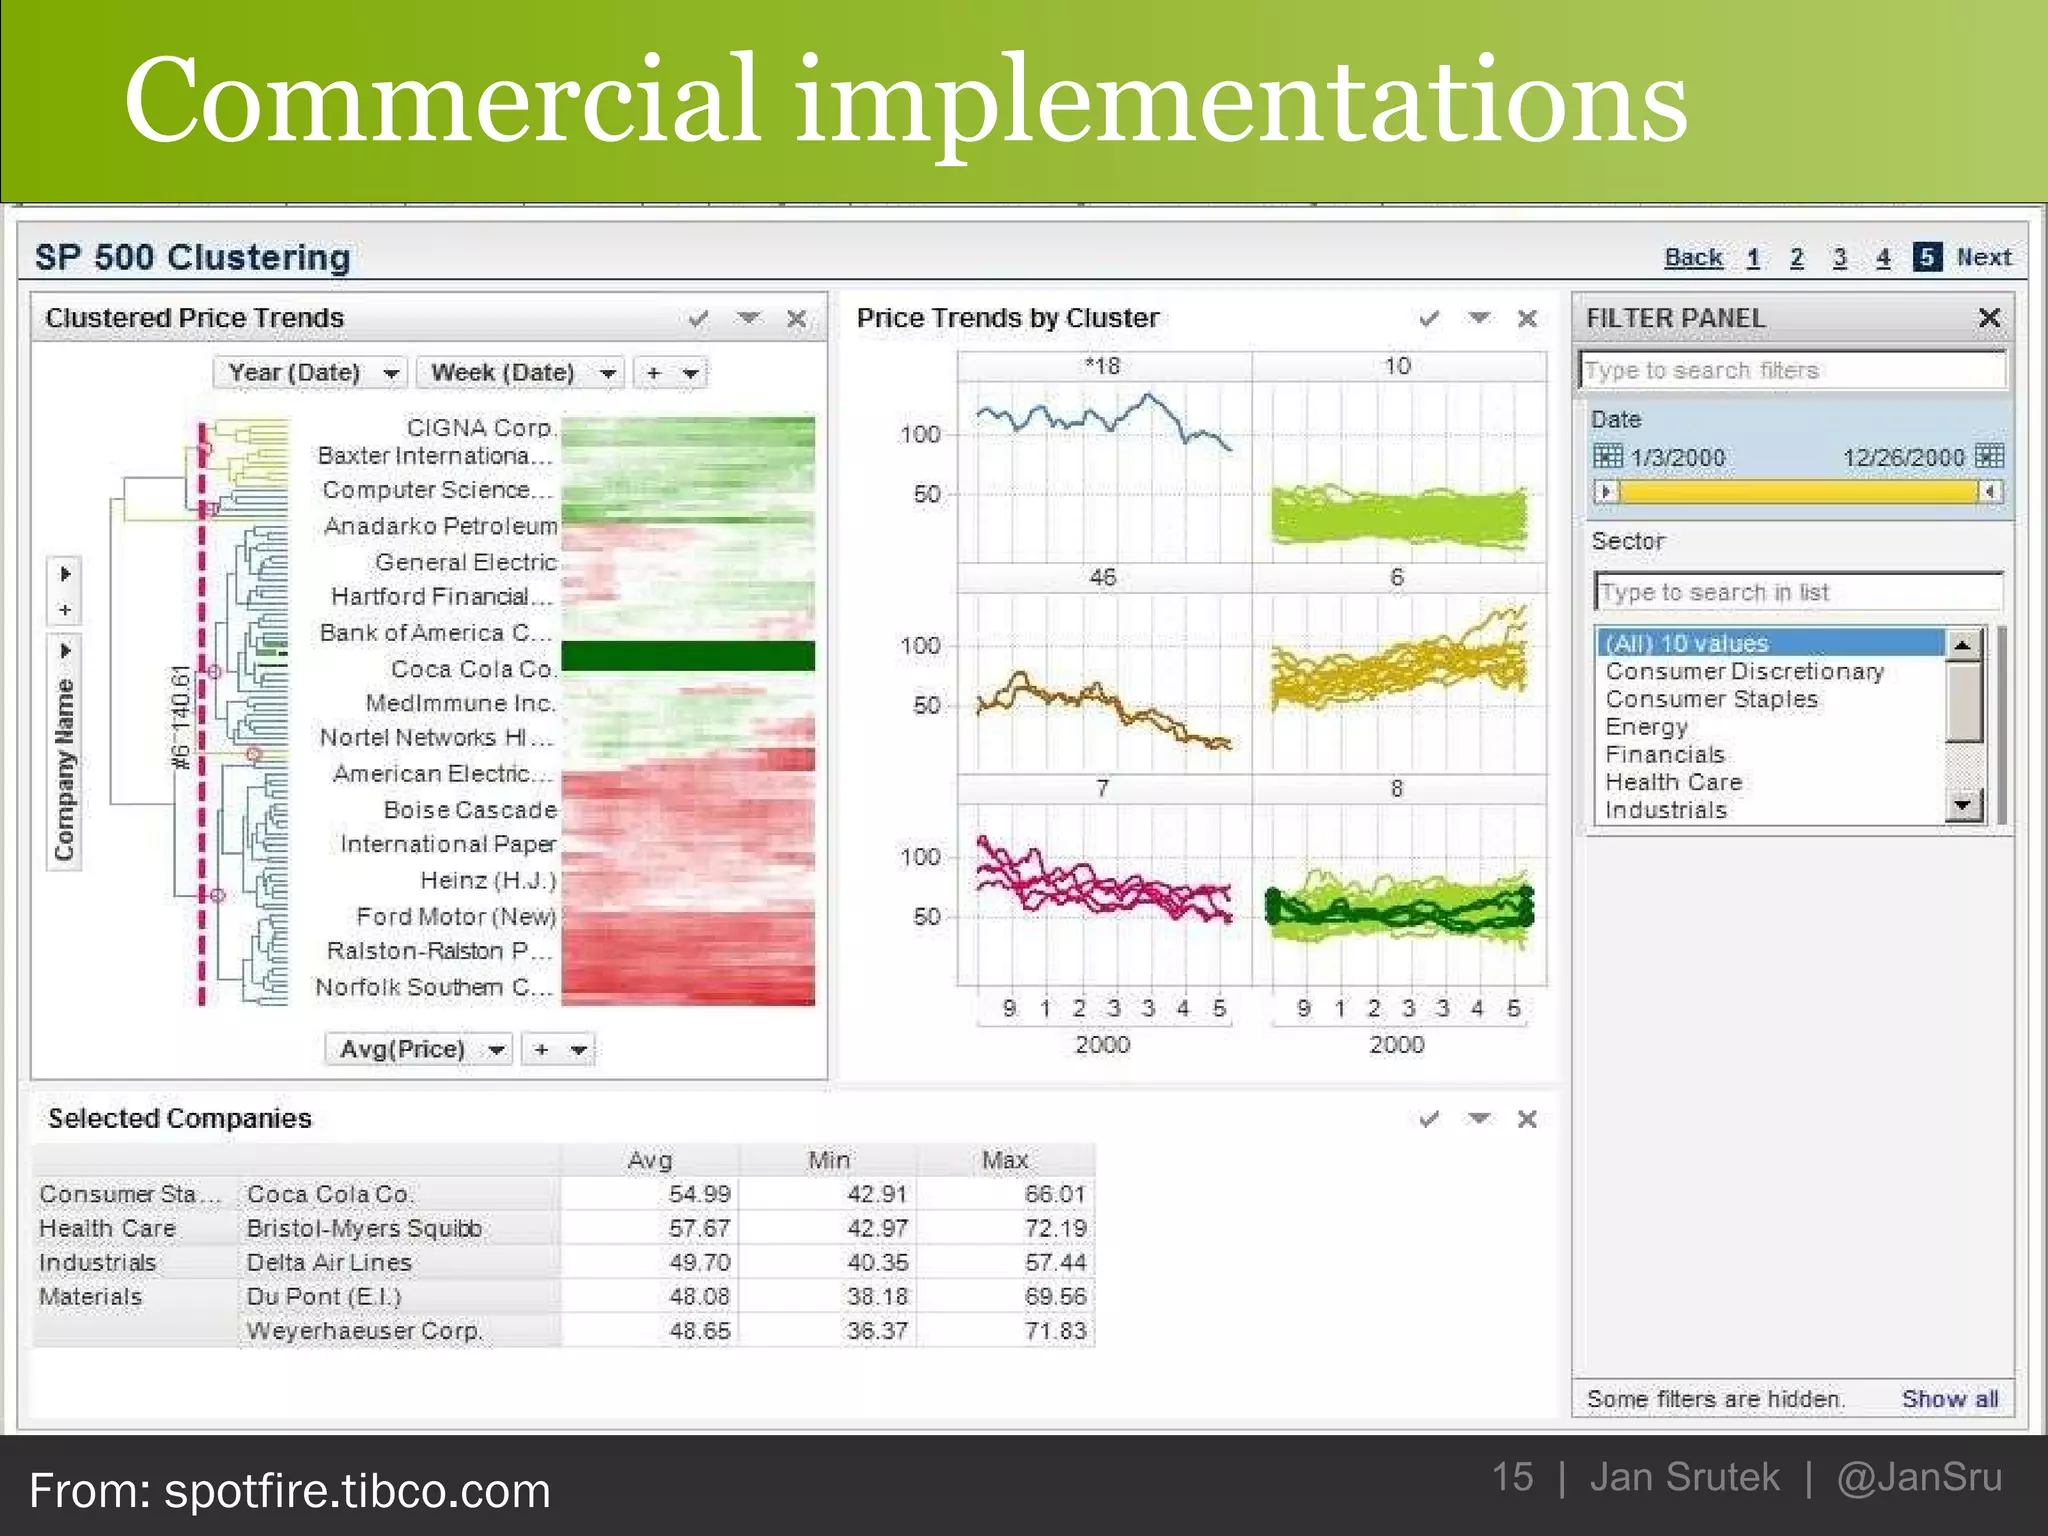
Information visualization (infovis) can help make sense of large amounts of data by using interactive visual representations to amplify cognition. While infovis was once an academic field, it is now widely used in commercial tools and by Google. However, designing effective infovis is challenging as simply making data graphical does not ensure it is useful. Proper evaluation of infovis experiences and performance is also difficult as insight is hard to measure and the experience is subjective.


