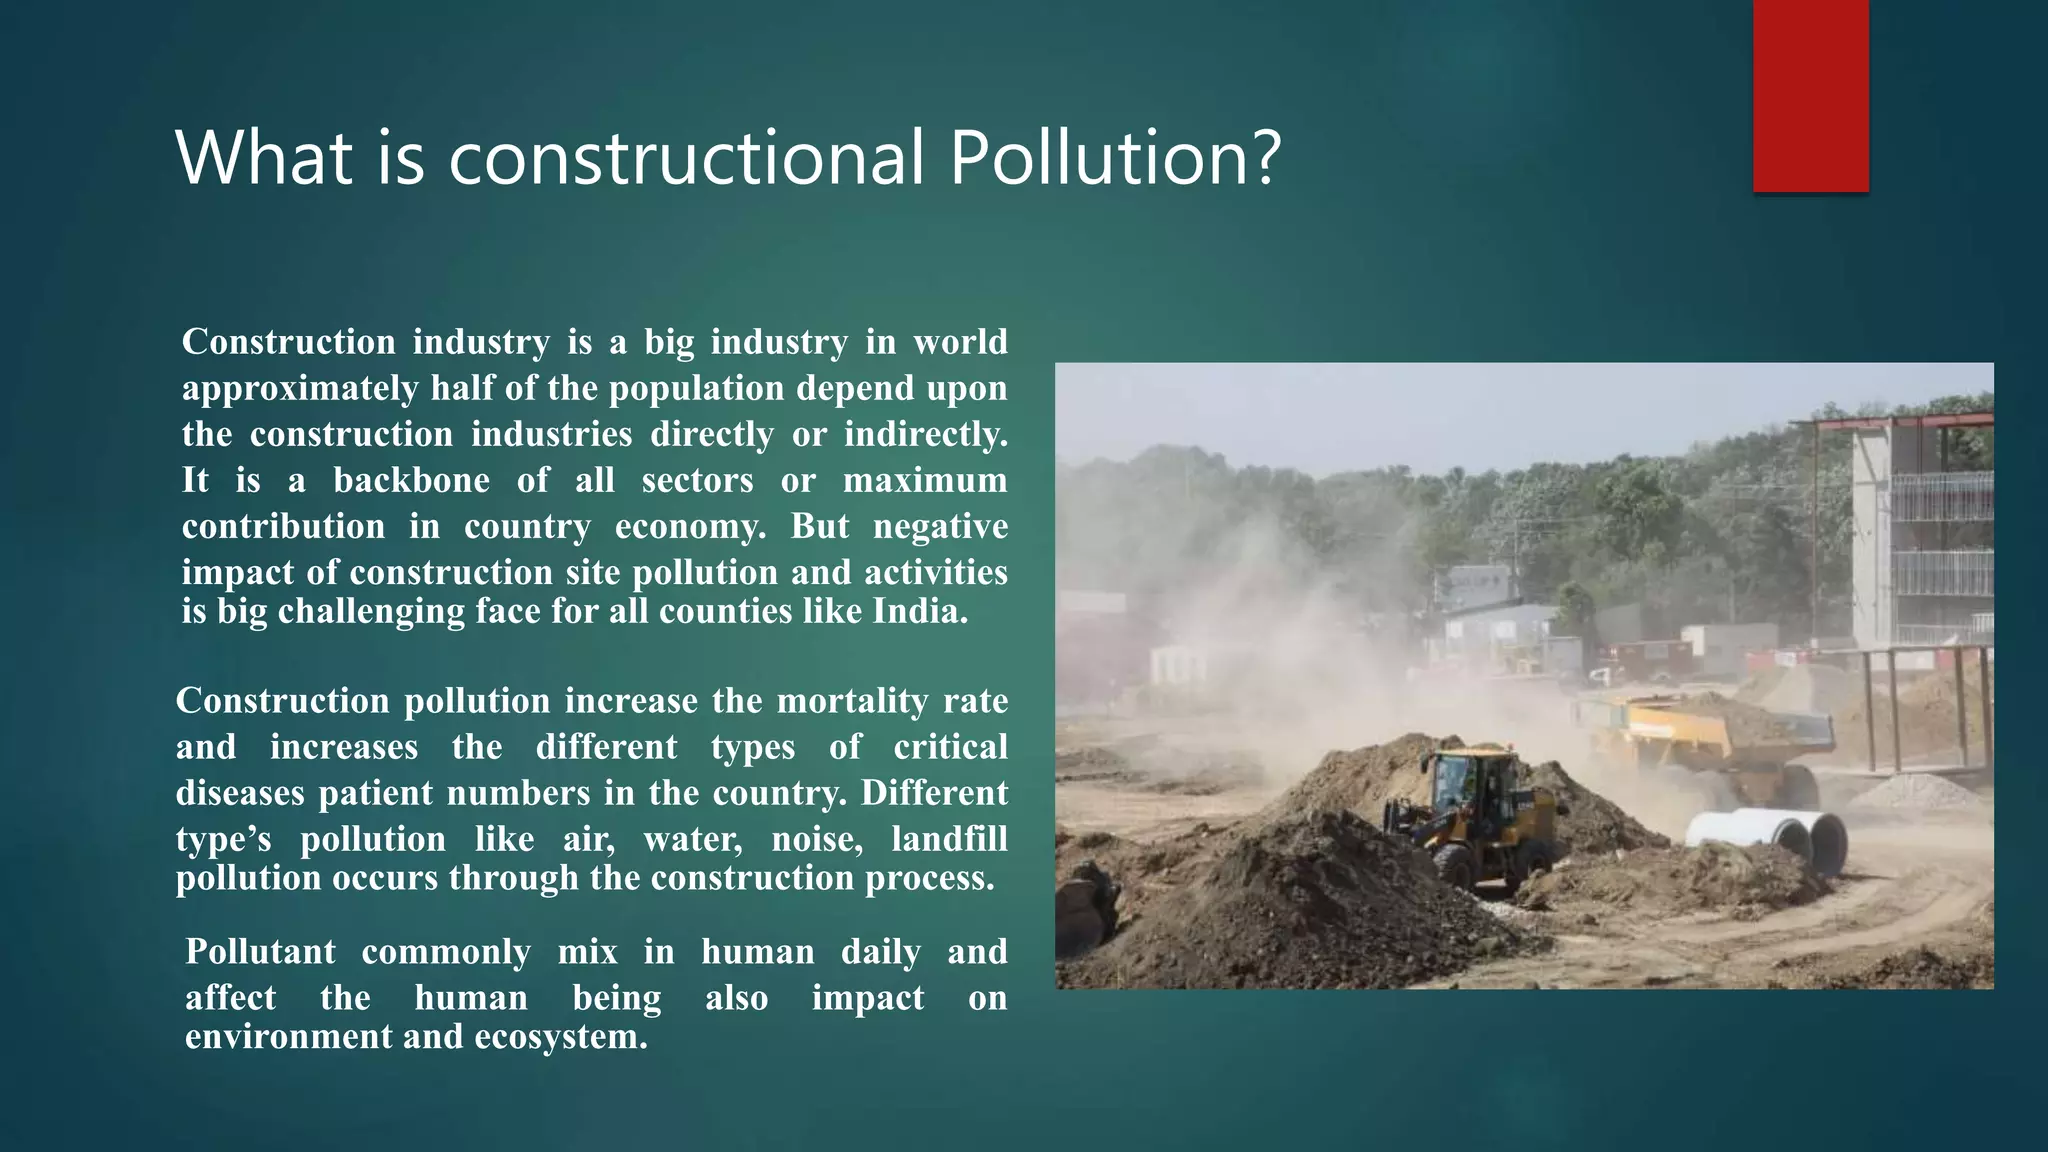
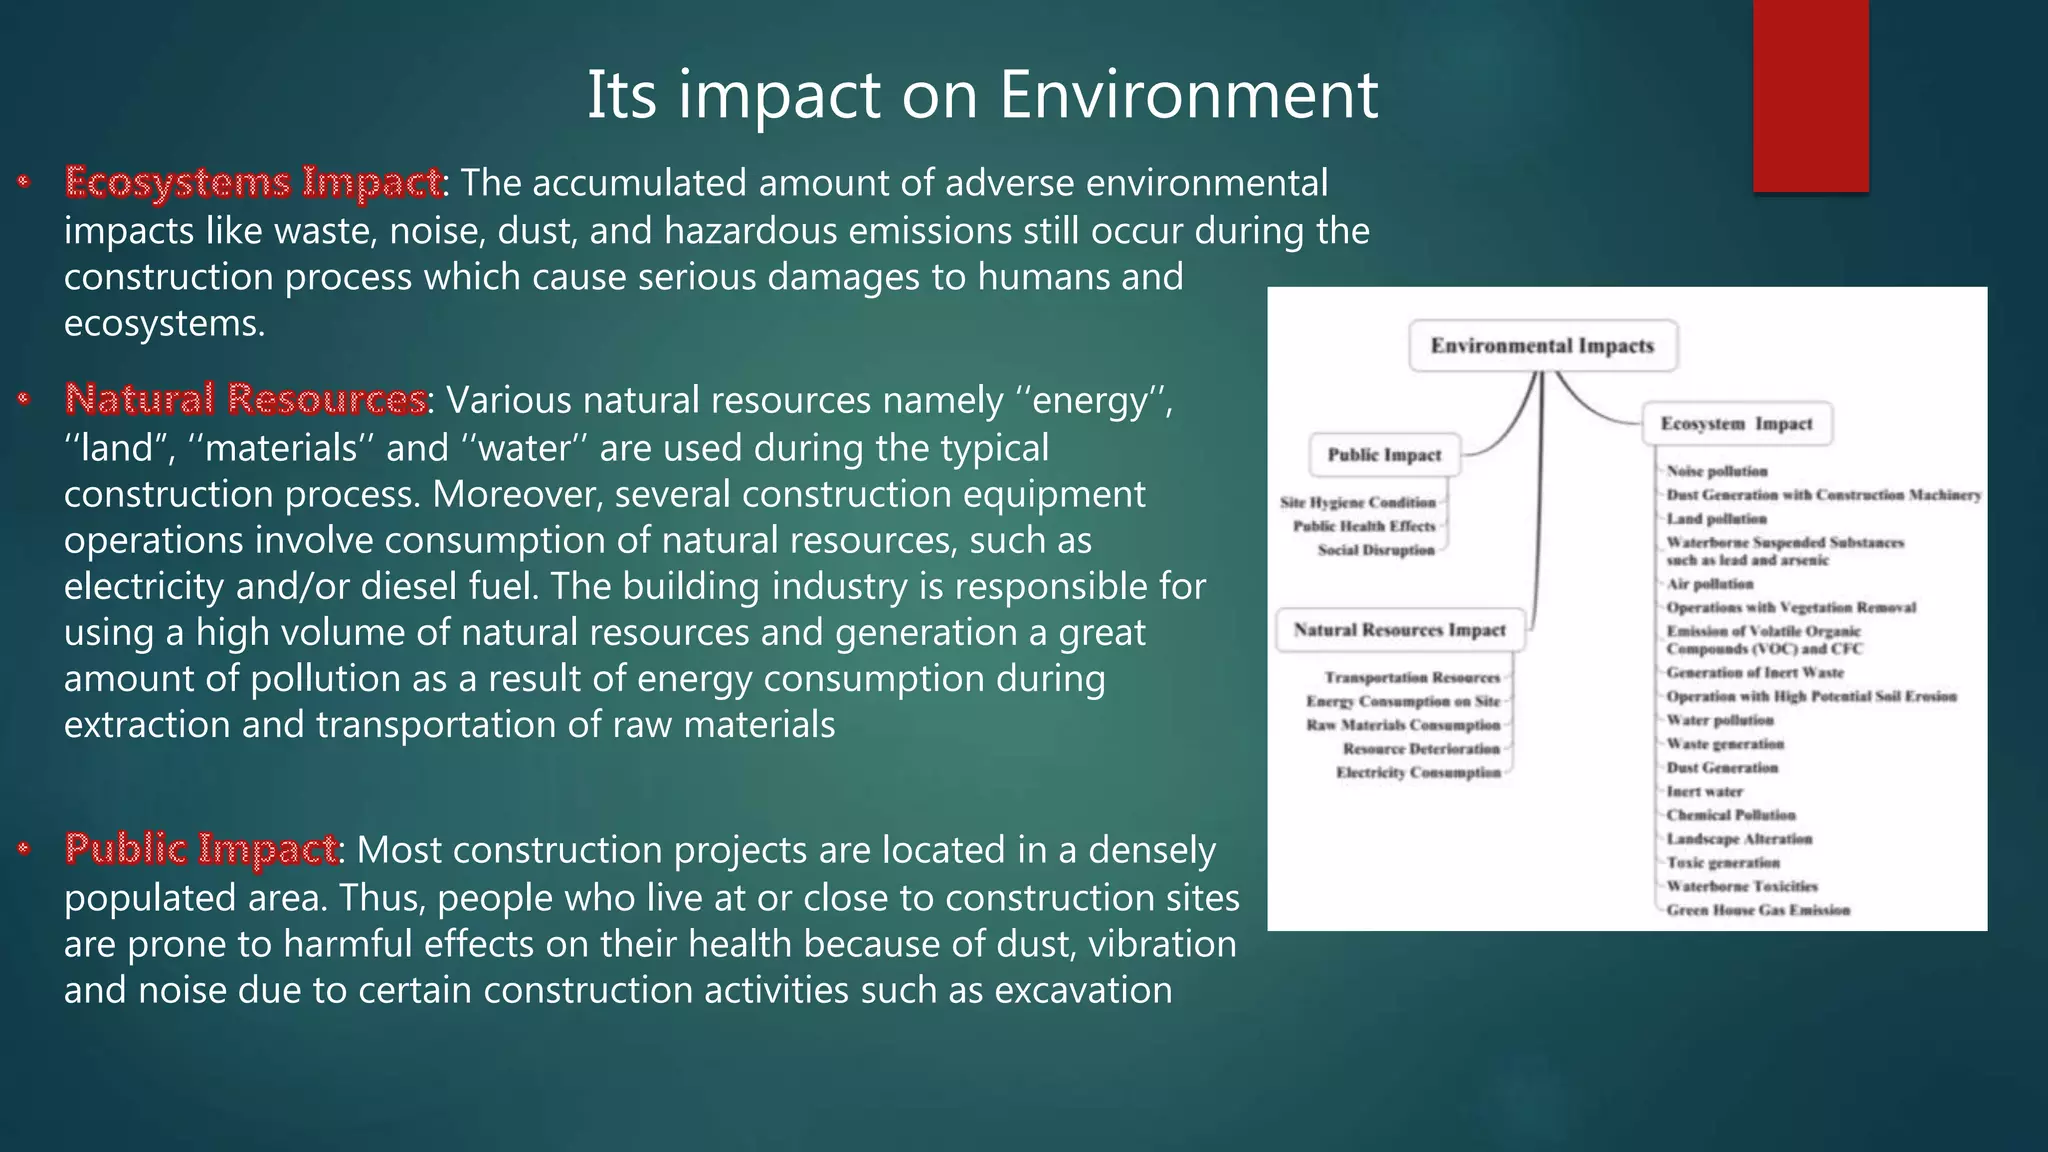
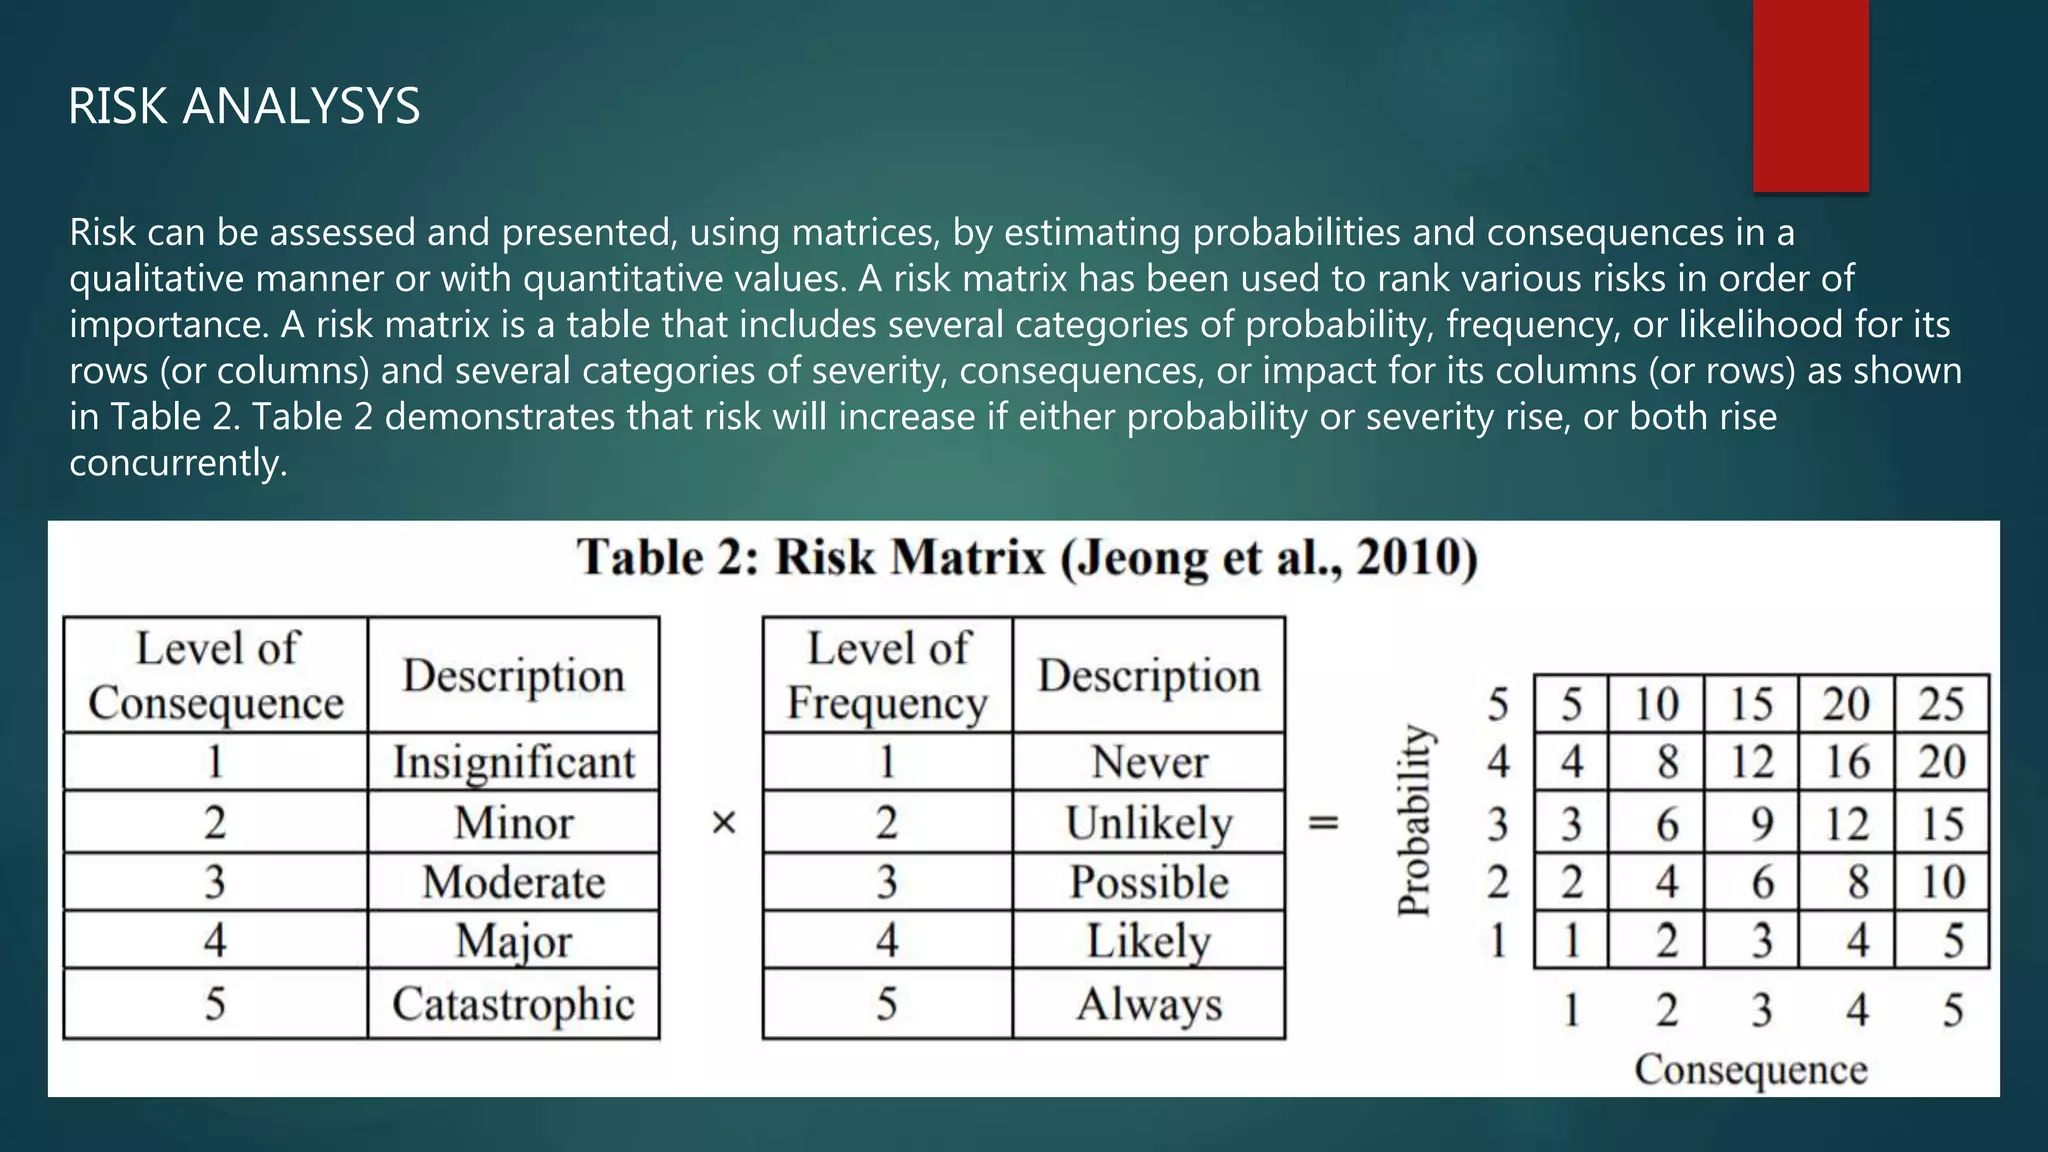
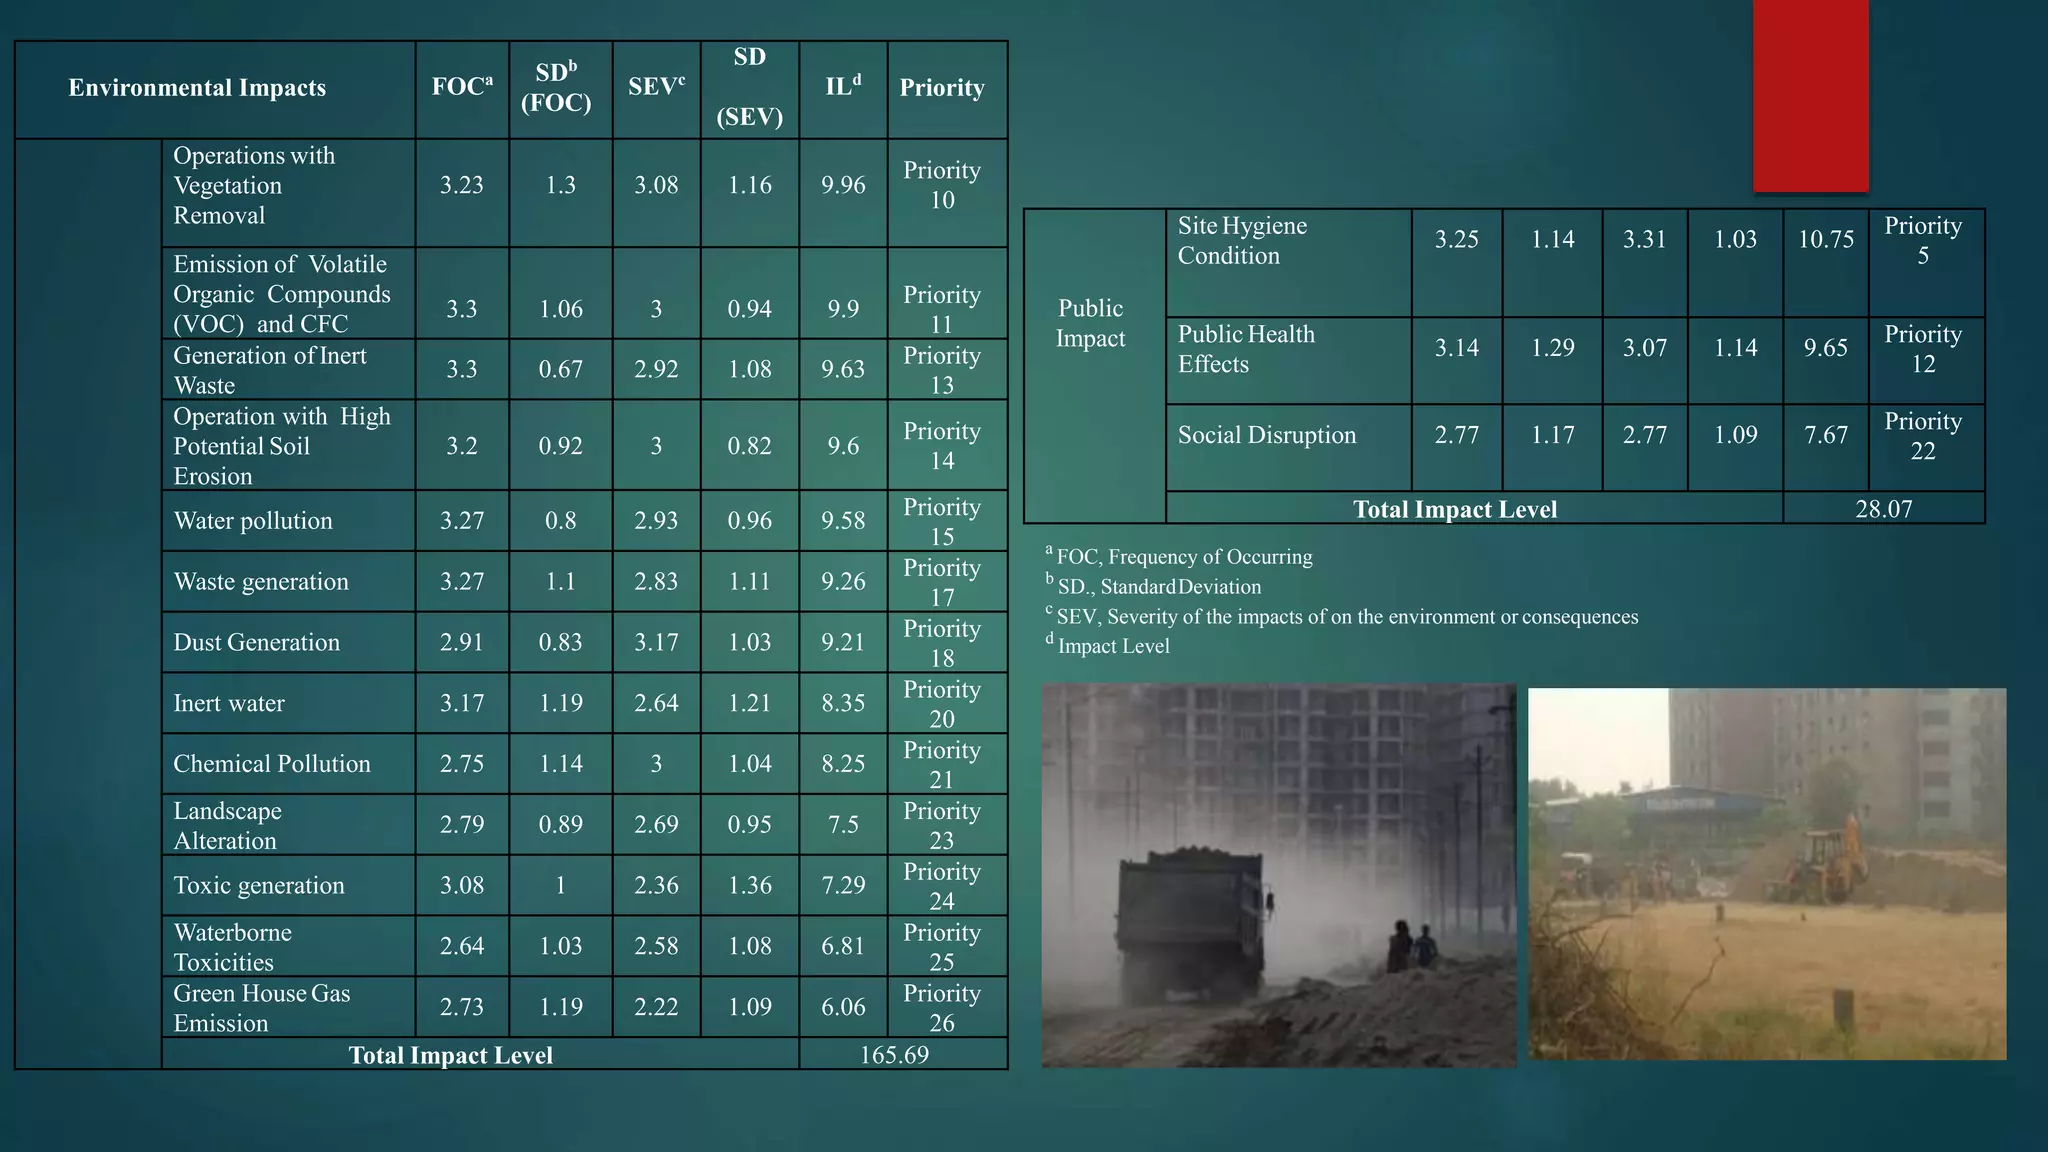
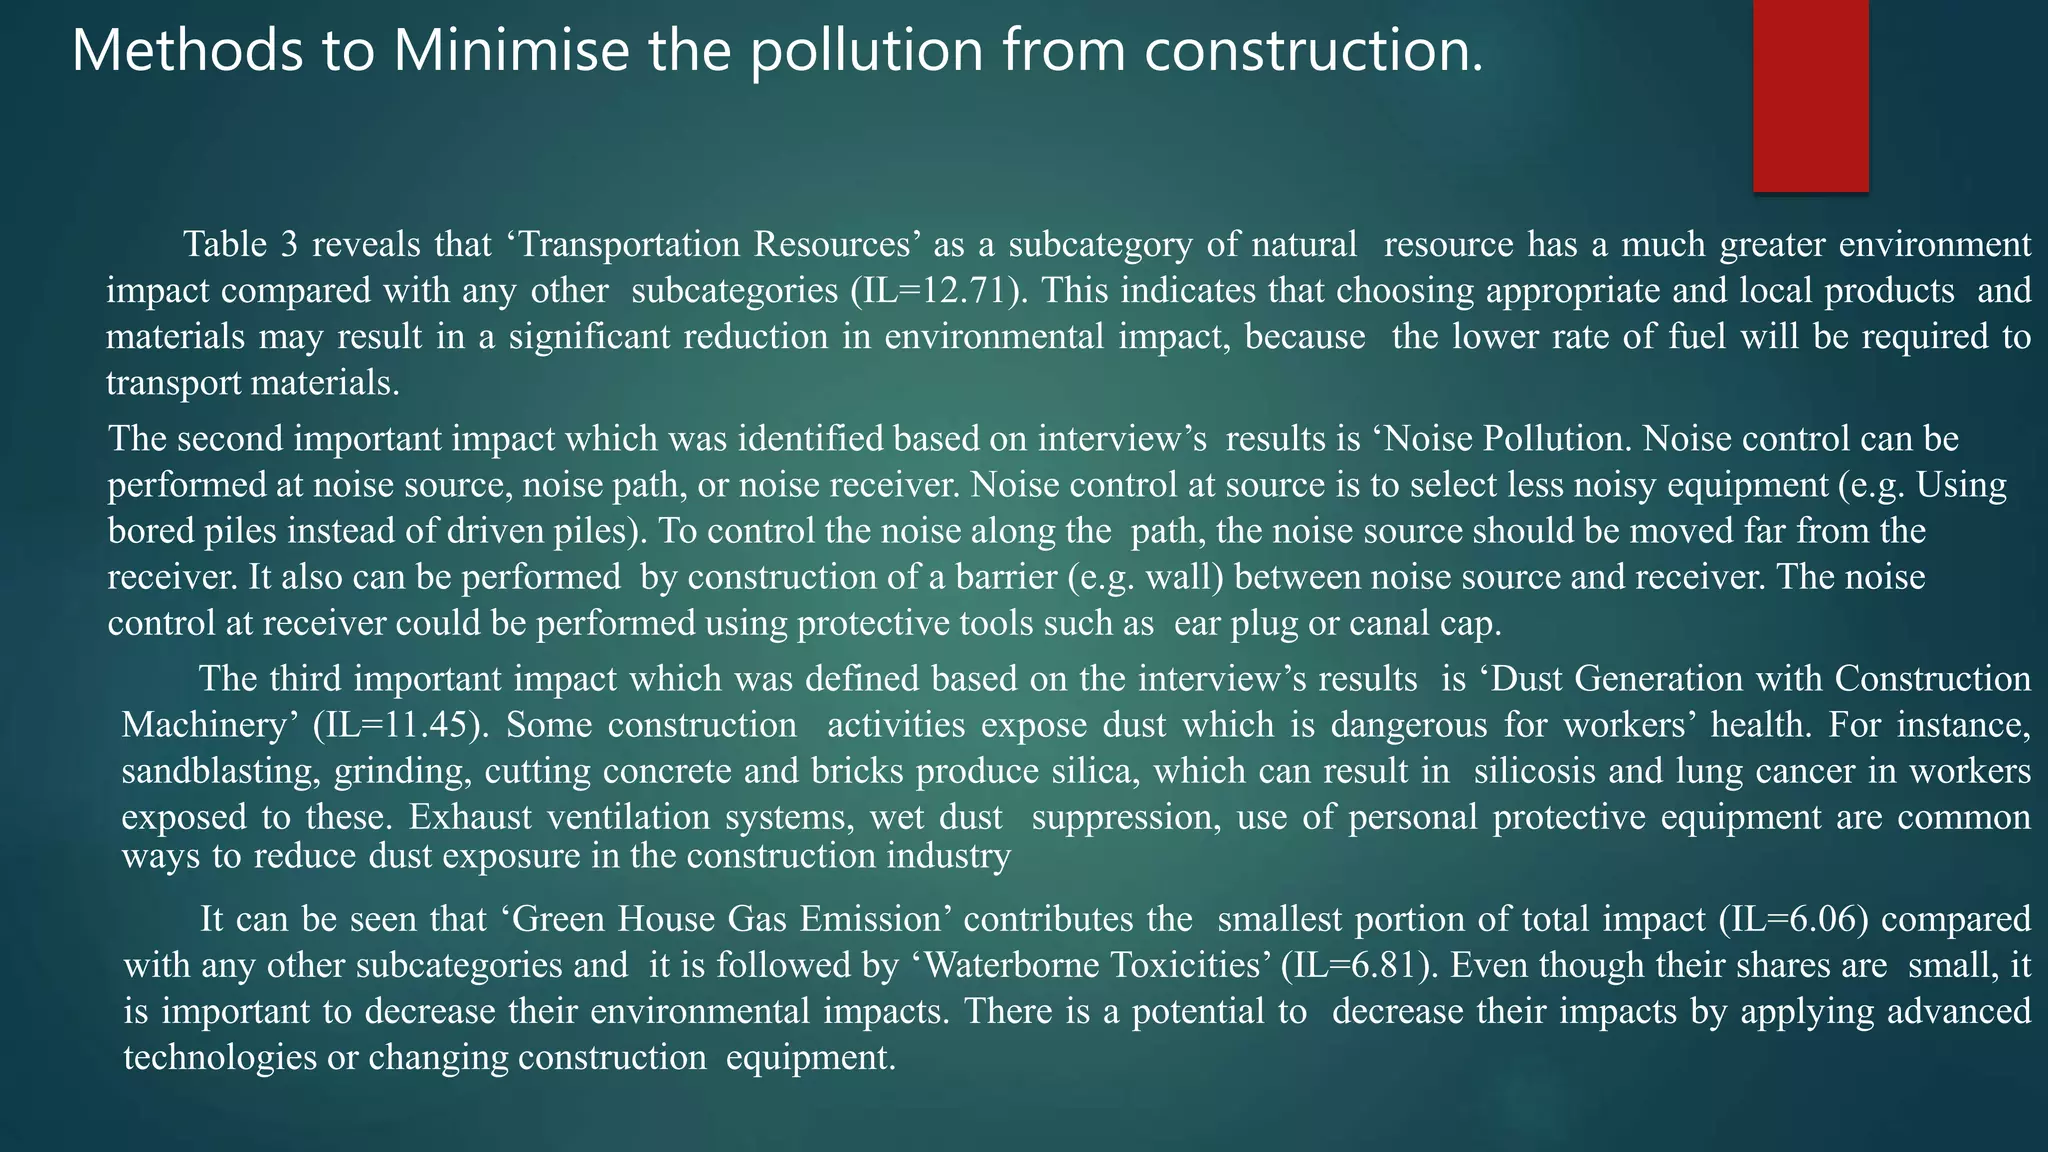
What is constructional Pollution?
Construction industry is a big industry in world
approximately half of the population depend upon
the construction industries directly or indirectly.
It is a backbone of all sectors or maximum
contribution in country economy. But negative
impact of construction site pollution and activities
is big challenging face for all counties like India.
Construction pollution increase the mortality rate
and increases the different types of critical
diseases patient numbers in the country. Different
type’s pollution like air, water, noise, landfill
pollution occurs through the construction process.
Pollutant commonly mix in human daily and
affect the human being also impact on
environment and ecosystem.
Types of pollution cause by construction?
SOIL POLLUTION
NOISE POLLUTION
AIR POLLUTION
WATER POLLUTION
Its impact on Environment
: The accumulated amount of adverse environmental
impacts like waste, noise, dust, and hazardous emissions still occur during the
construction process which cause serious damages to humans and
ecosystems.
: Various natural resources namely ‘‘energy’’,
‘‘land”, ‘‘materials’’ and ‘‘water’’ are used during the typical
construction process. Moreover, several construction equipment
operations involve consumption of natural resources, such as
electricity and/or diesel fuel. The building industry is responsible for
using a high volume of natural resources and generation a great
amount of pollution as a result of energy consumption during
extraction and transportation of raw materials
: Most construction projects are located in a densely
populated area. Thus, people who live at or close to construction sites
are prone to harmful effects on their health because of dust, vibration
and noise due to certain construction activities such as excavation
86.8
13.2
Do you know about
construction pollution ?
yes no
22
37.3
24
16.7
What do you think causes
construction pollution ?
Flats Building Small houses None
85
15
Do you think eco-friendly
houses reduce construction
pollution ?
Yes No
Survey result
METHODOLOGY
A structured survey with group of people which were connected to the construction industry was
conducted to investigate the frequency and severity of environmental impacts across construction of
residential buildings in Chaheru, Punjab. The interview included two main sections, section A covered
the background and general information of the respondents, and Section B invited respondents to
rate the frequency and severity of the environmental impacts using the five-point Likert Scale (Table
1).
Risk can be assessed and presented, using matrices, by estimating probabilities and consequences in a
qualitative manner or with quantitative values. A risk matrix has been used to rank various risks in order of
importance. A risk matrix is a table that includes several categories of probability, frequency, or likelihood for its
rows (or columns) and several categories of severity, consequences, or impact for its columns (or rows) as shown
in Table 2. Table 2 demonstrates that risk will increase if either probability or severity rise, or both rise
concurrently.
RISK ANALYSYS
Environmental Risk Assessment
Table 3 shows the average of Likert Scales
of respondents’ opinion regarding the frequency
and severity of the environmental impacts across
construction processes of residential buildings as
well as their associated risk in order of priority,
based on results of interview with the expert
panel group. The methodology required ranking
of the environmental impacts, so the score for
each environmental impact could be compared
with each other. Higher scores indicate impacts
on the environment are worst compared to
others.
Environmental Impacts FOCa SDb
(FOC)
SEVc
SD
(SEV)
ILd
Priority
Natural
Resources
Impact
Transportation
Resources
3.79 0.89 3.36 0.93 12.71
Priority
1
Energy
Consumption on
Site
3.24 1.06 3.36 0.87 10.89
Priority
4
Raw Materials
Consumption
3.25 0.97 3.23 1.01 10.5
Priority
7
Resource
Deterioration
3.08 0.79 3.1 0.88 9.56
Priority
16
Electricity
Consumption
2.86 1.17 3 1.04 8.57
Priority
19
Total Impact Level 52.23
Ecosystem
Impact
Noise pollution 3.67 1.05 3.23 1.09 11.85
Priority
2
Dust Generation
with Construction
Machinery
3.46 1.2 3.31 1.03 11.45
Priority
3
Land pollution 3.36 1.21 3.18 1.17 10.7
Priority
6
Waterborne
Suspended
Substances such as
lead and arsenic
3.11 1.27 3.27 1.1 10.18
Priority
8
Air pollution 3.29 1.14 3.08 1.26 10.11
Priority
9
Table 3: The Average of Common Environmental impacts Assessments of Construction Processes
Environmental Impacts FOCa SDb
(FOC)
SEVc
SD
(SEV)
ILd
Priority
Operations with
Vegetation
Removal
3.23 1.3 3.08 1.16 9.96
Priority
10
Emission of Volatile
Organic Compounds
(VOC) and CFC
3.3 1.06 3 0.94 9.9
Priority
11
Generation of Inert
Waste
3.3 0.67 2.92 1.08 9.63
Priority
13
Operation with High
Potential Soil
Erosion
3.2 0.92 3 0.82 9.6
Priority
14
Water pollution 3.27 0.8 2.93 0.96 9.58
Priority
15
Waste generation 3.27 1.1 2.83 1.11 9.26
Priority
17
Dust Generation 2.91 0.83 3.17 1.03 9.21
Priority
18
Inert water 3.17 1.19 2.64 1.21 8.35
Priority
20
Chemical Pollution 2.75 1.14 3 1.04 8.25
Priority
21
Landscape
Alteration
2.79 0.89 2.69 0.95 7.5
Priority
23
Toxic generation 3.08 1 2.36 1.36 7.29
Priority
24
Waterborne
Toxicities
2.64 1.03 2.58 1.08 6.81
Priority
25
Green House Gas
Emission
2.73 1.19 2.22 1.09 6.06
Priority
26
Total Impact Level 165.69
Public
Impact
Site Hygiene
Condition
3.25 1.14 3.31 1.03 10.75
Priority
5
Public Health
Effects
3.14 1.29 3.07 1.14 9.65
Priority
12
Social Disruption 2.77 1.17 2.77 1.09 7.67
Priority
22
Total Impact Level 28.07
a
FOC, Frequency of Occurring
b
SD., StandardDeviation
c
SEV, Severity of the impacts of on the environment or consequences
d
Impact Level
Methods to Minimise the pollution from construction.
Table 3 reveals that ‘Transportation Resources’ as a subcategory of natural resource has a much greater environment
impact compared with any other subcategories (IL=12.71). This indicates that choosing appropriate and local products and
materials may result in a significant reduction in environmental impact, because the lower rate of fuel will be required to
transport materials.
The second important impact which was identified based on interview’s results is ‘Noise Pollution. Noise control can be
performed at noise source, noise path, or noise receiver. Noise control at source is to select less noisy equipment (e.g. Using
bored piles instead of driven piles). To control the noise along the path, the noise source should be moved far from the
receiver. It also can be performed by construction of a barrier (e.g. wall) between noise source and receiver. The noise
control at receiver could be performed using protective tools such as ear plug or canal cap.
The third important impact which was defined based on the interview’s results is ‘Dust Generation with Construction
Machinery’ (IL=11.45). Some construction activities expose dust which is dangerous for workers’ health. For instance,
sandblasting, grinding, cutting concrete and bricks produce silica, which can result in silicosis and lung cancer in workers
exposed to these. Exhaust ventilation systems, wet dust suppression, use of personal protective equipment are common
ways to reduce dust exposure in the construction industry
It can be seen that ‘Green House Gas Emission’ contributes the smallest portion of total impact (IL=6.06) compared
with any other subcategories and it is followed by ‘Waterborne Toxicities’ (IL=6.81). Even though their shares are small, it
is important to decrease their environmental impacts. There is a potential to decrease their impacts by applying advanced
technologies or changing construction equipment.
This study investigated the environmental impacts due to construction
processes in residential building in chaheru in order of their impact levels.
The survey was conducted to determine the frequency and severity of the
environmental impacts in the chaheru, Punjab region. The results
demonstrate that ‘Transportation Resources’, ‘Noise Pollution’, and ‘Dust
Generation with Construction Machinery’ are the most risky environmental
impacts on construction sites in the area.
Among the three environmental impacts, ‘Ecosystem Impacts’ has the
greatest impact on the environment (67.5% of total impacts). ‘Natural
Resources Impact’ accounts for 21%, while ‘Public Impact’ consists of only
11.5%.
CONCLUSION

EFFECT OF CONSTRUCTION INDUSTRY ON ENVIRONMENT

  • 2.
    What is constructionalPollution? Construction industry is a big industry in world approximately half of the population depend upon the construction industries directly or indirectly. It is a backbone of all sectors or maximum contribution in country economy. But negative impact of construction site pollution and activities is big challenging face for all counties like India. Construction pollution increase the mortality rate and increases the different types of critical diseases patient numbers in the country. Different type’s pollution like air, water, noise, landfill pollution occurs through the construction process. Pollutant commonly mix in human daily and affect the human being also impact on environment and ecosystem.
  • 3.
    Types of pollutioncause by construction? SOIL POLLUTION NOISE POLLUTION AIR POLLUTION WATER POLLUTION
  • 4.
    Its impact onEnvironment : The accumulated amount of adverse environmental impacts like waste, noise, dust, and hazardous emissions still occur during the construction process which cause serious damages to humans and ecosystems. : Various natural resources namely ‘‘energy’’, ‘‘land”, ‘‘materials’’ and ‘‘water’’ are used during the typical construction process. Moreover, several construction equipment operations involve consumption of natural resources, such as electricity and/or diesel fuel. The building industry is responsible for using a high volume of natural resources and generation a great amount of pollution as a result of energy consumption during extraction and transportation of raw materials : Most construction projects are located in a densely populated area. Thus, people who live at or close to construction sites are prone to harmful effects on their health because of dust, vibration and noise due to certain construction activities such as excavation
  • 5.
    86.8 13.2 Do you knowabout construction pollution ? yes no 22 37.3 24 16.7 What do you think causes construction pollution ? Flats Building Small houses None 85 15 Do you think eco-friendly houses reduce construction pollution ? Yes No Survey result
  • 6.
    METHODOLOGY A structured surveywith group of people which were connected to the construction industry was conducted to investigate the frequency and severity of environmental impacts across construction of residential buildings in Chaheru, Punjab. The interview included two main sections, section A covered the background and general information of the respondents, and Section B invited respondents to rate the frequency and severity of the environmental impacts using the five-point Likert Scale (Table 1).
  • 7.
    Risk can beassessed and presented, using matrices, by estimating probabilities and consequences in a qualitative manner or with quantitative values. A risk matrix has been used to rank various risks in order of importance. A risk matrix is a table that includes several categories of probability, frequency, or likelihood for its rows (or columns) and several categories of severity, consequences, or impact for its columns (or rows) as shown in Table 2. Table 2 demonstrates that risk will increase if either probability or severity rise, or both rise concurrently. RISK ANALYSYS
  • 8.
    Environmental Risk Assessment Table3 shows the average of Likert Scales of respondents’ opinion regarding the frequency and severity of the environmental impacts across construction processes of residential buildings as well as their associated risk in order of priority, based on results of interview with the expert panel group. The methodology required ranking of the environmental impacts, so the score for each environmental impact could be compared with each other. Higher scores indicate impacts on the environment are worst compared to others. Environmental Impacts FOCa SDb (FOC) SEVc SD (SEV) ILd Priority Natural Resources Impact Transportation Resources 3.79 0.89 3.36 0.93 12.71 Priority 1 Energy Consumption on Site 3.24 1.06 3.36 0.87 10.89 Priority 4 Raw Materials Consumption 3.25 0.97 3.23 1.01 10.5 Priority 7 Resource Deterioration 3.08 0.79 3.1 0.88 9.56 Priority 16 Electricity Consumption 2.86 1.17 3 1.04 8.57 Priority 19 Total Impact Level 52.23 Ecosystem Impact Noise pollution 3.67 1.05 3.23 1.09 11.85 Priority 2 Dust Generation with Construction Machinery 3.46 1.2 3.31 1.03 11.45 Priority 3 Land pollution 3.36 1.21 3.18 1.17 10.7 Priority 6 Waterborne Suspended Substances such as lead and arsenic 3.11 1.27 3.27 1.1 10.18 Priority 8 Air pollution 3.29 1.14 3.08 1.26 10.11 Priority 9 Table 3: The Average of Common Environmental impacts Assessments of Construction Processes
  • 9.
    Environmental Impacts FOCaSDb (FOC) SEVc SD (SEV) ILd Priority Operations with Vegetation Removal 3.23 1.3 3.08 1.16 9.96 Priority 10 Emission of Volatile Organic Compounds (VOC) and CFC 3.3 1.06 3 0.94 9.9 Priority 11 Generation of Inert Waste 3.3 0.67 2.92 1.08 9.63 Priority 13 Operation with High Potential Soil Erosion 3.2 0.92 3 0.82 9.6 Priority 14 Water pollution 3.27 0.8 2.93 0.96 9.58 Priority 15 Waste generation 3.27 1.1 2.83 1.11 9.26 Priority 17 Dust Generation 2.91 0.83 3.17 1.03 9.21 Priority 18 Inert water 3.17 1.19 2.64 1.21 8.35 Priority 20 Chemical Pollution 2.75 1.14 3 1.04 8.25 Priority 21 Landscape Alteration 2.79 0.89 2.69 0.95 7.5 Priority 23 Toxic generation 3.08 1 2.36 1.36 7.29 Priority 24 Waterborne Toxicities 2.64 1.03 2.58 1.08 6.81 Priority 25 Green House Gas Emission 2.73 1.19 2.22 1.09 6.06 Priority 26 Total Impact Level 165.69 Public Impact Site Hygiene Condition 3.25 1.14 3.31 1.03 10.75 Priority 5 Public Health Effects 3.14 1.29 3.07 1.14 9.65 Priority 12 Social Disruption 2.77 1.17 2.77 1.09 7.67 Priority 22 Total Impact Level 28.07 a FOC, Frequency of Occurring b SD., StandardDeviation c SEV, Severity of the impacts of on the environment or consequences d Impact Level
  • 10.
    Methods to Minimisethe pollution from construction. Table 3 reveals that ‘Transportation Resources’ as a subcategory of natural resource has a much greater environment impact compared with any other subcategories (IL=12.71). This indicates that choosing appropriate and local products and materials may result in a significant reduction in environmental impact, because the lower rate of fuel will be required to transport materials. The second important impact which was identified based on interview’s results is ‘Noise Pollution. Noise control can be performed at noise source, noise path, or noise receiver. Noise control at source is to select less noisy equipment (e.g. Using bored piles instead of driven piles). To control the noise along the path, the noise source should be moved far from the receiver. It also can be performed by construction of a barrier (e.g. wall) between noise source and receiver. The noise control at receiver could be performed using protective tools such as ear plug or canal cap. The third important impact which was defined based on the interview’s results is ‘Dust Generation with Construction Machinery’ (IL=11.45). Some construction activities expose dust which is dangerous for workers’ health. For instance, sandblasting, grinding, cutting concrete and bricks produce silica, which can result in silicosis and lung cancer in workers exposed to these. Exhaust ventilation systems, wet dust suppression, use of personal protective equipment are common ways to reduce dust exposure in the construction industry It can be seen that ‘Green House Gas Emission’ contributes the smallest portion of total impact (IL=6.06) compared with any other subcategories and it is followed by ‘Waterborne Toxicities’ (IL=6.81). Even though their shares are small, it is important to decrease their environmental impacts. There is a potential to decrease their impacts by applying advanced technologies or changing construction equipment.
  • 11.
    This study investigatedthe environmental impacts due to construction processes in residential building in chaheru in order of their impact levels. The survey was conducted to determine the frequency and severity of the environmental impacts in the chaheru, Punjab region. The results demonstrate that ‘Transportation Resources’, ‘Noise Pollution’, and ‘Dust Generation with Construction Machinery’ are the most risky environmental impacts on construction sites in the area. Among the three environmental impacts, ‘Ecosystem Impacts’ has the greatest impact on the environment (67.5% of total impacts). ‘Natural Resources Impact’ accounts for 21%, while ‘Public Impact’ consists of only 11.5%. CONCLUSION