Download to read offline

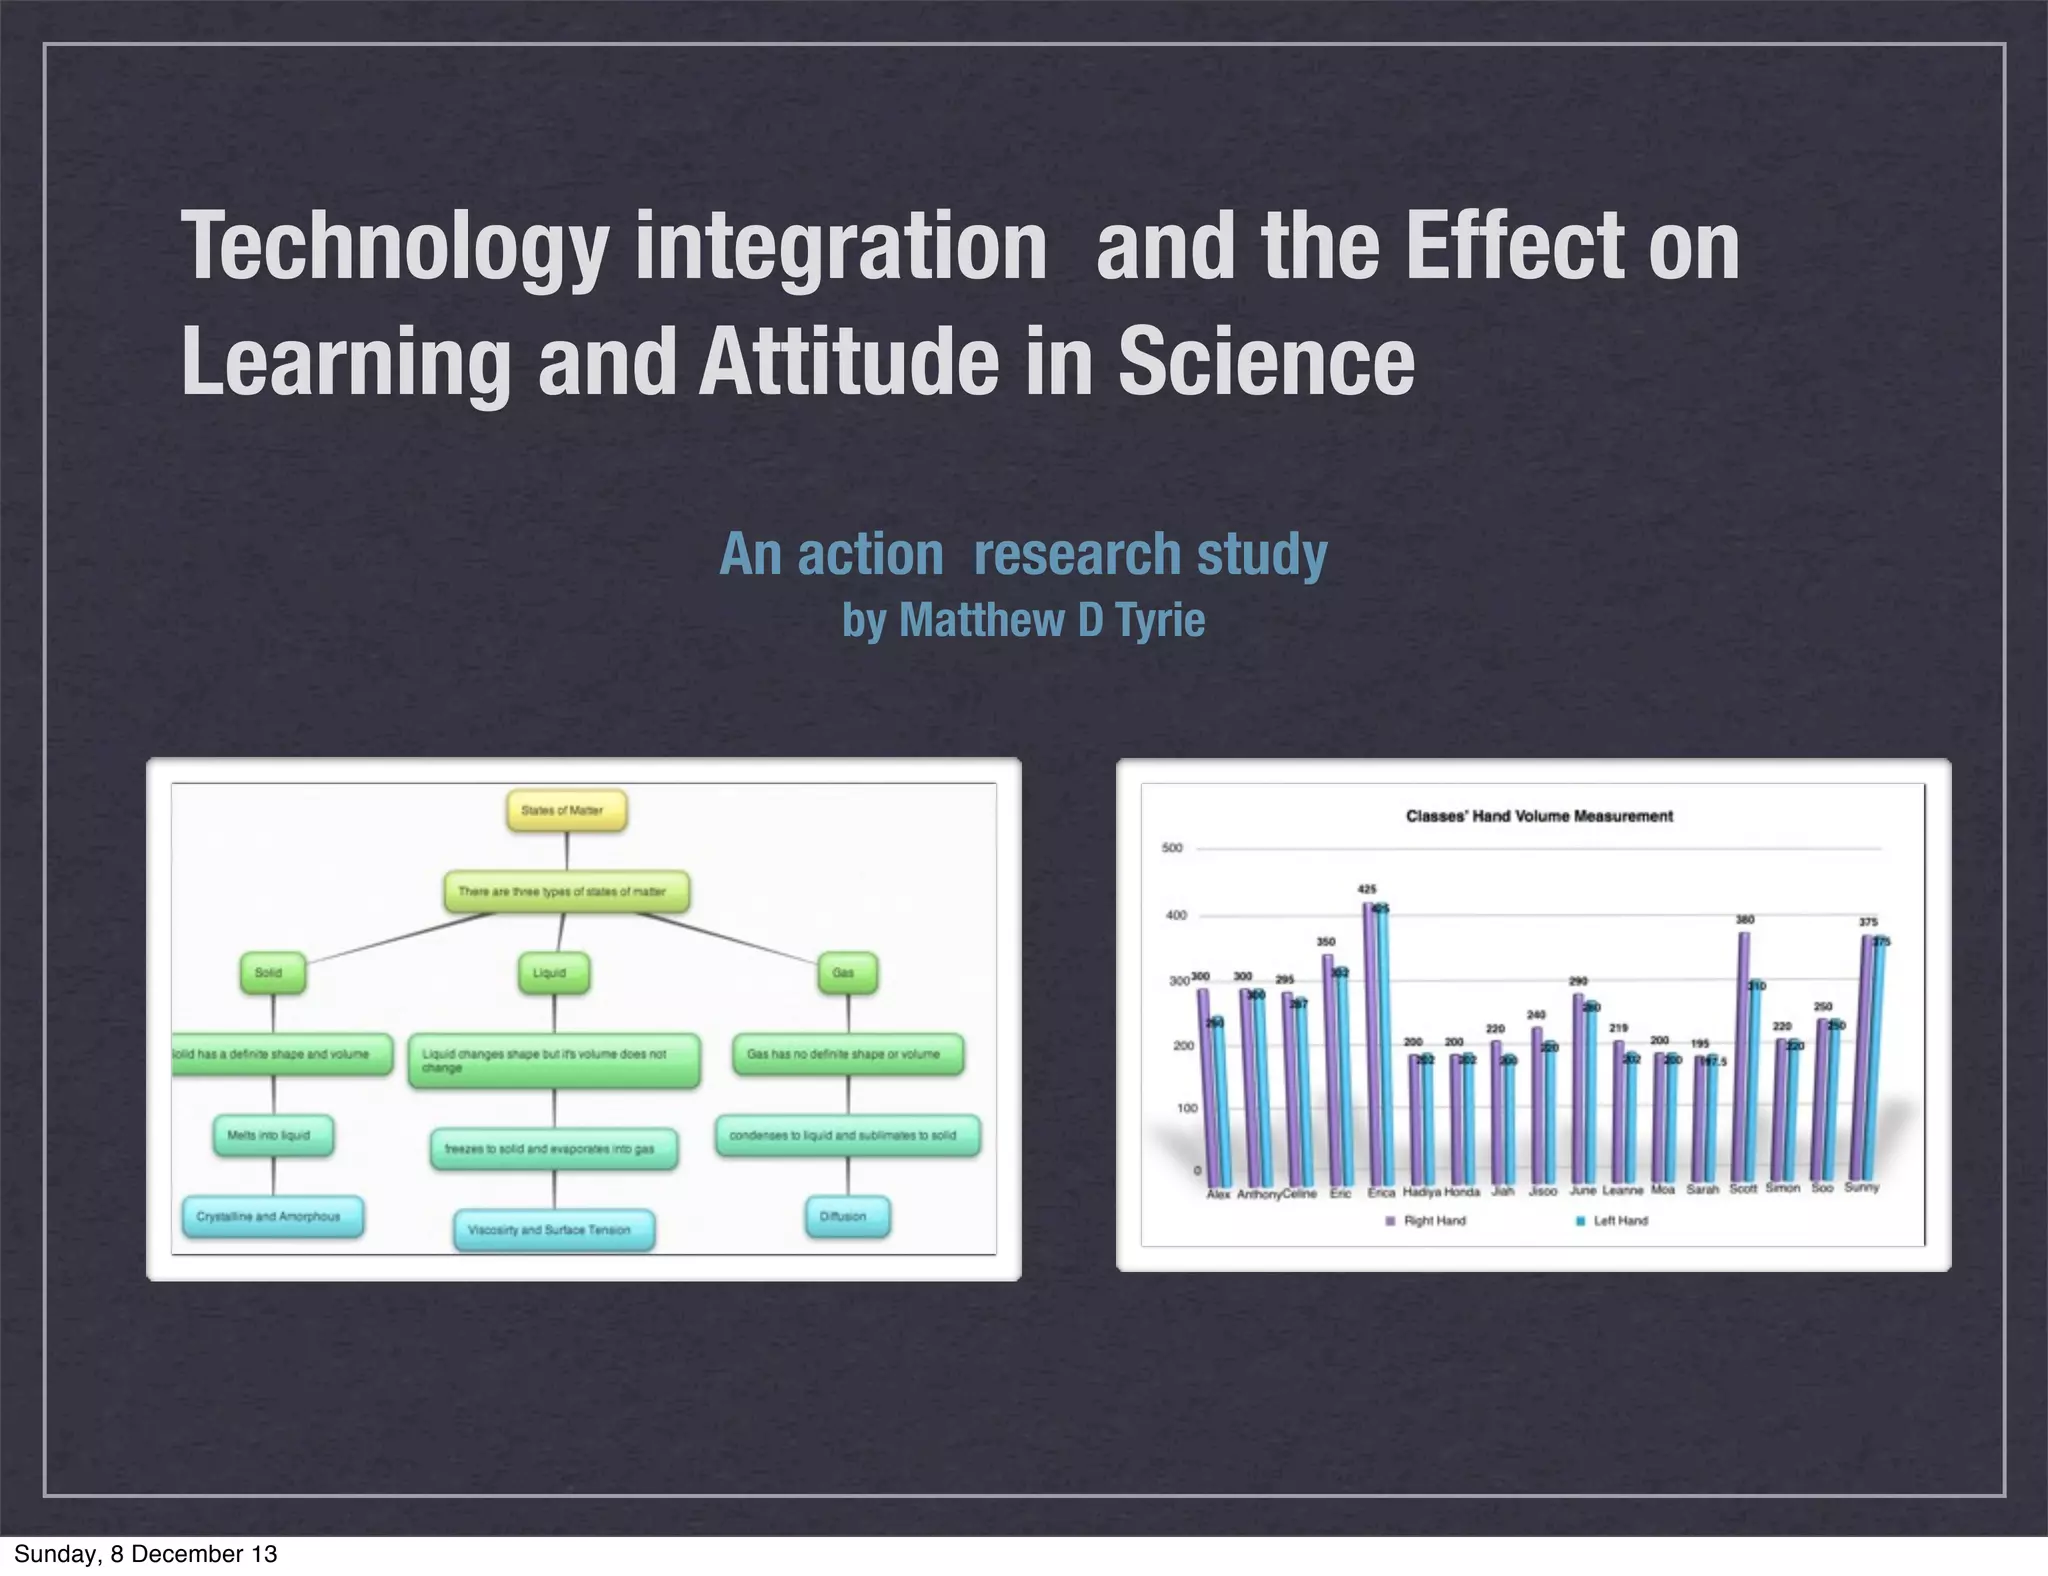
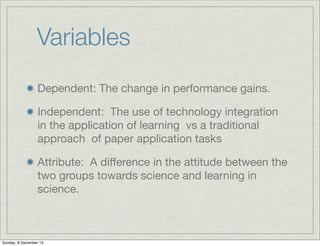
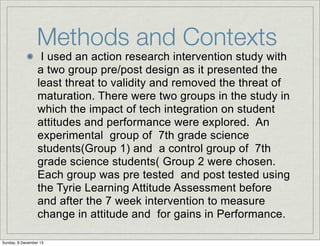
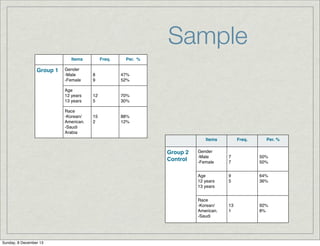
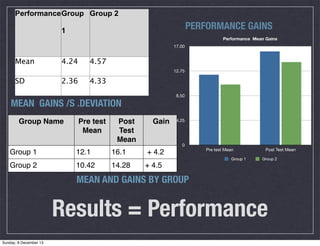
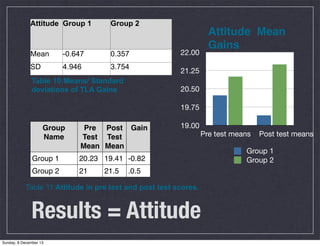

This document describes an action research study conducted by Matthew Tyrie to analyze the effect of technology integration on student performance and attitudes in science. The study involved two groups of 7th grade science students, with one group receiving traditional instruction and the other receiving instruction with additional technology-based learning tasks. Both groups were tested before and after to measure changes in performance and attitude. The results showed that the technology integration group improved more in performance but declined slightly in attitude, possibly due to some students preferring non-technology approaches. The study aims to provide insights on effective uses of technology to enhance learning.


