
Downloaded 140 times
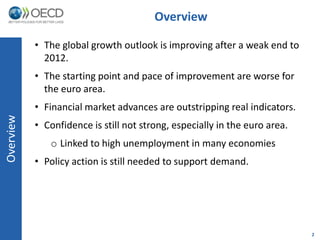
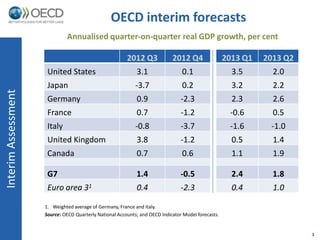
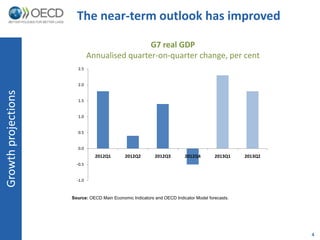
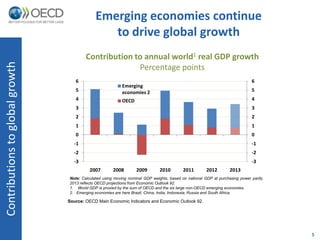
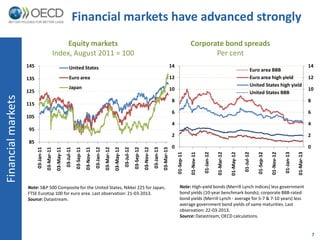


The near-term global economic outlook has shown signs of improvement following a weak end to 2012, yet the euro area remains hindered by high unemployment and requires ongoing policy support. While emerging economies are driving global growth, risks such as the euro area's recession and a disconnect between financial asset prices and real economy persist. Key recommendations include monetary policy easing, the development of a banking union in the euro area, and structural reforms across OECD countries to ensure sustainable recovery.


