Download to read offline
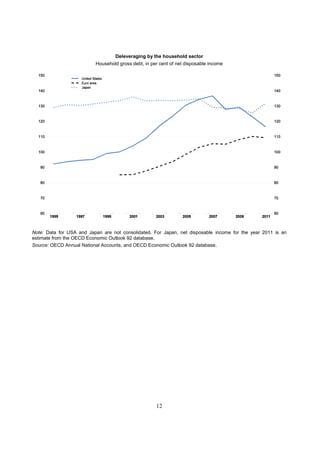
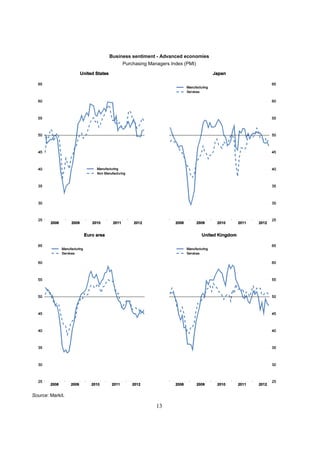
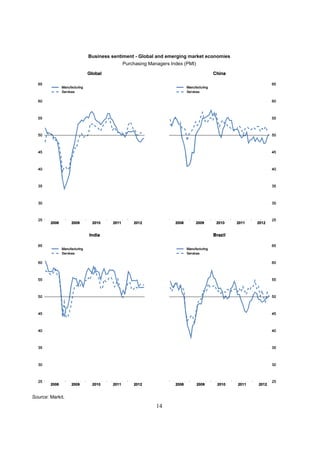
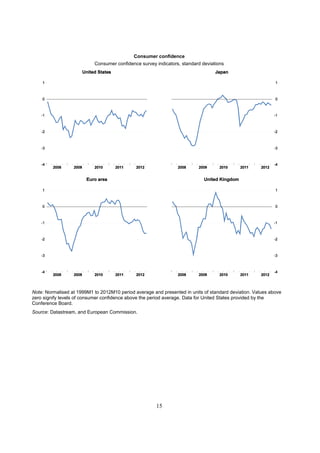

This document provides an economic outlook and projections from the OECD. It summarizes projections for real GDP growth, inflation, unemployment, trade growth, fiscal balances, and interest rates for major economies from 2012-2014. It finds that the global economy is weakening again due to lack of policy responses to issues like the fiscal cliff and eurozone crisis. Failure to take sufficient action now could push the global economy into recession. A positive policy response based on monetary, fiscal, and structural policies is needed to avoid downside risks and support more sustainable growth.


