Download to read offline


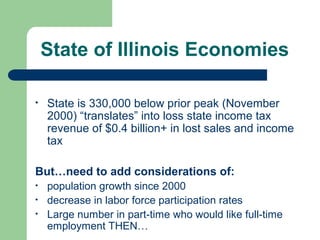
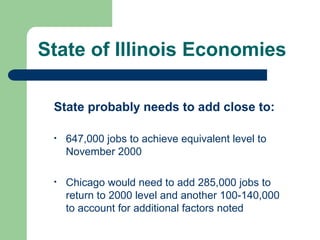
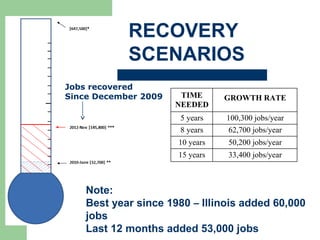
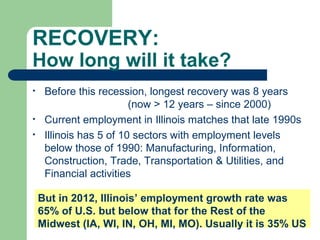
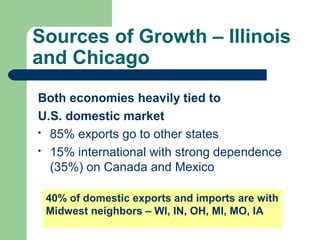
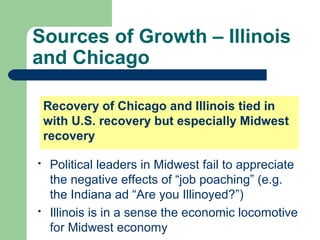
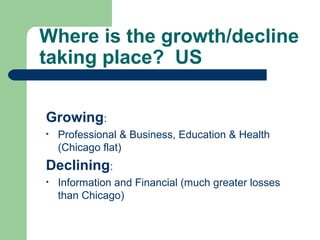
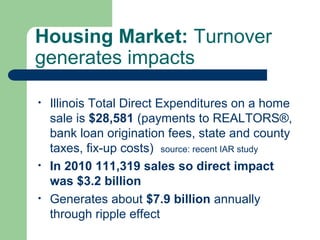
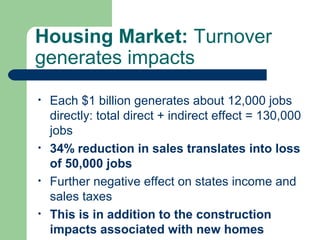
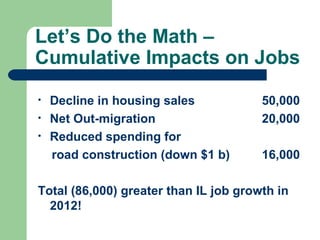
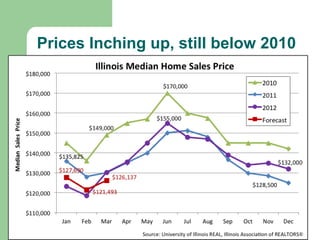
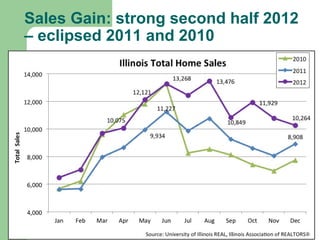
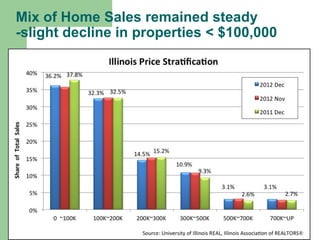
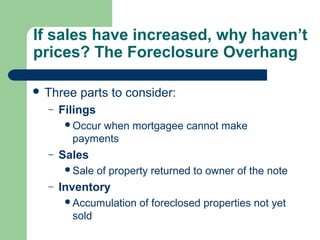
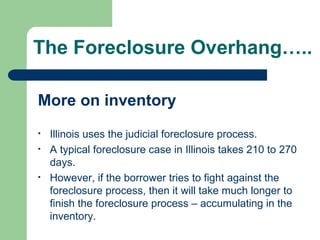


This document summarizes the state of the housing market and economy in Illinois. It finds that while housing sales increased in 2012, prices remained low due to a large inventory of foreclosed homes. Job growth is improving but remains below pre-recession levels. Continued recovery of the housing market and broader economy are dependent on addressing issues like high foreclosure rates, fiscal problems at the state level, and lack of leadership. The regional economy also remains tied to national and Midwest trends. Price and sales forecasts for 2013 anticipate only modest growth.