Download to read offline

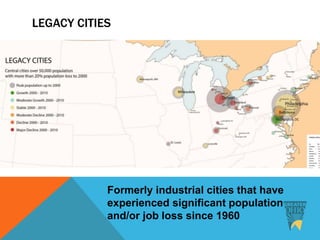
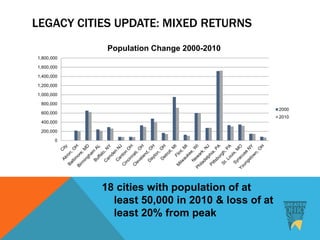
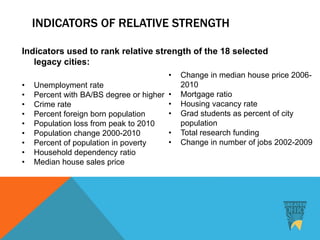
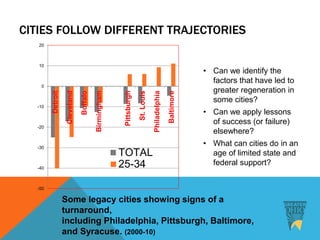
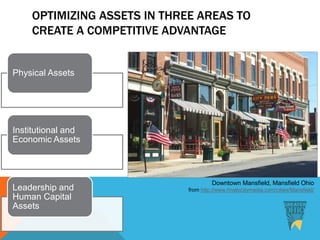

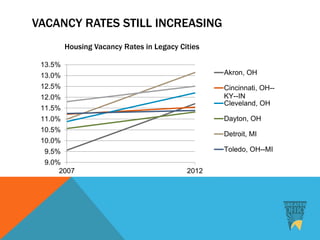

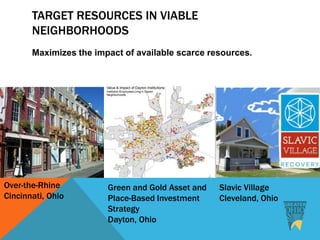
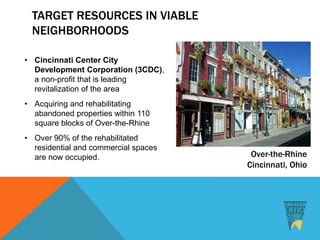
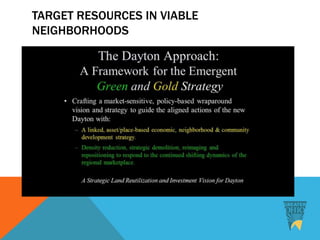


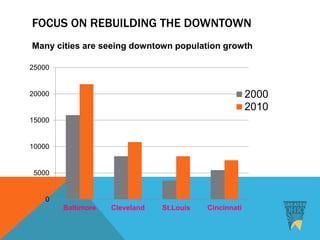
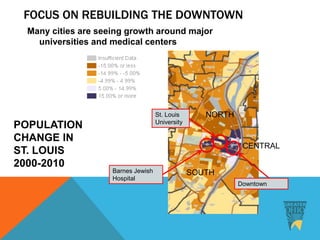

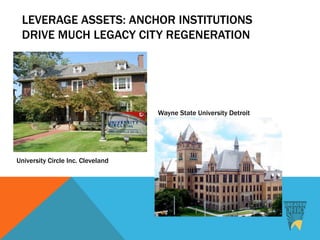
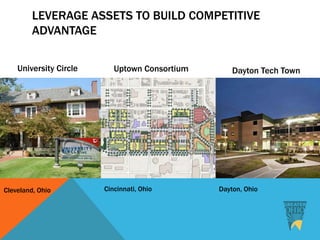

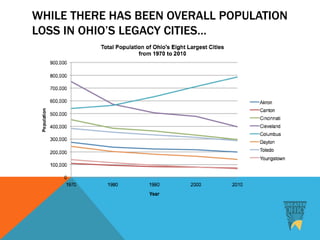
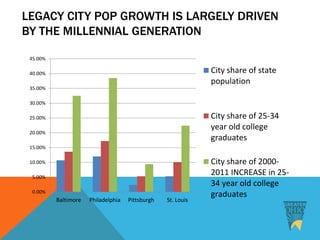


This document summarizes a report by the Greater Ohio Policy Center on legacy cities in Ohio. It discusses indicators used to measure the strength of 18 legacy cities, and finds that some cities like Philadelphia, Pittsburgh and Baltimore have shown signs of regeneration since 2000 while others like Detroit and Cleveland have continued losing population. It also examines strategies that have helped legacy cities leverage assets like focusing investment in viable neighborhoods and downtown areas. Critical challenges discussed include rising inequality, the need for stronger regional cooperation between cities.


