SlideShare a Scribd company logo
1 of 34
Download to read offline
For updated information, please visit www.ibef.org January 2018
E-COMMERCE
Table of Content
Executive Summary……………….….…….3
Advantage India…………………..….……..4
Market Overview …………………….……..6
Porter’s Five Forces Framework....…..…..15
Strategies Adopted………….……..…..…..16
Growth Drivers and Opportunities…….…..18
Industry Associations……………...…….....29
Case Studies…..……………..……………..26
Useful Information……….......……………..31
For updated information, please visit www.ibef.orgE-Commerce3
39
50
64 200
0
100
200
300
2017 2018F 2020F 2026F
429
700 829
0
500
1,000
2017* 2020 2021
Internet users in India (million)
India’s internet economy (US$ billion)
125
250
0
100
200
300
FY17 2020
Indian E-Commerce Market (US$ billion)
Source: Media sources, Aranca Research
Notes: CAGR - Compound Annual Growth Rate, * - as of September 2017
 The Indian e-commerce industry has been on an upward growth
trajectory and is expected to surpass the US to become the second
largest e-commerce market in the world by 2034.
 The e-commerce market is expected to reach US$ 64 billion by 2020
and US$ 200 billion by 2026 from US$ 38.5 billion as of 2017.
 With growing internet penetration, internet users in India are
expected to increase from 429.23 million as of September 2017 to
829 million by 2021.
 Rising internet penetration is expected to lead to growth in
ecommerce.
 India’s internet economy is expected to double from US$125 billion
as of April 2017 to US$ 250 billion by 2020, majorly backed by
ecommerce.
EXECUTIVE SUMMARY
E-Commerce
ADVANTAGE INDIA
For updated information, please visit www.ibef.orgE-Commerce5
ADVANTAGE INDIA
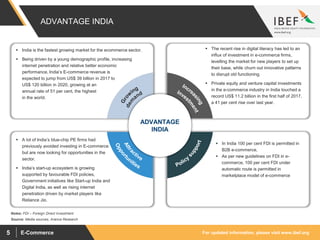
 India is the fastest growing market for the ecommerce sector.
 Being driven by a young demographic profile, increasing
internet penetration and relative better economic
performance, India’s E-commerce revenue is
expected to jump from US$ 39 billion in 2017 to
US$ 120 billion in 2020, growing at an
annual rate of 51 per cent, the highest
in the world.
 The recent rise in digital literacy has led to an
influx of investment in e-commerce firms,
levelling the market for new players to set up
their base, while churn out innovative patterns
to disrupt old functioning.
 Private equity and venture capital investments
in the e-commerce industry in India touched a
record US$ 11.2 billion in the first half of 2017,
a 41 per cent rise over last year.
 In India 100 per cent FDI is permitted in
B2B e-commerce,
 As per new guidelines on FDI in e-
commerce, 100 per cent FDI under
automatic route is permitted in
marketplace model of e-commerce
ADVANTAGE
INDIA
Source: Media sources, Aranca Research
 A lot of India’s blue-chip PE firms had
previously avoided investing in E-commerce
but are now looking for opportunities in the
sector.
 India’s start-up ecosystem is growing
supported by favourable FDI policies,
Government initiatives like Start-up India and
Digital India, as well as rising internet
penetration driven by market players like
Reliance Jio.
Notes: FDI – Foreign Direct Investment
E-Commerce
MARKET OVERVIEW
For updated information, please visit www.ibef.orgE-Commerce7
GROWTH OF E-COMMERCE IN INDIA
14
20
39
50
64
188
200
0
50
100
150
200
250
2014 2015 2017 2018 F 2020 F 2025 F 2026 F
Source: Economic Times, PWC, Financial Express
 Propelled by rising smartphone penetration, the launch of 4G
networks and increasing consumer wealth, the Indian e-commerce
market is expected to grow to US$ 200 billion by 2026 from US$
38.5 billion as of 2017.
 E-commerce is increasingly attracting customers from Tier 2 and 3
cities, where people have limited access to brands but have high
aspirations.
 With the increase in awareness about the benefits of online trading,
there has been a significant rise in investment in E-commerce
business. Hand in hand with offline trading, many established
businesses, e.g. Shoppers Stop or Lifestyle, have setup online
transaction channels.
 Earlier food and grocery were never thought of as items for online
trading. However, with the change of working habits, and consumers
opting for adaptability and convenience, there are now innumerable
small and large E-commerce companies selling provisions and food
items like Grofers, BigBasket, etc.
 India's ecommerce industry's sales rose 40 per cent year-on-year to
reach Rs 9,000 crore (US$ 1.5 billion) during the five-day sale period
ending September 24, 2017, backed by huge deals and discounts
offered by the major ecommerce companies.^
Visakhapatnam port traffic (million tonnes)E-commerce Industry in India (US$ billion)
Notes: *Estimated, F – Forecasted, ^ - as per RedSeer Consulting
For updated information, please visit www.ibef.orgE-Commerce8
RISING INTERNET PENETRATION IN INDIA
4.0%
4.4%
5.1%
7.5%
10.1%
12.6%
15.1%
18.0%
27.0%
34.8%
0.0%
5.0%
10.0%
15.0%
20.0%
25.0%
30.0%
35.0%
40.0%
2007 2008 2009 2010 2011 2012 2013 2014 2015 2016
Source: Economic Times, Live Mint, Aranca Research
 Internet penetration in India grew from just 4 per cent in 2007 to
34.08 per cent in 2016, registering a direct increase of 89 per cent in
2016 over 2007.
 Urban India with an estimated population of 444 million already has
269 million (60 per cent) using the Internet.
 Rural India, with an estimated population of 906 million as per 2011
census, has only 163 million (17 per cent) Internet users. There is
therefore a great opportunity for increasing penetration in the rural
areas.
 Analysis of ‘Daily Users’ reveal that both in Urban and Rural India,
the younger generations are the most prolific users of internet.
 Rising internet penetration is expected to drive ecommerce growth in
India.
Visakhapatnam port traffic (million tonnes)Internet Penetration in India
For updated information, please visit www.ibef.orgE-Commerce9
E-COMMERCE RETAIL MARKET
47%
31%
8%
7%
2%
2%
3%
Electronics Apparel
Home and furnishing Books
Baby products Beauty and personal care
Others
E-commerce retail market by value (2016) The online retail market in India is estimated to be worth US$ 17.8
billion in terms of gross merchandise value (GMV) as of 2017 and is
estimated to increase by 60 per cent to US$ 28-30 billion in 2018.
 Electronics is currently the largest segment in e-commerce in India
with a share of 47 per cent and is expected to grow at a CAGR of 43
per cent by 2020.
 The apparel segment has the second highest share of 31 per cent in
the e-commerce retail industry
 Currently, there are 1-1.2 million transactions per day in e-commerce
retailing.
Source: KPMG Report – E-commerce Retail Logistics India
Notes: CAGR – Compound Annual Growth Rate
For updated information, please visit www.ibef.orgE-Commerce10
ONLINE RETAIL VS TOTAL RETAIL IN INDIA
95%
5%
Offline Retail Online Retail
Online retail out of total retail in India (2020)
97.5%
2.5%
Offline Retail Online Retail
Online retail out of total retail in India (2016)
 There are a lot of opportunities for e-retailers in India to capitalise upon with the gradually growing internet penetration in India.
 The penetration of online retail in India’s total retail market is expected to rise from 2.5 per cent in 2016 to 5 per cent by 2020.
 The online retail market in India increased from US$ 14.5 billion in 2016 to US$ 17.8 billion in 2017 and is estimated to reach US$ 28-30 billion by
2018.
Source: KPMG Report – E-commerce Retail Logistics India
For updated information, please visit www.ibef.orgE-Commerce11
E-COMMERCE RETAIL LOGISTICS MARKET IN INDIA
36%
31%
23%
6%
3%
1%
Apparels Electronics
Home furnishing Baby products
Books Others
38%
29%
15%
9%
7% 1%
1%
Apparels Electronics
Home furnishing Baby products
Books Beauty and personal care
Others
 Logistics is a major driver of the e-commerce retail industry and is an important point of differentiation between market players aiming at better
customer satisfaction and service.
 The logistics sector pertaining to the e-commerce industry in India stood at US$ 460 million in 2016 and is expected to grow at a CAGR of 48 per
cent to reach US$ 2.2 billion by 2020.
Source: KPMG Report – E-commerce Retail Logistics India
Notes: CAGR – Compound Annual Growth Rate
E-commerce retail logistics market in India(2020)E-commerce retail logistics market in India (2016)
For updated information, please visit www.ibef.orgE-Commerce12
E-TAILING MARKET BY BUSINESS MODEL
E-Commerce
Marketplace Model
 Marketplace model adheres to the standards and directions of a
zero inventory model. For example, Naaptol, eBay and Shopclues.
 The e-commerce marketplace becomes a digital platform for
consumers and merchants without warehousing the products.
Marketplaces do offer shipment, delivery and payment help to
merchants by tying up with some selected logistics companies and
financial institutions.
 The new FDI policy rules and regulations in the e-commerce
market have permitted 100 percent FDI in the e-commerce
marketplace model under the automatic route.
Inventory-led Model
 Inventory led models are those shopping websites where online
buyers choose from among products owned by the online
shopping company or shopping website take care of the whole
process end-to-end, starting with product purchase, warehousing
and ending with product dispatch.
 A few examples of such are Jabong, Yepme and LatestOne.com.
Source: PWC
For updated information, please visit www.ibef.orgE-Commerce13
PRIVATE INVESTMENTS IN E-COMMERCE
 Venture capital (VC)-backed firms in India raised a record US$ 9.6 billion of fresh capital between January-September 2017, which is more than
twice the amount of capital raised during the same period in 2016.
 The first half of 2017 recorded 26 start-up funding deals of value US$ 100 million and above, aggregating to US$ 7.7 billion and accounting for 68
per cent of investments during the period.
Company Investor Funding (US$ million)
Flipkart SoftBank 2,500
Capital Float Ribbit Capital, SAIF Partners, Sequoia India 45
Bank Bazaar Experian Plc 30
Droom Asset Management (Asia) Ltd, Digital Garage Inc 20
1 mg
HBM Healthcare Investments, Maverick Capital Ventures, Sequoia India,
Omidyar Network and Kae Capital
15
Gozefo Sequoia Capital India, Helion Venture Partners and Beenext Pte Ltd 9
Jumbotail Kalaari Capital, Nexus India Capital Advisors 8.5
Blackbuck InnoVen Capital 7.7
KartRocket.com Bertelsmann India Investments, Nirvana Digital India Fund 4.1
The Label Life Kalpavriksh, Centrum group’s maiden private equity (PE) fund 3.1
Chumbak Blacksoil Capital Pvt. Ltd 1.7
MFine Stellaris Venture Partners, Mayur Abhaya, Rohit M.A 1.5
Funding Activities (As of December 2017)
Source: Media sources, Aranca Research
For updated information, please visit www.ibef.orgE-Commerce14
KEY PLAYERS
For updated information, please visit www.ibef.orgE-Commerce15
PORTER’S FIVE FORCES FRAMEWORK ANALYSIS
 Low – Bargaining power of suppliers
is low as there are many suppliers in
the market, and therefore the
ecommerce companies have the
power to choose their suppliers.
Bargaining Power of Suppliers
 High – Threat of substitutes is high as
there are a lot of sellers with similar
products and services; and there is no
switching cost for customers.
Threat of Substitutes
 High – Competition among major
players is very high, as there is no
switching cost for customers. The
players are constantly competing on
the basis on price as well as other
factors that influence buyers’ choice
like quick delivery, discounts and
offers, variety, customer service etc.
Competitive Rivalry
 High – Threat of new entrants is high,
as there is very little cost involved in
setting up an ecommerce website.
Threat of New Entrants
 High – Bargaining power of
customers is very high as there are
many players in the market with
similar products and there is no
switching cost. Buyers prefer the
company that offers the best price
among other factors.
Bargaining Power of Buyers
Positive Impact
Neutral Impact
Negative Impact
E-Commerce
STRATEGIES
ADOPTED
For updated information, please visit www.ibef.orgE-Commerce17
 E-commerce companies are gradually expanding to different cities, regions and even countries. They are also
expanding their product range to cater to a larger amount of people.
 In May 2017, Uber launched UberEats, an on-demand food delivery app in India
 As of July 29, 2017 Amazon India has pledged US$ 500 million for the expansion of its food retail business in
India.
 Paytm Mall, ecommerce platform of Paytm, is planning to expand its groceries segment and is targeting a
Gross Merchandise Value (GMV) of US$ 3 billion from this segment by the end of 2018.
 One of the biggest advantage of E-commerce is that along with the core product or service it can also provide
numerous ancillary services without having to invest a lot.
 Amazon India introduced one day delivery guarantee on purchases for a nominal fee. Flipkart started with
same day guarantee in 2013 too.
 Flipkart introduced its own payment gateway Payzippy and also, its own logistics and supply chain firm Ekart.
 E-commerce websites are also introducting e-Wallet services; for example - Amazon’s Pay Balance.
 Site visitors demand one-of-a-kind experiences that cater to their needs and interests. Technology is
available, even to smaller players, to capture individual shoppers’ interests and preferences and generate a
product selection and shopping experience led by individualised promotions tailored to them.
 Many E-commerce websites provide personalised experience to customers to cater to their needs and
interests depending upon their location, choices, products they like or buy, websites they visit etc.
 This strategy has helped companies to know customers’ demands better and serve them accordingly.
 E-commerce companies are increasingly adopting subscription model to provide extra benefits and tailored
services to customers to suit their needs.
 Amazon introduced Amazon Prime, a subscription based service for Amazon customers, in 2016. members of
Amazon Prime could avail early access to selected deals, free one day delivery and other benefits. Amazon
Prime subscribers in India stood at around 5-6 million as of December 2016
 In 2014, Flipkart introduced Flipkart First, a premium subscription based services wherein a customer gets
free delivery, discounted same day delivery, priority customer service etc.
STRATEGIES ADOPTED
Expansion
Ancillary services
Personalised
Experience
Subscription for
ecommerce
Source: Media sources, Company websites, Aranca Research
E-Commerce
GROWTH DRIVERS
AND OPPORTUNITIES
For updated information, please visit www.ibef.orgE-Commerce19
GROWTH DRIVERS FOR E-COMMERCE
Growth
drivers
Increasing
awareness
Investment
Government
initiatives
 Government initiatives like
Digital India are constantly
introducing people to online
modes of commerce.
 Favourable FDI policy is
attracting key players.
 Increasing FDI inflows,
domestic investment, support
from key industrial players is
helping in the growth of e-
commerce.
 As the awareness of using internet is
increasing, more and more people
are being drawn to E-commerce.
 Whether it be sellers, buyers, users
or investors, people have started
getting used to online mode or
commerce.
Source: Aranca Research
For updated information, please visit www.ibef.orgE-Commerce20
 Number of online shoppers is expected to go up to 175 million by 2020.
 Mobile-savvy shoppers are the backbone of India’s online shopping industry.
 Men in India are more avid shoppers than women in part because of demographic and cultural differences.
 Discounts, added with a comfort of sitting at home and purchasing, is an effective driving factor of E-
commerce. Availability of various websites gives customers a lot of options to choose from.
 Chatbots and personal assistance apps have made transactions seamless.
 One can get several brands and products from different sellers at one place. Also, one can get in on the latest
international trends without spending money on travel; you can shop from retailers in other parts of the
country or even the world without being limited by geographic area.
 Metro cities like Bengaluru, Mumbai, and Delhi, with population greater than 100,000, accounted for most
online shopping in absolute numbers.
 Less densely populated regions generated a larger proportion of online sales. Nearly 60 per cent of
Snapdeal’s purchases came from cities classified as tier II and III.
 Flipkart also noted that “sales of branded products across categories saw a sharp increase, as more of tier 2
and tier 3 Indian towns took to shopping online.”
 Although shoppers between 25 and 34 years of age were most active on e-commerce portals, a surprising
number of older people also shopped online in 2016.
 However, the age group of 15-34 years are the major consumers of E-commerce.
 The popularity of web series among millenials is growing immensely.
DEMOGRAPHIC FACTORS
Online Shoppers
Convenience of E-
commerce
Tier II and Tier III cities
provide major sales
Millennials are the most
active
Source: Economic Times, Media sources, Aranca Research
For updated information, please visit www.ibef.orgE-Commerce21
 Web content search in Hindi grew by 155 per cent in 2015 whereas that through mobile internet grew by 300 per cent in
the same period.
 In a move to grab the opportunity, Snapdeal and Make My Trip had launched their apps in Hindi and a few other
vernacular languages in 2014.
 Online retailers see this emergent segment as a new growth driver as the incremental growth in mobile subscribers can
be credited mainly to people who are comfortable with languages other than English.
 Consumer demand can be seen increasing even in small towns and cities.
 Less densely populated regions generated a larger proportion of online sales. Nearly 60 per cent of Snapdeal’s
purchases came from cities classified as tier II and III.
 Flipkart also noted that “sales of branded products across categories saw a sharp increase, as more of tier 2 and tier 3
Indian towns took to shopping online.”
 Online retailers’ growing reach in town and cities beyond metros is driven by an increasing in usage of mobile internet in
the country. Increased ownership of smartphones is helping more Indians access shopping websites easily.
 Rise in smartphone usage is expected to reach 50 per cent penetration by 2020.
FACTORS DRIVING E-COMMERCE GROWTH… (1/2)
Internet content in local
languages
Growth in non-metro
cities
Mobile Commerce
Source: Media sources, Aranca Research
For updated information, please visit www.ibef.orgE-Commerce22
 A net addition of nearly 140 million debit cards has been recorded in the country in the past few years. Usage of debit
cards at points of sale terminal has increased by 86 per cent during the same period. This clearly reflects that people are
getting comfortable with using debit cards for activities other than withdrawals at ATM.
 Many online retails insist use of debit cards for high value transactions, this is however a welcome change. This will help
e-tailers to increase their reach.
 Digital payments will act as a game changer for the domestic e-commerce business and the current trend of dominance
of Cash-on-delivery would be reversed in the next five years, as per Mr Sachin Bansal, Executive Chairman, Flipkart.
 Online retailers now deliver to “12,500-15,000 pin codes” out of nearly 100,000 pin codes in the country.
 With logistics and warehouses attracting an estimated investment of nearly US$2 billion by 2020, the reach of online
retailers to remote locations is set to increase.
FACTORS DRIVING E-COMMERCE GROWTH… (2/2)
Cashless Transactions
Growth of logistics and
warehouses.
Source: Media sources, Aranca Research
 Amazon has launched an online Business-to-Business (B2B) market place in India where small and medium enterprises
(SMEs) can buy products.
 Metro Cash and Carry, Germany-based, B2B retail store chain, is planning to start e-commerce solutions for its B2B
business in India by the end of 2017.
 Power2SME, one of the largest B2B online marketplaces in India that provides raw materials to small and medium
enterprises (SMEs), has raised US$ 36 million from Inventus Capital, Accel Partners and others in September 2017,
which will be used towards technology, sales, marketing and geographic expansion.
B2B ecommerce
 Chinese phone manufacturer, Xiaomi Corporation, is planning to invest about US$ 1 billion in 100 Indian start-ups over
the coming five years, with an aim to make an ecosystem of apps surrounding its smartphone brand.
 US-based ecommerce giant, Amazon, has invested about US$ 1 billion in its Indian arm so far in 2017, taking its total
investment in its business in India to US$ 2.7 billion.
Increasing Investments
For updated information, please visit www.ibef.orgE-Commerce23
GROWTH OF INTERNET USERS
46.59
52.43
62.16
92.32
125.61
158.96
193.20
233.15
375.00
432.00
429.23
700.00
829.00
0.00
100.00
200.00
300.00
400.00
500.00
600.00
700.00
800.00
900.00
Source: Economic Times, Live Mint
 The number of Internet users in India is 429.23 million as of
September 2017, growing at a CAGR of approximately 22.4 per cent
in the last decade.
 77 per cent of urban users and 92 per cent of rural users consider
mobile as the primary device for accessing the internet, largely
driven by availability and affordability of smartphones.
 In urban India, the Internet user base stood at 299.83 million as of
September 2017.
 Rural India’s internet user base stood at 129.41 million as of
September 2017.
Visakhapatnam port traffic (million tonnes)Internet Users in India (million)
Notes: *as of September 2017
CAGR 22.4%
For updated information, please visit www.ibef.orgE-Commerce24
INCREASE IN MOBILE SHIPMENTS DRIVING E-
COMMERCE GROWTH
India’s Smartphone Shipments (millions)
8.0
14.5
17.5
42.5
79.5
102.0
108.0
92.5
0
20
40
60
80
100
120
2010
2011
2012
2013
2014
2015
2016
2017*
 The proliferation of mobile devices combined with internet access via
affordable broadband solutions and mobile data is a key factor
driving the tremendous growth in India’s e-commerce sector.
 Smartphone shipments in India stood at 27 million units in the first
quarter of 2017 and 28 million units in the second quarter of 2017, 40
million units in the third quarter, taking the total shipments to
92.5million units in 2017.*
 The overall smartphone shipment is expected to reach nearly 1.6
billion units in 2017.
 Mobile platforms have emerged as a major gateway for customer
purchases as smartphones are increasingly replacing PCs for online
shopping.
 Offline brands have now started focusing on online channels as well
to gain extra market share.
 65 per cent of the people who shop online, do so using their mobile
phones.
 Smartphone users in India are expected to reach 700 million by
2020.
 India's mobile wallet industry is estimated to grow at a compound
annual growth rate (CAGR) of 148 per cent to reach US$ 4.4 billion
by 2022. ^
Source: IMF, World Bank, International Data Corporation (IDC)
Notes: * As of September 2017, ^ - 'World Payment Report 2017' by Capgemini.
For updated information, please visit www.ibef.orgE-Commerce25
GOVERNMENT INITIATIVES IN E-COMMERCE
 Since 2014, the Government of India has announced various initiatives namely, Digital India, Make in India, Start-up India, Skill India and
Innovation Fund. The timely and effective implementation of such programsmes will likely support the e-commerce growth in the country.
 In the Union Budget of 2017-18, government has allocated US$ 1.55 billion to BharatNet Project, announcing availability of high speed broadband
connectivity on optical fibre and accessibility of wifi hot spots and digital services at low tariffs in more than 150,000 gram panchayats, by the end
of 2017-18.
 In December 2017, the Department of Industrial Policy and Promotion (DIPP) is planning to release the index to rank Indian states based on the
start-up ecosystem and the measures undertaken to promote start-ups in the states.
 Finance Minister Mr Arun Jaitley has proposed various measures to quicken India's transition to a cashless economy, including a ban on cash
transactions over Rs 300,000 (US$ 4,655.1), tax incentives for creation of a cashless infrastructure, promoting greater usage of non-cash modes
of payments, and making Aadhaar-based payments more widespread.
 Government announced the launch of BHIM app. It will help increase digital payments in the country. BHIM app has been adopted by 12.5 million
so far. The Government will launch two new schemes to promote the usage of BHIM; these are, Referral Bonus Scheme for individuals and a
Cashback Scheme for merchants.
 Under the Digital India movement, government launched various initiatives like Udaan, Umang, StartUp India Portal etc.
 The recent announcement of GST roll out, another significant reform would help e-retail competitors streamline their supply chain and simplify
their tax structure, while rationalising seamless integration of goods and services across the country. Moreover it will eliminate the dual taxes
being imposed on the current ecommerce eco system.
 The Reserve Bank of India (RBI) has instructed banks and companies to make all know-your-customer (KYC)-compliant prepaid payment
instruments (PPIs), like mobile wallets, interoperable amongst themselves via Unified Payments Interface (UPI) by April 2018.
 In order to increase the participation of foreign players in the e-commerce field, the Indian Government hiked the limit of foreign direct investment
(FDI) in the E-commerce marketplace model for up to 100 per cent (in B2B models).
 The Government of India has distributed rewards worth around Rs 153.5 crore (US$ 23.8 million) to 1 million customers for embracing digital
payments, under the Lucky Grahak Yojana and Digi-Dhan Vyapar Yojana.
Source: Union Budget 2017-18, Media sources, Aranca Research
E-Commerce
CASE STUDIES
For updated information, please visit www.ibef.orgE-Commerce27
FLIPKART: OVERVIEW
11
20
150
360
1,910
700
3,900
-
500
1,000
1,500
2,000
2,500
3,000
3,500
4,000
4,500
2009 2011 2012 2013 2014 2015 2017*
Source: Economic Times, Flipkart, Business Line, Aranca Research
 Flipkart, an Indian E-Commerce company, started in October 2007
and is currently headquartered in Bengaluru.
 Flipkart was started by Sachin Bansal and Binny Bansal and as of
March 2017, has 8000 permanent employees and 20000-25000
contract workers who form part of its supply chain.
 Flipkart is the market leader in India’s online marketplace with over
80 million products across more than 80 categories.
 Since 2009, Flipkart, valued at US$ 11.6 billion as of April 2017, has
raised over US$4 billion in 11 funding rounds. American investment
firm Tiger Global participated in nine of them.
 Flipkart boasts of having 100 million users and 100 thousand sellers
along with 21 warehouses.
 On average, Flipkart has around 8 million shipments per month.
 In 2016, Flipkart became the first Indian App to cross 50 million
users.
 In April 2017, Flipkart raised US$ 1.4 billion from Microsoft, eBay
and Tencent and in August 2017, it raised US$ 2.5 billion from
SoftBank.
 In exchange of an equity stake in Flipkart, eBay made a cash
investment of US$ 500 million and sold its eBay.in business to
Flipkart, in 2017.
 Flipkart invested US$ 400 million in its logistics arm, eKart, between
September-December 2017.
Visakhapatnam port traffic (million tonnes)Flipkart’s funding (US$ million)
Notes: *As of August 2017
For updated information, please visit www.ibef.orgE-Commerce28
EVOLUTION OF FLIPKART
2007 2008-09 2012-132010-11 2014-15 2016 onwards
 Founded in October 2007
by Sachin Bansal and Binny
Bansal with an investment
of mere US$ 6,200.
 Introduces music, movies and mobiles.
 Launches cash on delivery, card on delivery and
prepaid wallet to store money online.
 Introduces 30 day replacement guarantee and
also, a dedicated logistics for faster delivery.
 Receives funding from Tiger Global of US$ 20
million in March 2011.
 Company valued at US$ 1 billion
 Acquires Myntra for US$ 300 million.
 Raises US$ 210 million from DST Global.
 Receives a whopping US$ 1 billion funding from GIC Singapore and
existing investors.
 Raises US$ 700 million, in 2014, from hedge funds like Greenoaks,
Steadview Capital, Qatar Investment Authority and T. Rowe Price and
the same amount from existing investors in 2015.
 Valuation shots up to US$ 15.5 billion.
 Flipkart went online as a book retailer.
 Ashish Gupta, founder of Junglee and Helion
Venture Partners funds Flipkart initially.
 Receives it’s first funding in 2009 of US$ 1
million from Accel Partners and US$ 20
million from Tiger Global.
 Company valued at US$ 50 million.
 Launches lifestyle and fashion products
 Launches payment gateway Payzippy.
 Becomes a unicorn startup in 2012. Announces
US$ 150 million round led by South African tech
major Naspers.
 Raises US$ 200 million from existing investors
and US$ 160 million from Morgan Stanley, Sofina,
Vulcan Capital and Dragoneer.
 Valued at US$ 1.6 billion
 Crosses 100 million registered users.
 Raises US$ 1.4 billion from Tencent, Microsoft and
eBay, in 2017
 As of April 2017, receives valuation of US$ 11.6
billion.
 In August 2017, completes merger with eBay India.
 Receives US$ 2.5 billion in funding from SoftBank
in August 2017.
 In November 2017 Flipkart,launched its own
smartphone brand ‘Billion Capture +’
Source: Financial Express, Company website, Aranca Research
E-Commerce
INDUSTRY
ASSOCIATIONS
For updated information, please visit www.ibef.orgE-Commerce30
KEY INDUSTRY ASSOCIATIONS
e-Commerce Association of India
Address: 111/112, Ascot Centre, Near Hotel ITC Maratha,
Sahar Road, Sahar, Andheri (E)
Mumbai – 400099
Phone: +91 22 28269527 - 29
Fax: +91 22 28269536
E-mail: info@rai.net.in
Address: 122, 1st Floor, Devika Tower
Corporate Business District, Nehru Place
New Delhi –110 019
Phone: +91 011 41582722
Fax : +91 011 41582722
Email: info@ecai.co.in
Retailers Association of India (RAI)
E-Commerce
USEFUL
INFORMATION
For updated information, please visit www.ibef.orgE-Commerce32
GLOSSARY
 CAGR: Compound Annual Growth Rate
 GMV – Gross Merchandise Value
 FDI: Foreign Direct Investment
 FY: Indian Financial Year (April to March)
 GOI: Government of India
 INR: Indian Rupee
 US$: US Dollar
 Wherever applicable, numbers have been rounded off to the nearest whole number
For updated information, please visit www.ibef.orgE-Commerce33
EXCHANGE RATES
Exchange Rates (Fiscal Year) Exchange Rates (Calendar Year)
Year INR INR Equivalent of one US$
2004–05 44.81
2005–06 44.14
2006–07 45.14
2007–08 40.27
2008–09 46.14
2009–10 47.42
2010–11 45.62
2011–12 46.88
2012–13 54.31
2013–14 60.28
2014-15 61.06
2015-16 65.46
2016-17 67.09
Q1 2017-18 64.46
Q2 2017-18 64.09
Q3 2017-18 64.74
Year INR Equivalent of one US$
2005 43.98
2006 45.18
2007 41.34
2008 43.62
2009 48.42
2010 45.72
2011 46.85
2012 53.46
2013 58.44
2014 61.03
2015 64.15
2016 67.21
2017 65.12
For updated information, please visit www.ibef.orgE-Commerce34
DISCLAIMER
India Brand Equity Foundation (IBEF) engaged Aranca to prepare this presentation and the same has been prepared by Aranca in consultation
with IBEF.
All rights reserved. All copyright in this presentation and related works is solely and exclusively owned by IBEF. The same may not be reproduced,
wholly or in part in any material form (including photocopying or storing it in any medium by electronic means and whether or not transiently or
incidentally to some other use of this presentation), modified or in any manner communicated to any third party except with the written approval
of IBEF.
This presentation is for information purposes only. While due care has been taken during the compilation of this presentation to ensure that the
information is accurate to the best of Aranca and IBEF’s knowledge and belief, the content is not to be construed in any manner whatsoever as a
substitute for professional advice.
Aranca and IBEF neither recommend nor endorse any specific products or services that may have been mentioned in this presentation and nor do
they assume any liability or responsibility for the outcome of decisions taken as a result of any reliance placed on this presentation.
Neither Aranca nor IBEF shall be liable for any direct or indirect damages that may arise due to any act or omission on the part of the user due to any
reliance placed or guidance taken from any portion of this presentation.

More Related Content

What's hot

State of Ecommerce Marketing, 2014
State of Ecommerce Marketing, 2014State of Ecommerce Marketing, 2014
State of Ecommerce Marketing, 2014HubSpot
 
50 Compelling Statistics on Global eCommerce
50 Compelling Statistics on Global eCommerce  50 Compelling Statistics on Global eCommerce
50 Compelling Statistics on Global eCommerce PromptCloud
 
Overview of E-commerce in The Middle East
Overview of E-commerce in The Middle EastOverview of E-commerce in The Middle East
Overview of E-commerce in The Middle EastMohammad Hijazi
 
E-commerce in fashion industry
E-commerce in fashion industryE-commerce in fashion industry
E-commerce in fashion industryDivante
 
Global eCommerce Trends - Archanaa John
Global eCommerce Trends - Archanaa JohnGlobal eCommerce Trends - Archanaa John
Global eCommerce Trends - Archanaa JohnArchanaa John
 
eCommerce trends 2019 by Divante.co
eCommerce trends 2019 by Divante.coeCommerce trends 2019 by Divante.co
eCommerce trends 2019 by Divante.coDivante
 
Ecommerce trends in 2015 - What to expect
Ecommerce trends in 2015 - What to expectEcommerce trends in 2015 - What to expect
Ecommerce trends in 2015 - What to expectNiclas Winroth
 
E-COMMERCE AND THE FUTURE OF RETAIL: 2015
E-COMMERCE AND THE FUTURE OF RETAIL: 2015E-COMMERCE AND THE FUTURE OF RETAIL: 2015
E-COMMERCE AND THE FUTURE OF RETAIL: 2015Cooper Smith
 
eCommerce Trends 2016-2017
eCommerce Trends 2016-2017eCommerce Trends 2016-2017
eCommerce Trends 2016-2017Divante
 
E commerce market in india 2017- Sample
E commerce market in india 2017- SampleE commerce market in india 2017- Sample
E commerce market in india 2017- SampleNetscribes, Inc.
 
E tailingindia webinar-ecommerce-opportunities
E tailingindia webinar-ecommerce-opportunitiesE tailingindia webinar-ecommerce-opportunities
E tailingindia webinar-ecommerce-opportunitieseTailing India
 
The e commerce imperative online version
The e commerce imperative online versionThe e commerce imperative online version
The e commerce imperative online versionVarun Luthra
 
ONLINE RETAILING OF FASHION CLOTHING
ONLINE RETAILING OF FASHION CLOTHINGONLINE RETAILING OF FASHION CLOTHING
ONLINE RETAILING OF FASHION CLOTHINGPrashant Kumar
 
eCommerce handbook 2017 - Mexican Market Insights
eCommerce handbook 2017 - Mexican Market InsightseCommerce handbook 2017 - Mexican Market Insights
eCommerce handbook 2017 - Mexican Market InsightsJuan Saldívar v. Wuthenau
 
The Future Of Online Retail - For Fashion Businesses
The Future Of Online Retail - For Fashion BusinessesThe Future Of Online Retail - For Fashion Businesses
The Future Of Online Retail - For Fashion Businessespaulmc74
 
Country spotlight: India
Country spotlight: India Country spotlight: India
Country spotlight: India StarTrack
 

What's hot (20)

State of Ecommerce Marketing, 2014
State of Ecommerce Marketing, 2014State of Ecommerce Marketing, 2014
State of Ecommerce Marketing, 2014
 
50 Compelling Statistics on Global eCommerce
50 Compelling Statistics on Global eCommerce  50 Compelling Statistics on Global eCommerce
50 Compelling Statistics on Global eCommerce
 
Overview of E-commerce in The Middle East
Overview of E-commerce in The Middle EastOverview of E-commerce in The Middle East
Overview of E-commerce in The Middle East
 
E-commerce in fashion industry
E-commerce in fashion industryE-commerce in fashion industry
E-commerce in fashion industry
 
Global eCommerce Trends - Archanaa John
Global eCommerce Trends - Archanaa JohnGlobal eCommerce Trends - Archanaa John
Global eCommerce Trends - Archanaa John
 
eCommerce trends 2019 by Divante.co
eCommerce trends 2019 by Divante.coeCommerce trends 2019 by Divante.co
eCommerce trends 2019 by Divante.co
 
2015 - eCommerce AJ
2015 - eCommerce AJ2015 - eCommerce AJ
2015 - eCommerce AJ
 
Ecommerce trends in 2015 - What to expect
Ecommerce trends in 2015 - What to expectEcommerce trends in 2015 - What to expect
Ecommerce trends in 2015 - What to expect
 
E-COMMERCE AND THE FUTURE OF RETAIL: 2015
E-COMMERCE AND THE FUTURE OF RETAIL: 2015E-COMMERCE AND THE FUTURE OF RETAIL: 2015
E-COMMERCE AND THE FUTURE OF RETAIL: 2015
 
3458590
34585903458590
3458590
 
Latest business trends in e commerce market
Latest business trends in e commerce marketLatest business trends in e commerce market
Latest business trends in e commerce market
 
eCommerce Trends 2016-2017
eCommerce Trends 2016-2017eCommerce Trends 2016-2017
eCommerce Trends 2016-2017
 
E commerce tendencies
E commerce tendenciesE commerce tendencies
E commerce tendencies
 
E commerce market in india 2017- Sample
E commerce market in india 2017- SampleE commerce market in india 2017- Sample
E commerce market in india 2017- Sample
 
E tailingindia webinar-ecommerce-opportunities
E tailingindia webinar-ecommerce-opportunitiesE tailingindia webinar-ecommerce-opportunities
E tailingindia webinar-ecommerce-opportunities
 
The e commerce imperative online version
The e commerce imperative online versionThe e commerce imperative online version
The e commerce imperative online version
 
ONLINE RETAILING OF FASHION CLOTHING
ONLINE RETAILING OF FASHION CLOTHINGONLINE RETAILING OF FASHION CLOTHING
ONLINE RETAILING OF FASHION CLOTHING
 
eCommerce handbook 2017 - Mexican Market Insights
eCommerce handbook 2017 - Mexican Market InsightseCommerce handbook 2017 - Mexican Market Insights
eCommerce handbook 2017 - Mexican Market Insights
 
The Future Of Online Retail - For Fashion Businesses
The Future Of Online Retail - For Fashion BusinessesThe Future Of Online Retail - For Fashion Businesses
The Future Of Online Retail - For Fashion Businesses
 
Country spotlight: India
Country spotlight: India Country spotlight: India
Country spotlight: India
 

Similar to Ecommerce Sector Report January 2018

Term paper on role of e commerce in india
Term paper on role of e commerce in indiaTerm paper on role of e commerce in india
Term paper on role of e commerce in indiaSubhadeep Roy
 

Similar to Ecommerce Sector Report January 2018 (20)

Ecommerce Sector Report December 2017
Ecommerce Sector Report December 2017Ecommerce Sector Report December 2017
Ecommerce Sector Report December 2017
 
Ecommerce Sector Report - April 2018
Ecommerce Sector Report - April 2018Ecommerce Sector Report - April 2018
Ecommerce Sector Report - April 2018
 
Ecommerce Sector Report April 2018
Ecommerce Sector Report April 2018Ecommerce Sector Report April 2018
Ecommerce Sector Report April 2018
 
Ecommerce Sector Report March 2018
Ecommerce Sector Report March 2018Ecommerce Sector Report March 2018
Ecommerce Sector Report March 2018
 
Ecommerce Sector Report February 2018
Ecommerce Sector Report February 2018Ecommerce Sector Report February 2018
Ecommerce Sector Report February 2018
 
Ecommerce Sector Report October 2017
Ecommerce Sector Report October 2017Ecommerce Sector Report October 2017
Ecommerce Sector Report October 2017
 
Ecommerce Sector Report September 2017
Ecommerce Sector Report September 2017Ecommerce Sector Report September 2017
Ecommerce Sector Report September 2017
 
Ecommerce Sector Report May 2018
Ecommerce Sector Report May 2018Ecommerce Sector Report May 2018
Ecommerce Sector Report May 2018
 
Ecommerce Sector Report - July 2018
Ecommerce Sector Report - July 2018Ecommerce Sector Report - July 2018
Ecommerce Sector Report - July 2018
 
Ecommerce Sector Report June 2018
Ecommerce Sector Report June 2018Ecommerce Sector Report June 2018
Ecommerce Sector Report June 2018
 
Ecommerce Sector Report July 2017
Ecommerce Sector Report July 2017Ecommerce Sector Report July 2017
Ecommerce Sector Report July 2017
 
E Commerce Sector Report - August 2018
E Commerce Sector Report - August 2018E Commerce Sector Report - August 2018
E Commerce Sector Report - August 2018
 
E Commerce Sector Report - November 2018
E Commerce Sector Report - November 2018E Commerce Sector Report - November 2018
E Commerce Sector Report - November 2018
 
E Commerce Sector Report - January 2019
E Commerce Sector Report - January 2019E Commerce Sector Report - January 2019
E Commerce Sector Report - January 2019
 
E Commerce Sector Report - February 2019
E Commerce Sector Report - February 2019E Commerce Sector Report - February 2019
E Commerce Sector Report - February 2019
 
E Commerce Sector Report - December 2018
E Commerce Sector Report - December 2018E Commerce Sector Report - December 2018
E Commerce Sector Report - December 2018
 
E Commerce Sector Report - March 2019
E Commerce Sector Report - March 2019E Commerce Sector Report - March 2019
E Commerce Sector Report - March 2019
 
E Commerce Sector Report - April 2019
E Commerce Sector Report - April 2019E Commerce Sector Report - April 2019
E Commerce Sector Report - April 2019
 
Term paper on role of e commerce in india
Term paper on role of e commerce in indiaTerm paper on role of e commerce in india
Term paper on role of e commerce in india
 
E-Commerce-January-2021.pdf
E-Commerce-January-2021.pdfE-Commerce-January-2021.pdf
E-Commerce-January-2021.pdf
 

More from India Brand Equity Foundation

Engineering and Capital Goods Sector Report - April 2019
Engineering and Capital Goods Sector Report - April 2019Engineering and Capital Goods Sector Report - April 2019
Engineering and Capital Goods Sector Report - April 2019India Brand Equity Foundation
 
Agriculture and Allied Industries Sector Report - April 2019
Agriculture and Allied Industries Sector Report - April 2019Agriculture and Allied Industries Sector Report - April 2019
Agriculture and Allied Industries Sector Report - April 2019India Brand Equity Foundation
 

More from India Brand Equity Foundation (20)

Tamil Nadu State report - April 2019
Tamil Nadu State report - April 2019Tamil Nadu State report - April 2019
Tamil Nadu State report - April 2019
 
Steel Sector Report - April 2019
Steel Sector Report - April 2019Steel Sector Report - April 2019
Steel Sector Report - April 2019
 
Services Sector Report - April 2019
Services Sector Report - April 2019Services Sector Report - April 2019
Services Sector Report - April 2019
 
Real Estate Sector Report - April 2019
Real Estate Sector Report - April 2019Real Estate Sector Report - April 2019
Real Estate Sector Report - April 2019
 
Rajasthan State Report - April 2019
Rajasthan State Report - April 2019Rajasthan State Report - April 2019
Rajasthan State Report - April 2019
 
Railways Sector Report April 2019
Railways Sector Report April 2019Railways Sector Report April 2019
Railways Sector Report April 2019
 
Power Sector Report - April 2019
Power Sector Report - April 2019Power Sector Report - April 2019
Power Sector Report - April 2019
 
Nagaland State Report - April 2019
Nagaland State Report - April 2019Nagaland State Report - April 2019
Nagaland State Report - April 2019
 
Meghalaya State Report April 2019
Meghalaya State Report April 2019Meghalaya State Report April 2019
Meghalaya State Report April 2019
 
Infrastructure Sector Report - April 2019
Infrastructure Sector Report - April 2019Infrastructure Sector Report - April 2019
Infrastructure Sector Report - April 2019
 
Media and Entertainment Sector report - April 2019
Media and Entertainment Sector report - April 2019Media and Entertainment Sector report - April 2019
Media and Entertainment Sector report - April 2019
 
Manufacturing Sector Report - April 2019
Manufacturing Sector Report - April 2019Manufacturing Sector Report - April 2019
Manufacturing Sector Report - April 2019
 
Manipur State Report - April 2019
Manipur State Report - April 2019Manipur State Report - April 2019
Manipur State Report - April 2019
 
Himachal Pradesh State Report - April 2019
Himachal Pradesh State Report - April 2019Himachal Pradesh State Report - April 2019
Himachal Pradesh State Report - April 2019
 
Gujarat State Report - April 2019
Gujarat State Report - April 2019Gujarat State Report - April 2019
Gujarat State Report - April 2019
 
Gems and Jewellery Sector Report - April 2019
Gems and Jewellery Sector Report - April 2019Gems and Jewellery Sector Report - April 2019
Gems and Jewellery Sector Report - April 2019
 
Engineering and Capital Goods Sector Report - April 2019
Engineering and Capital Goods Sector Report - April 2019Engineering and Capital Goods Sector Report - April 2019
Engineering and Capital Goods Sector Report - April 2019
 
Delhi State Report - April 2019
Delhi State Report - April 2019Delhi State Report - April 2019
Delhi State Report - April 2019
 
Chhattisgarh State Report - April 2019
Chhattisgarh State Report - April 2019Chhattisgarh State Report - April 2019
Chhattisgarh State Report - April 2019
 
Agriculture and Allied Industries Sector Report - April 2019
Agriculture and Allied Industries Sector Report - April 2019Agriculture and Allied Industries Sector Report - April 2019
Agriculture and Allied Industries Sector Report - April 2019
 

Recently uploaded

The Core Functions of the Bangko Sentral ng Pilipinas
The Core Functions of the Bangko Sentral ng PilipinasThe Core Functions of the Bangko Sentral ng Pilipinas
The Core Functions of the Bangko Sentral ng PilipinasCherylouCamus
 
Interimreport1 January–31 March2024 Elo Mutual Pension Insurance Company
Interimreport1 January–31 March2024 Elo Mutual Pension Insurance CompanyInterimreport1 January–31 March2024 Elo Mutual Pension Insurance Company
Interimreport1 January–31 March2024 Elo Mutual Pension Insurance CompanyTyöeläkeyhtiö Elo
 
《加拿大本地办假证-寻找办理Dalhousie毕业证和达尔豪斯大学毕业证书的中介代理》
《加拿大本地办假证-寻找办理Dalhousie毕业证和达尔豪斯大学毕业证书的中介代理》《加拿大本地办假证-寻找办理Dalhousie毕业证和达尔豪斯大学毕业证书的中介代理》
《加拿大本地办假证-寻找办理Dalhousie毕业证和达尔豪斯大学毕业证书的中介代理》rnrncn29
 
Call Girls Near Delhi Pride Hotel, New Delhi|9873777170
Call Girls Near Delhi Pride Hotel, New Delhi|9873777170Call Girls Near Delhi Pride Hotel, New Delhi|9873777170
Call Girls Near Delhi Pride Hotel, New Delhi|9873777170Sonam Pathan
 
Stock Market Brief Deck FOR 4/17 video.pdf
Stock Market Brief Deck FOR 4/17 video.pdfStock Market Brief Deck FOR 4/17 video.pdf
Stock Market Brief Deck FOR 4/17 video.pdfMichael Silva
 
The Triple Threat | Article on Global Resession | Harsh Kumar
The Triple Threat | Article on Global Resession | Harsh KumarThe Triple Threat | Article on Global Resession | Harsh Kumar
The Triple Threat | Article on Global Resession | Harsh KumarHarsh Kumar
 
Call Girls In Yusuf Sarai Women Seeking Men 9654467111
Call Girls In Yusuf Sarai Women Seeking Men 9654467111Call Girls In Yusuf Sarai Women Seeking Men 9654467111
Call Girls In Yusuf Sarai Women Seeking Men 9654467111Sapana Sha
 
PMFBY , Pradhan Mantri Fasal bima yojna
PMFBY , Pradhan Mantri  Fasal bima yojnaPMFBY , Pradhan Mantri  Fasal bima yojna
PMFBY , Pradhan Mantri Fasal bima yojnaDharmendra Kumar
 
Governor Olli Rehn: Dialling back monetary restraint
Governor Olli Rehn: Dialling back monetary restraintGovernor Olli Rehn: Dialling back monetary restraint
Governor Olli Rehn: Dialling back monetary restraintSuomen Pankki
 
Stock Market Brief Deck for "this does not happen often".pdf
Stock Market Brief Deck for "this does not happen often".pdfStock Market Brief Deck for "this does not happen often".pdf
Stock Market Brief Deck for "this does not happen often".pdfMichael Silva
 
Financial Leverage Definition, Advantages, and Disadvantages
Financial Leverage Definition, Advantages, and DisadvantagesFinancial Leverage Definition, Advantages, and Disadvantages
Financial Leverage Definition, Advantages, and Disadvantagesjayjaymabutot13
 
212MTAMount Durham University Bachelor's Diploma in Technology
212MTAMount Durham University Bachelor's Diploma in Technology212MTAMount Durham University Bachelor's Diploma in Technology
212MTAMount Durham University Bachelor's Diploma in Technologyz xss
 
NO1 WorldWide Love marriage specialist baba ji Amil Baba Kala ilam powerful v...
NO1 WorldWide Love marriage specialist baba ji Amil Baba Kala ilam powerful v...NO1 WorldWide Love marriage specialist baba ji Amil Baba Kala ilam powerful v...
NO1 WorldWide Love marriage specialist baba ji Amil Baba Kala ilam powerful v...Amil baba
 
(中央兰开夏大学毕业证学位证成绩单-案例)
(中央兰开夏大学毕业证学位证成绩单-案例)(中央兰开夏大学毕业证学位证成绩单-案例)
(中央兰开夏大学毕业证学位证成绩单-案例)twfkn8xj
 
Current Economic situation of Pakistan .pptx
Current Economic situation of Pakistan .pptxCurrent Economic situation of Pakistan .pptx
Current Economic situation of Pakistan .pptxuzma244191
 
Monthly Market Risk Update: April 2024 [SlideShare]
Monthly Market Risk Update: April 2024 [SlideShare]Monthly Market Risk Update: April 2024 [SlideShare]
Monthly Market Risk Update: April 2024 [SlideShare]Commonwealth
 
原版1:1复刻堪萨斯大学毕业证KU毕业证留信学历认证
原版1:1复刻堪萨斯大学毕业证KU毕业证留信学历认证原版1:1复刻堪萨斯大学毕业证KU毕业证留信学历认证
原版1:1复刻堪萨斯大学毕业证KU毕业证留信学历认证jdkhjh
 
(办理原版一样)QUT毕业证昆士兰科技大学毕业证学位证留信学历认证成绩单补办
(办理原版一样)QUT毕业证昆士兰科技大学毕业证学位证留信学历认证成绩单补办(办理原版一样)QUT毕业证昆士兰科技大学毕业证学位证留信学历认证成绩单补办
(办理原版一样)QUT毕业证昆士兰科技大学毕业证学位证留信学历认证成绩单补办fqiuho152
 
chapter_2.ppt The labour market definitions and trends
chapter_2.ppt The labour market definitions and trendschapter_2.ppt The labour market definitions and trends
chapter_2.ppt The labour market definitions and trendslemlemtesfaye192
 
Authentic No 1 Amil Baba In Pakistan Authentic No 1 Amil Baba In Karachi No 1...
Authentic No 1 Amil Baba In Pakistan Authentic No 1 Amil Baba In Karachi No 1...Authentic No 1 Amil Baba In Pakistan Authentic No 1 Amil Baba In Karachi No 1...
Authentic No 1 Amil Baba In Pakistan Authentic No 1 Amil Baba In Karachi No 1...First NO1 World Amil baba in Faisalabad
 

Recently uploaded (20)

The Core Functions of the Bangko Sentral ng Pilipinas
The Core Functions of the Bangko Sentral ng PilipinasThe Core Functions of the Bangko Sentral ng Pilipinas
The Core Functions of the Bangko Sentral ng Pilipinas
 
Interimreport1 January–31 March2024 Elo Mutual Pension Insurance Company
Interimreport1 January–31 March2024 Elo Mutual Pension Insurance CompanyInterimreport1 January–31 March2024 Elo Mutual Pension Insurance Company
Interimreport1 January–31 March2024 Elo Mutual Pension Insurance Company
 
《加拿大本地办假证-寻找办理Dalhousie毕业证和达尔豪斯大学毕业证书的中介代理》
《加拿大本地办假证-寻找办理Dalhousie毕业证和达尔豪斯大学毕业证书的中介代理》《加拿大本地办假证-寻找办理Dalhousie毕业证和达尔豪斯大学毕业证书的中介代理》
《加拿大本地办假证-寻找办理Dalhousie毕业证和达尔豪斯大学毕业证书的中介代理》
 
Call Girls Near Delhi Pride Hotel, New Delhi|9873777170
Call Girls Near Delhi Pride Hotel, New Delhi|9873777170Call Girls Near Delhi Pride Hotel, New Delhi|9873777170
Call Girls Near Delhi Pride Hotel, New Delhi|9873777170
 
Stock Market Brief Deck FOR 4/17 video.pdf
Stock Market Brief Deck FOR 4/17 video.pdfStock Market Brief Deck FOR 4/17 video.pdf
Stock Market Brief Deck FOR 4/17 video.pdf
 
The Triple Threat | Article on Global Resession | Harsh Kumar
The Triple Threat | Article on Global Resession | Harsh KumarThe Triple Threat | Article on Global Resession | Harsh Kumar
The Triple Threat | Article on Global Resession | Harsh Kumar
 
Call Girls In Yusuf Sarai Women Seeking Men 9654467111
Call Girls In Yusuf Sarai Women Seeking Men 9654467111Call Girls In Yusuf Sarai Women Seeking Men 9654467111
Call Girls In Yusuf Sarai Women Seeking Men 9654467111
 
PMFBY , Pradhan Mantri Fasal bima yojna
PMFBY , Pradhan Mantri  Fasal bima yojnaPMFBY , Pradhan Mantri  Fasal bima yojna
PMFBY , Pradhan Mantri Fasal bima yojna
 
Governor Olli Rehn: Dialling back monetary restraint
Governor Olli Rehn: Dialling back monetary restraintGovernor Olli Rehn: Dialling back monetary restraint
Governor Olli Rehn: Dialling back monetary restraint
 
Stock Market Brief Deck for "this does not happen often".pdf
Stock Market Brief Deck for "this does not happen often".pdfStock Market Brief Deck for "this does not happen often".pdf
Stock Market Brief Deck for "this does not happen often".pdf
 
Financial Leverage Definition, Advantages, and Disadvantages
Financial Leverage Definition, Advantages, and DisadvantagesFinancial Leverage Definition, Advantages, and Disadvantages
Financial Leverage Definition, Advantages, and Disadvantages
 
212MTAMount Durham University Bachelor's Diploma in Technology
212MTAMount Durham University Bachelor's Diploma in Technology212MTAMount Durham University Bachelor's Diploma in Technology
212MTAMount Durham University Bachelor's Diploma in Technology
 
NO1 WorldWide Love marriage specialist baba ji Amil Baba Kala ilam powerful v...
NO1 WorldWide Love marriage specialist baba ji Amil Baba Kala ilam powerful v...NO1 WorldWide Love marriage specialist baba ji Amil Baba Kala ilam powerful v...
NO1 WorldWide Love marriage specialist baba ji Amil Baba Kala ilam powerful v...
 
(中央兰开夏大学毕业证学位证成绩单-案例)
(中央兰开夏大学毕业证学位证成绩单-案例)(中央兰开夏大学毕业证学位证成绩单-案例)
(中央兰开夏大学毕业证学位证成绩单-案例)
 
Current Economic situation of Pakistan .pptx
Current Economic situation of Pakistan .pptxCurrent Economic situation of Pakistan .pptx
Current Economic situation of Pakistan .pptx
 
Monthly Market Risk Update: April 2024 [SlideShare]
Monthly Market Risk Update: April 2024 [SlideShare]Monthly Market Risk Update: April 2024 [SlideShare]
Monthly Market Risk Update: April 2024 [SlideShare]
 
原版1:1复刻堪萨斯大学毕业证KU毕业证留信学历认证
原版1:1复刻堪萨斯大学毕业证KU毕业证留信学历认证原版1:1复刻堪萨斯大学毕业证KU毕业证留信学历认证
原版1:1复刻堪萨斯大学毕业证KU毕业证留信学历认证
 
(办理原版一样)QUT毕业证昆士兰科技大学毕业证学位证留信学历认证成绩单补办
(办理原版一样)QUT毕业证昆士兰科技大学毕业证学位证留信学历认证成绩单补办(办理原版一样)QUT毕业证昆士兰科技大学毕业证学位证留信学历认证成绩单补办
(办理原版一样)QUT毕业证昆士兰科技大学毕业证学位证留信学历认证成绩单补办
 
chapter_2.ppt The labour market definitions and trends
chapter_2.ppt The labour market definitions and trendschapter_2.ppt The labour market definitions and trends
chapter_2.ppt The labour market definitions and trends
 
Authentic No 1 Amil Baba In Pakistan Authentic No 1 Amil Baba In Karachi No 1...
Authentic No 1 Amil Baba In Pakistan Authentic No 1 Amil Baba In Karachi No 1...Authentic No 1 Amil Baba In Pakistan Authentic No 1 Amil Baba In Karachi No 1...
Authentic No 1 Amil Baba In Pakistan Authentic No 1 Amil Baba In Karachi No 1...
 

Ecommerce Sector Report January 2018

  • 1. For updated information, please visit www.ibef.org January 2018 E-COMMERCE
  • 2. Table of Content Executive Summary……………….….…….3 Advantage India…………………..….……..4 Market Overview …………………….……..6 Porter’s Five Forces Framework....…..…..15 Strategies Adopted………….……..…..…..16 Growth Drivers and Opportunities…….…..18 Industry Associations……………...…….....29 Case Studies…..……………..……………..26 Useful Information……….......……………..31
  • 3. For updated information, please visit www.ibef.orgE-Commerce3 39 50 64 200 0 100 200 300 2017 2018F 2020F 2026F 429 700 829 0 500 1,000 2017* 2020 2021 Internet users in India (million) India’s internet economy (US$ billion) 125 250 0 100 200 300 FY17 2020 Indian E-Commerce Market (US$ billion) Source: Media sources, Aranca Research Notes: CAGR - Compound Annual Growth Rate, * - as of September 2017  The Indian e-commerce industry has been on an upward growth trajectory and is expected to surpass the US to become the second largest e-commerce market in the world by 2034.  The e-commerce market is expected to reach US$ 64 billion by 2020 and US$ 200 billion by 2026 from US$ 38.5 billion as of 2017.  With growing internet penetration, internet users in India are expected to increase from 429.23 million as of September 2017 to 829 million by 2021.  Rising internet penetration is expected to lead to growth in ecommerce.  India’s internet economy is expected to double from US$125 billion as of April 2017 to US$ 250 billion by 2020, majorly backed by ecommerce. EXECUTIVE SUMMARY
  • 5. For updated information, please visit www.ibef.orgE-Commerce5 ADVANTAGE INDIA  India is the fastest growing market for the ecommerce sector.  Being driven by a young demographic profile, increasing internet penetration and relative better economic performance, India’s E-commerce revenue is expected to jump from US$ 39 billion in 2017 to US$ 120 billion in 2020, growing at an annual rate of 51 per cent, the highest in the world.  The recent rise in digital literacy has led to an influx of investment in e-commerce firms, levelling the market for new players to set up their base, while churn out innovative patterns to disrupt old functioning.  Private equity and venture capital investments in the e-commerce industry in India touched a record US$ 11.2 billion in the first half of 2017, a 41 per cent rise over last year.  In India 100 per cent FDI is permitted in B2B e-commerce,  As per new guidelines on FDI in e- commerce, 100 per cent FDI under automatic route is permitted in marketplace model of e-commerce ADVANTAGE INDIA Source: Media sources, Aranca Research  A lot of India’s blue-chip PE firms had previously avoided investing in E-commerce but are now looking for opportunities in the sector.  India’s start-up ecosystem is growing supported by favourable FDI policies, Government initiatives like Start-up India and Digital India, as well as rising internet penetration driven by market players like Reliance Jio. Notes: FDI – Foreign Direct Investment
  • 7. For updated information, please visit www.ibef.orgE-Commerce7 GROWTH OF E-COMMERCE IN INDIA 14 20 39 50 64 188 200 0 50 100 150 200 250 2014 2015 2017 2018 F 2020 F 2025 F 2026 F Source: Economic Times, PWC, Financial Express  Propelled by rising smartphone penetration, the launch of 4G networks and increasing consumer wealth, the Indian e-commerce market is expected to grow to US$ 200 billion by 2026 from US$ 38.5 billion as of 2017.  E-commerce is increasingly attracting customers from Tier 2 and 3 cities, where people have limited access to brands but have high aspirations.  With the increase in awareness about the benefits of online trading, there has been a significant rise in investment in E-commerce business. Hand in hand with offline trading, many established businesses, e.g. Shoppers Stop or Lifestyle, have setup online transaction channels.  Earlier food and grocery were never thought of as items for online trading. However, with the change of working habits, and consumers opting for adaptability and convenience, there are now innumerable small and large E-commerce companies selling provisions and food items like Grofers, BigBasket, etc.  India's ecommerce industry's sales rose 40 per cent year-on-year to reach Rs 9,000 crore (US$ 1.5 billion) during the five-day sale period ending September 24, 2017, backed by huge deals and discounts offered by the major ecommerce companies.^ Visakhapatnam port traffic (million tonnes)E-commerce Industry in India (US$ billion) Notes: *Estimated, F – Forecasted, ^ - as per RedSeer Consulting
  • 8. For updated information, please visit www.ibef.orgE-Commerce8 RISING INTERNET PENETRATION IN INDIA 4.0% 4.4% 5.1% 7.5% 10.1% 12.6% 15.1% 18.0% 27.0% 34.8% 0.0% 5.0% 10.0% 15.0% 20.0% 25.0% 30.0% 35.0% 40.0% 2007 2008 2009 2010 2011 2012 2013 2014 2015 2016 Source: Economic Times, Live Mint, Aranca Research  Internet penetration in India grew from just 4 per cent in 2007 to 34.08 per cent in 2016, registering a direct increase of 89 per cent in 2016 over 2007.  Urban India with an estimated population of 444 million already has 269 million (60 per cent) using the Internet.  Rural India, with an estimated population of 906 million as per 2011 census, has only 163 million (17 per cent) Internet users. There is therefore a great opportunity for increasing penetration in the rural areas.  Analysis of ‘Daily Users’ reveal that both in Urban and Rural India, the younger generations are the most prolific users of internet.  Rising internet penetration is expected to drive ecommerce growth in India. Visakhapatnam port traffic (million tonnes)Internet Penetration in India
  • 9. For updated information, please visit www.ibef.orgE-Commerce9 E-COMMERCE RETAIL MARKET 47% 31% 8% 7% 2% 2% 3% Electronics Apparel Home and furnishing Books Baby products Beauty and personal care Others E-commerce retail market by value (2016) The online retail market in India is estimated to be worth US$ 17.8 billion in terms of gross merchandise value (GMV) as of 2017 and is estimated to increase by 60 per cent to US$ 28-30 billion in 2018.  Electronics is currently the largest segment in e-commerce in India with a share of 47 per cent and is expected to grow at a CAGR of 43 per cent by 2020.  The apparel segment has the second highest share of 31 per cent in the e-commerce retail industry  Currently, there are 1-1.2 million transactions per day in e-commerce retailing. Source: KPMG Report – E-commerce Retail Logistics India Notes: CAGR – Compound Annual Growth Rate
  • 10. For updated information, please visit www.ibef.orgE-Commerce10 ONLINE RETAIL VS TOTAL RETAIL IN INDIA 95% 5% Offline Retail Online Retail Online retail out of total retail in India (2020) 97.5% 2.5% Offline Retail Online Retail Online retail out of total retail in India (2016)  There are a lot of opportunities for e-retailers in India to capitalise upon with the gradually growing internet penetration in India.  The penetration of online retail in India’s total retail market is expected to rise from 2.5 per cent in 2016 to 5 per cent by 2020.  The online retail market in India increased from US$ 14.5 billion in 2016 to US$ 17.8 billion in 2017 and is estimated to reach US$ 28-30 billion by 2018. Source: KPMG Report – E-commerce Retail Logistics India
  • 11. For updated information, please visit www.ibef.orgE-Commerce11 E-COMMERCE RETAIL LOGISTICS MARKET IN INDIA 36% 31% 23% 6% 3% 1% Apparels Electronics Home furnishing Baby products Books Others 38% 29% 15% 9% 7% 1% 1% Apparels Electronics Home furnishing Baby products Books Beauty and personal care Others  Logistics is a major driver of the e-commerce retail industry and is an important point of differentiation between market players aiming at better customer satisfaction and service.  The logistics sector pertaining to the e-commerce industry in India stood at US$ 460 million in 2016 and is expected to grow at a CAGR of 48 per cent to reach US$ 2.2 billion by 2020. Source: KPMG Report – E-commerce Retail Logistics India Notes: CAGR – Compound Annual Growth Rate E-commerce retail logistics market in India(2020)E-commerce retail logistics market in India (2016)
  • 12. For updated information, please visit www.ibef.orgE-Commerce12 E-TAILING MARKET BY BUSINESS MODEL E-Commerce Marketplace Model  Marketplace model adheres to the standards and directions of a zero inventory model. For example, Naaptol, eBay and Shopclues.  The e-commerce marketplace becomes a digital platform for consumers and merchants without warehousing the products. Marketplaces do offer shipment, delivery and payment help to merchants by tying up with some selected logistics companies and financial institutions.  The new FDI policy rules and regulations in the e-commerce market have permitted 100 percent FDI in the e-commerce marketplace model under the automatic route. Inventory-led Model  Inventory led models are those shopping websites where online buyers choose from among products owned by the online shopping company or shopping website take care of the whole process end-to-end, starting with product purchase, warehousing and ending with product dispatch.  A few examples of such are Jabong, Yepme and LatestOne.com. Source: PWC
  • 13. For updated information, please visit www.ibef.orgE-Commerce13 PRIVATE INVESTMENTS IN E-COMMERCE  Venture capital (VC)-backed firms in India raised a record US$ 9.6 billion of fresh capital between January-September 2017, which is more than twice the amount of capital raised during the same period in 2016.  The first half of 2017 recorded 26 start-up funding deals of value US$ 100 million and above, aggregating to US$ 7.7 billion and accounting for 68 per cent of investments during the period. Company Investor Funding (US$ million) Flipkart SoftBank 2,500 Capital Float Ribbit Capital, SAIF Partners, Sequoia India 45 Bank Bazaar Experian Plc 30 Droom Asset Management (Asia) Ltd, Digital Garage Inc 20 1 mg HBM Healthcare Investments, Maverick Capital Ventures, Sequoia India, Omidyar Network and Kae Capital 15 Gozefo Sequoia Capital India, Helion Venture Partners and Beenext Pte Ltd 9 Jumbotail Kalaari Capital, Nexus India Capital Advisors 8.5 Blackbuck InnoVen Capital 7.7 KartRocket.com Bertelsmann India Investments, Nirvana Digital India Fund 4.1 The Label Life Kalpavriksh, Centrum group’s maiden private equity (PE) fund 3.1 Chumbak Blacksoil Capital Pvt. Ltd 1.7 MFine Stellaris Venture Partners, Mayur Abhaya, Rohit M.A 1.5 Funding Activities (As of December 2017) Source: Media sources, Aranca Research
  • 14. For updated information, please visit www.ibef.orgE-Commerce14 KEY PLAYERS
  • 15. For updated information, please visit www.ibef.orgE-Commerce15 PORTER’S FIVE FORCES FRAMEWORK ANALYSIS  Low – Bargaining power of suppliers is low as there are many suppliers in the market, and therefore the ecommerce companies have the power to choose their suppliers. Bargaining Power of Suppliers  High – Threat of substitutes is high as there are a lot of sellers with similar products and services; and there is no switching cost for customers. Threat of Substitutes  High – Competition among major players is very high, as there is no switching cost for customers. The players are constantly competing on the basis on price as well as other factors that influence buyers’ choice like quick delivery, discounts and offers, variety, customer service etc. Competitive Rivalry  High – Threat of new entrants is high, as there is very little cost involved in setting up an ecommerce website. Threat of New Entrants  High – Bargaining power of customers is very high as there are many players in the market with similar products and there is no switching cost. Buyers prefer the company that offers the best price among other factors. Bargaining Power of Buyers Positive Impact Neutral Impact Negative Impact
  • 17. For updated information, please visit www.ibef.orgE-Commerce17  E-commerce companies are gradually expanding to different cities, regions and even countries. They are also expanding their product range to cater to a larger amount of people.  In May 2017, Uber launched UberEats, an on-demand food delivery app in India  As of July 29, 2017 Amazon India has pledged US$ 500 million for the expansion of its food retail business in India.  Paytm Mall, ecommerce platform of Paytm, is planning to expand its groceries segment and is targeting a Gross Merchandise Value (GMV) of US$ 3 billion from this segment by the end of 2018.  One of the biggest advantage of E-commerce is that along with the core product or service it can also provide numerous ancillary services without having to invest a lot.  Amazon India introduced one day delivery guarantee on purchases for a nominal fee. Flipkart started with same day guarantee in 2013 too.  Flipkart introduced its own payment gateway Payzippy and also, its own logistics and supply chain firm Ekart.  E-commerce websites are also introducting e-Wallet services; for example - Amazon’s Pay Balance.  Site visitors demand one-of-a-kind experiences that cater to their needs and interests. Technology is available, even to smaller players, to capture individual shoppers’ interests and preferences and generate a product selection and shopping experience led by individualised promotions tailored to them.  Many E-commerce websites provide personalised experience to customers to cater to their needs and interests depending upon their location, choices, products they like or buy, websites they visit etc.  This strategy has helped companies to know customers’ demands better and serve them accordingly.  E-commerce companies are increasingly adopting subscription model to provide extra benefits and tailored services to customers to suit their needs.  Amazon introduced Amazon Prime, a subscription based service for Amazon customers, in 2016. members of Amazon Prime could avail early access to selected deals, free one day delivery and other benefits. Amazon Prime subscribers in India stood at around 5-6 million as of December 2016  In 2014, Flipkart introduced Flipkart First, a premium subscription based services wherein a customer gets free delivery, discounted same day delivery, priority customer service etc. STRATEGIES ADOPTED Expansion Ancillary services Personalised Experience Subscription for ecommerce Source: Media sources, Company websites, Aranca Research
  • 19. For updated information, please visit www.ibef.orgE-Commerce19 GROWTH DRIVERS FOR E-COMMERCE Growth drivers Increasing awareness Investment Government initiatives  Government initiatives like Digital India are constantly introducing people to online modes of commerce.  Favourable FDI policy is attracting key players.  Increasing FDI inflows, domestic investment, support from key industrial players is helping in the growth of e- commerce.  As the awareness of using internet is increasing, more and more people are being drawn to E-commerce.  Whether it be sellers, buyers, users or investors, people have started getting used to online mode or commerce. Source: Aranca Research
  • 20. For updated information, please visit www.ibef.orgE-Commerce20  Number of online shoppers is expected to go up to 175 million by 2020.  Mobile-savvy shoppers are the backbone of India’s online shopping industry.  Men in India are more avid shoppers than women in part because of demographic and cultural differences.  Discounts, added with a comfort of sitting at home and purchasing, is an effective driving factor of E- commerce. Availability of various websites gives customers a lot of options to choose from.  Chatbots and personal assistance apps have made transactions seamless.  One can get several brands and products from different sellers at one place. Also, one can get in on the latest international trends without spending money on travel; you can shop from retailers in other parts of the country or even the world without being limited by geographic area.  Metro cities like Bengaluru, Mumbai, and Delhi, with population greater than 100,000, accounted for most online shopping in absolute numbers.  Less densely populated regions generated a larger proportion of online sales. Nearly 60 per cent of Snapdeal’s purchases came from cities classified as tier II and III.  Flipkart also noted that “sales of branded products across categories saw a sharp increase, as more of tier 2 and tier 3 Indian towns took to shopping online.”  Although shoppers between 25 and 34 years of age were most active on e-commerce portals, a surprising number of older people also shopped online in 2016.  However, the age group of 15-34 years are the major consumers of E-commerce.  The popularity of web series among millenials is growing immensely. DEMOGRAPHIC FACTORS Online Shoppers Convenience of E- commerce Tier II and Tier III cities provide major sales Millennials are the most active Source: Economic Times, Media sources, Aranca Research
  • 21. For updated information, please visit www.ibef.orgE-Commerce21  Web content search in Hindi grew by 155 per cent in 2015 whereas that through mobile internet grew by 300 per cent in the same period.  In a move to grab the opportunity, Snapdeal and Make My Trip had launched their apps in Hindi and a few other vernacular languages in 2014.  Online retailers see this emergent segment as a new growth driver as the incremental growth in mobile subscribers can be credited mainly to people who are comfortable with languages other than English.  Consumer demand can be seen increasing even in small towns and cities.  Less densely populated regions generated a larger proportion of online sales. Nearly 60 per cent of Snapdeal’s purchases came from cities classified as tier II and III.  Flipkart also noted that “sales of branded products across categories saw a sharp increase, as more of tier 2 and tier 3 Indian towns took to shopping online.”  Online retailers’ growing reach in town and cities beyond metros is driven by an increasing in usage of mobile internet in the country. Increased ownership of smartphones is helping more Indians access shopping websites easily.  Rise in smartphone usage is expected to reach 50 per cent penetration by 2020. FACTORS DRIVING E-COMMERCE GROWTH… (1/2) Internet content in local languages Growth in non-metro cities Mobile Commerce Source: Media sources, Aranca Research
  • 22. For updated information, please visit www.ibef.orgE-Commerce22  A net addition of nearly 140 million debit cards has been recorded in the country in the past few years. Usage of debit cards at points of sale terminal has increased by 86 per cent during the same period. This clearly reflects that people are getting comfortable with using debit cards for activities other than withdrawals at ATM.  Many online retails insist use of debit cards for high value transactions, this is however a welcome change. This will help e-tailers to increase their reach.  Digital payments will act as a game changer for the domestic e-commerce business and the current trend of dominance of Cash-on-delivery would be reversed in the next five years, as per Mr Sachin Bansal, Executive Chairman, Flipkart.  Online retailers now deliver to “12,500-15,000 pin codes” out of nearly 100,000 pin codes in the country.  With logistics and warehouses attracting an estimated investment of nearly US$2 billion by 2020, the reach of online retailers to remote locations is set to increase. FACTORS DRIVING E-COMMERCE GROWTH… (2/2) Cashless Transactions Growth of logistics and warehouses. Source: Media sources, Aranca Research  Amazon has launched an online Business-to-Business (B2B) market place in India where small and medium enterprises (SMEs) can buy products.  Metro Cash and Carry, Germany-based, B2B retail store chain, is planning to start e-commerce solutions for its B2B business in India by the end of 2017.  Power2SME, one of the largest B2B online marketplaces in India that provides raw materials to small and medium enterprises (SMEs), has raised US$ 36 million from Inventus Capital, Accel Partners and others in September 2017, which will be used towards technology, sales, marketing and geographic expansion. B2B ecommerce  Chinese phone manufacturer, Xiaomi Corporation, is planning to invest about US$ 1 billion in 100 Indian start-ups over the coming five years, with an aim to make an ecosystem of apps surrounding its smartphone brand.  US-based ecommerce giant, Amazon, has invested about US$ 1 billion in its Indian arm so far in 2017, taking its total investment in its business in India to US$ 2.7 billion. Increasing Investments
  • 23. For updated information, please visit www.ibef.orgE-Commerce23 GROWTH OF INTERNET USERS 46.59 52.43 62.16 92.32 125.61 158.96 193.20 233.15 375.00 432.00 429.23 700.00 829.00 0.00 100.00 200.00 300.00 400.00 500.00 600.00 700.00 800.00 900.00 Source: Economic Times, Live Mint  The number of Internet users in India is 429.23 million as of September 2017, growing at a CAGR of approximately 22.4 per cent in the last decade.  77 per cent of urban users and 92 per cent of rural users consider mobile as the primary device for accessing the internet, largely driven by availability and affordability of smartphones.  In urban India, the Internet user base stood at 299.83 million as of September 2017.  Rural India’s internet user base stood at 129.41 million as of September 2017. Visakhapatnam port traffic (million tonnes)Internet Users in India (million) Notes: *as of September 2017 CAGR 22.4%
  • 24. For updated information, please visit www.ibef.orgE-Commerce24 INCREASE IN MOBILE SHIPMENTS DRIVING E- COMMERCE GROWTH India’s Smartphone Shipments (millions) 8.0 14.5 17.5 42.5 79.5 102.0 108.0 92.5 0 20 40 60 80 100 120 2010 2011 2012 2013 2014 2015 2016 2017*  The proliferation of mobile devices combined with internet access via affordable broadband solutions and mobile data is a key factor driving the tremendous growth in India’s e-commerce sector.  Smartphone shipments in India stood at 27 million units in the first quarter of 2017 and 28 million units in the second quarter of 2017, 40 million units in the third quarter, taking the total shipments to 92.5million units in 2017.*  The overall smartphone shipment is expected to reach nearly 1.6 billion units in 2017.  Mobile platforms have emerged as a major gateway for customer purchases as smartphones are increasingly replacing PCs for online shopping.  Offline brands have now started focusing on online channels as well to gain extra market share.  65 per cent of the people who shop online, do so using their mobile phones.  Smartphone users in India are expected to reach 700 million by 2020.  India's mobile wallet industry is estimated to grow at a compound annual growth rate (CAGR) of 148 per cent to reach US$ 4.4 billion by 2022. ^ Source: IMF, World Bank, International Data Corporation (IDC) Notes: * As of September 2017, ^ - 'World Payment Report 2017' by Capgemini.
  • 25. For updated information, please visit www.ibef.orgE-Commerce25 GOVERNMENT INITIATIVES IN E-COMMERCE  Since 2014, the Government of India has announced various initiatives namely, Digital India, Make in India, Start-up India, Skill India and Innovation Fund. The timely and effective implementation of such programsmes will likely support the e-commerce growth in the country.  In the Union Budget of 2017-18, government has allocated US$ 1.55 billion to BharatNet Project, announcing availability of high speed broadband connectivity on optical fibre and accessibility of wifi hot spots and digital services at low tariffs in more than 150,000 gram panchayats, by the end of 2017-18.  In December 2017, the Department of Industrial Policy and Promotion (DIPP) is planning to release the index to rank Indian states based on the start-up ecosystem and the measures undertaken to promote start-ups in the states.  Finance Minister Mr Arun Jaitley has proposed various measures to quicken India's transition to a cashless economy, including a ban on cash transactions over Rs 300,000 (US$ 4,655.1), tax incentives for creation of a cashless infrastructure, promoting greater usage of non-cash modes of payments, and making Aadhaar-based payments more widespread.  Government announced the launch of BHIM app. It will help increase digital payments in the country. BHIM app has been adopted by 12.5 million so far. The Government will launch two new schemes to promote the usage of BHIM; these are, Referral Bonus Scheme for individuals and a Cashback Scheme for merchants.  Under the Digital India movement, government launched various initiatives like Udaan, Umang, StartUp India Portal etc.  The recent announcement of GST roll out, another significant reform would help e-retail competitors streamline their supply chain and simplify their tax structure, while rationalising seamless integration of goods and services across the country. Moreover it will eliminate the dual taxes being imposed on the current ecommerce eco system.  The Reserve Bank of India (RBI) has instructed banks and companies to make all know-your-customer (KYC)-compliant prepaid payment instruments (PPIs), like mobile wallets, interoperable amongst themselves via Unified Payments Interface (UPI) by April 2018.  In order to increase the participation of foreign players in the e-commerce field, the Indian Government hiked the limit of foreign direct investment (FDI) in the E-commerce marketplace model for up to 100 per cent (in B2B models).  The Government of India has distributed rewards worth around Rs 153.5 crore (US$ 23.8 million) to 1 million customers for embracing digital payments, under the Lucky Grahak Yojana and Digi-Dhan Vyapar Yojana. Source: Union Budget 2017-18, Media sources, Aranca Research
  • 27. For updated information, please visit www.ibef.orgE-Commerce27 FLIPKART: OVERVIEW 11 20 150 360 1,910 700 3,900 - 500 1,000 1,500 2,000 2,500 3,000 3,500 4,000 4,500 2009 2011 2012 2013 2014 2015 2017* Source: Economic Times, Flipkart, Business Line, Aranca Research  Flipkart, an Indian E-Commerce company, started in October 2007 and is currently headquartered in Bengaluru.  Flipkart was started by Sachin Bansal and Binny Bansal and as of March 2017, has 8000 permanent employees and 20000-25000 contract workers who form part of its supply chain.  Flipkart is the market leader in India’s online marketplace with over 80 million products across more than 80 categories.  Since 2009, Flipkart, valued at US$ 11.6 billion as of April 2017, has raised over US$4 billion in 11 funding rounds. American investment firm Tiger Global participated in nine of them.  Flipkart boasts of having 100 million users and 100 thousand sellers along with 21 warehouses.  On average, Flipkart has around 8 million shipments per month.  In 2016, Flipkart became the first Indian App to cross 50 million users.  In April 2017, Flipkart raised US$ 1.4 billion from Microsoft, eBay and Tencent and in August 2017, it raised US$ 2.5 billion from SoftBank.  In exchange of an equity stake in Flipkart, eBay made a cash investment of US$ 500 million and sold its eBay.in business to Flipkart, in 2017.  Flipkart invested US$ 400 million in its logistics arm, eKart, between September-December 2017. Visakhapatnam port traffic (million tonnes)Flipkart’s funding (US$ million) Notes: *As of August 2017
  • 28. For updated information, please visit www.ibef.orgE-Commerce28 EVOLUTION OF FLIPKART 2007 2008-09 2012-132010-11 2014-15 2016 onwards  Founded in October 2007 by Sachin Bansal and Binny Bansal with an investment of mere US$ 6,200.  Introduces music, movies and mobiles.  Launches cash on delivery, card on delivery and prepaid wallet to store money online.  Introduces 30 day replacement guarantee and also, a dedicated logistics for faster delivery.  Receives funding from Tiger Global of US$ 20 million in March 2011.  Company valued at US$ 1 billion  Acquires Myntra for US$ 300 million.  Raises US$ 210 million from DST Global.  Receives a whopping US$ 1 billion funding from GIC Singapore and existing investors.  Raises US$ 700 million, in 2014, from hedge funds like Greenoaks, Steadview Capital, Qatar Investment Authority and T. Rowe Price and the same amount from existing investors in 2015.  Valuation shots up to US$ 15.5 billion.  Flipkart went online as a book retailer.  Ashish Gupta, founder of Junglee and Helion Venture Partners funds Flipkart initially.  Receives it’s first funding in 2009 of US$ 1 million from Accel Partners and US$ 20 million from Tiger Global.  Company valued at US$ 50 million.  Launches lifestyle and fashion products  Launches payment gateway Payzippy.  Becomes a unicorn startup in 2012. Announces US$ 150 million round led by South African tech major Naspers.  Raises US$ 200 million from existing investors and US$ 160 million from Morgan Stanley, Sofina, Vulcan Capital and Dragoneer.  Valued at US$ 1.6 billion  Crosses 100 million registered users.  Raises US$ 1.4 billion from Tencent, Microsoft and eBay, in 2017  As of April 2017, receives valuation of US$ 11.6 billion.  In August 2017, completes merger with eBay India.  Receives US$ 2.5 billion in funding from SoftBank in August 2017.  In November 2017 Flipkart,launched its own smartphone brand ‘Billion Capture +’ Source: Financial Express, Company website, Aranca Research
  • 30. For updated information, please visit www.ibef.orgE-Commerce30 KEY INDUSTRY ASSOCIATIONS e-Commerce Association of India Address: 111/112, Ascot Centre, Near Hotel ITC Maratha, Sahar Road, Sahar, Andheri (E) Mumbai – 400099 Phone: +91 22 28269527 - 29 Fax: +91 22 28269536 E-mail: info@rai.net.in Address: 122, 1st Floor, Devika Tower Corporate Business District, Nehru Place New Delhi –110 019 Phone: +91 011 41582722 Fax : +91 011 41582722 Email: info@ecai.co.in Retailers Association of India (RAI)
  • 32. For updated information, please visit www.ibef.orgE-Commerce32 GLOSSARY  CAGR: Compound Annual Growth Rate  GMV – Gross Merchandise Value  FDI: Foreign Direct Investment  FY: Indian Financial Year (April to March)  GOI: Government of India  INR: Indian Rupee  US$: US Dollar  Wherever applicable, numbers have been rounded off to the nearest whole number
  • 33. For updated information, please visit www.ibef.orgE-Commerce33 EXCHANGE RATES Exchange Rates (Fiscal Year) Exchange Rates (Calendar Year) Year INR INR Equivalent of one US$ 2004–05 44.81 2005–06 44.14 2006–07 45.14 2007–08 40.27 2008–09 46.14 2009–10 47.42 2010–11 45.62 2011–12 46.88 2012–13 54.31 2013–14 60.28 2014-15 61.06 2015-16 65.46 2016-17 67.09 Q1 2017-18 64.46 Q2 2017-18 64.09 Q3 2017-18 64.74 Year INR Equivalent of one US$ 2005 43.98 2006 45.18 2007 41.34 2008 43.62 2009 48.42 2010 45.72 2011 46.85 2012 53.46 2013 58.44 2014 61.03 2015 64.15 2016 67.21 2017 65.12
  • 34. For updated information, please visit www.ibef.orgE-Commerce34 DISCLAIMER India Brand Equity Foundation (IBEF) engaged Aranca to prepare this presentation and the same has been prepared by Aranca in consultation with IBEF. All rights reserved. All copyright in this presentation and related works is solely and exclusively owned by IBEF. The same may not be reproduced, wholly or in part in any material form (including photocopying or storing it in any medium by electronic means and whether or not transiently or incidentally to some other use of this presentation), modified or in any manner communicated to any third party except with the written approval of IBEF. This presentation is for information purposes only. While due care has been taken during the compilation of this presentation to ensure that the information is accurate to the best of Aranca and IBEF’s knowledge and belief, the content is not to be construed in any manner whatsoever as a substitute for professional advice. Aranca and IBEF neither recommend nor endorse any specific products or services that may have been mentioned in this presentation and nor do they assume any liability or responsibility for the outcome of decisions taken as a result of any reliance placed on this presentation. Neither Aranca nor IBEF shall be liable for any direct or indirect damages that may arise due to any act or omission on the part of the user due to any reliance placed or guidance taken from any portion of this presentation.