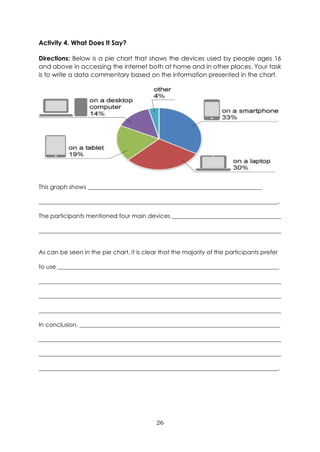
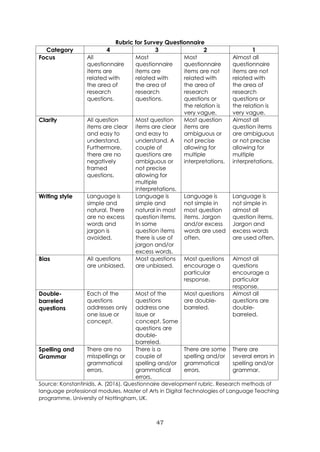
This document provides information about writing a research report, specifically focusing on surveys and questionnaires. It discusses the different types of primary and secondary sources that can be used for research. Primary sources include surveys, interviews, and observations, which collect first-hand data. Secondary sources include biographies, commentaries, encyclopedias, journals, reports, theses/dissertations, and textbooks, which interpret and analyze existing information and data. The document also provides a sample survey questionnaire that a student named Kenneth could use to collect data about his school's learning environment from his classmates. It encourages the reader to evaluate their own school by answering the survey questions.
![38
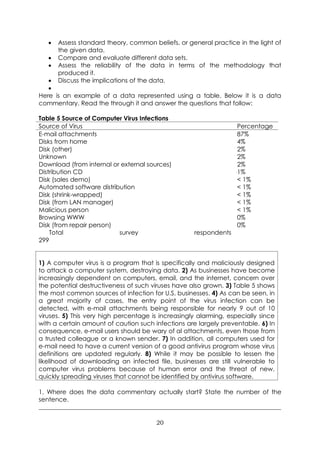
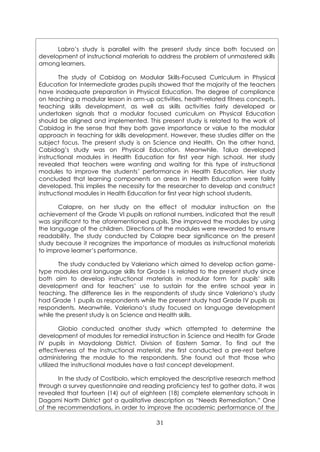
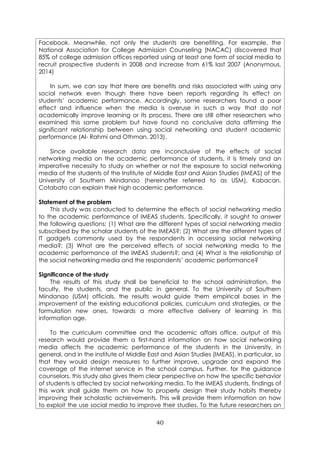
business school had the highest percentage of users of blogs, Twitter, and Linkedln
while Liberal Arts students were the highest percentage of My Space users (Martin,
2013).
With the above data, one could say that social networking media sites have
become a habit for some students and it was found out that it is difficult for them to
study for one hour without logging in to one network site. They become very smart
because of the information they get from these sites and it easy to get almost any
materials for school assignment. But some students become very poor academically
(Egedegbe, 2014). According to the research of Brubaker (2013),
the current generation of college students has been exposed to a technology which
led them to rely on social media such as Facebook and Twitter. It has an impact on
the academic performance when students overuse or multitask while doing their
school work.
A study found out that 90% of college students visit social media networking sites
in a regular basis using desktop computers, laptops, e-readers, tablets, and cell
phones to actively engage in social networking, text messaging, blogging, content
sharing, online learning, and much more daily (Guy, 2012). As an effect, most of the
users have the good quality of communication skills through the use of social
networking media over the computer [Sponcil and Gitimu (n.d.)]. They were able to
communicate with friends and family by posting information and they spent much
of the time viewing information. The face-to-face interactions via the computer
facilitate communication which allows users to keep in touch with family and friends
in a convenient way and to learn about social events and issues.
Said finding was corroborated by the work of Anonymous (2014) who
maintained that creating Facebook Group has good effects to the students. They
can share topics online. Study groups and students can use it to connect with each
other outside of the classroom while the bad effect is that students may want to add
as friends to make trouble or some personal reasons. Also, the students can also
access to a world of knowledge through the use of social networking media and
other forms of digital communication. Slaughter (2007) said that social networking
media have deeply transformed the learning. When students are connected to
social networking media it will helps them to earn better grades at school (Skiera,
Hinz & Spann, 2015).
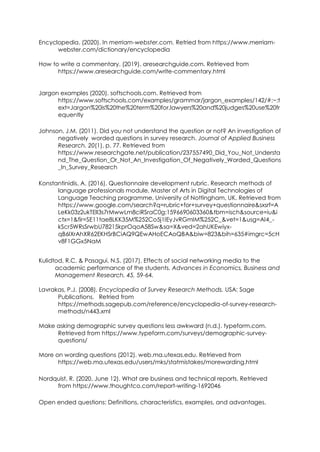
In studying the total number of hours spent by the users, Wang, Chen and Liang
(2011) disclosed that 45% of their samples admitted that they spent 6 – 8 hours per
day checking social media sites, while 23% spent more 8 hours; 20% spent 2 – 4 hours
and only 12% spent less than 2 hours on this task. Results showed that social media is
a college interest in the Wales University. Students consume a lot of time on social
networking sites especially the adolescents. They are involved in
uploading/downloading, getting information related to their academic or future
career, chatting with friends and watching online movies (Kanagarathinam, 2014).
Twitter is one of the most important media companies in the world. It is now one of
the top 10 most visited sites. With more than 500 million users, the students can find
teachers, schools, and perhaps more important professionals, lead publications in
their areas of interest (Anonymous, 2013).](https://image.slidesharecdn.com/eappquarter2-module5writingaresearchreport-231211140310-7f877615/85/EAPP-Quarter2-Module5_-Writing-a-Research-Report-pdf-41-320.jpg)
![References
Allen, M. (2017). The SAGE encyclopedia of communication research methods. USA:
Sage Publications, Inc.
Ambiquity (2020). In yourdictionary.com. Retrieved from
https://www.yourdictionary.com/ambiguity
Barrot, J.S. (2016). Academic reading & writing for senior high schoo. Quezon City:
C&E Publishing, Inc.
Barrot, J.S. & Sipacio, P.F. (2016). Academic reading & writing for senior high schoo.
Quezon City: C&E Publishing, Inc.
Bueno, D.C. (2016). Educational research writing made easy. Quezon City: Great
Books Trading.
Cardona, R.S., Reyes, A.S., & Tangalin, M.M. (2015). The bullying experiences and
classroom discipline techniques in an urban national high school in the
Philippines: A basis for anti-bullying program. American International Journal of
Contemporary Research, 5(2), 49-52. Retrieved from
http://www.aijcrnet.com/journals/Vol_5_No_2_April_2015/7.pdf
Commentary. (2020). In learnersdictionary.com. Retrieved from
https://learnersdictionary.com/definition/commentary)
Cristobal, A.P. & Cristobal M.D. (2017). Practical research for senior high school 2.
Quezon City: C&E Publishing, Inc.
Dapat, J.O. (2016). Applied English for academic and professional services. Pasay
City: JFS Publishing Services.
Delighted team (2019, May 24). Avoiding biased questions: 7 examples of
bad survey questions. Retrieved from https://delighted.com/blog/biased-
questions-examples-bad-survey-questions
Developing and writing structured survey questions. [PDF File]. (2013). Ignet.gov.
Retrieved from https://www.ignet.gov/sites/default/files/files/03_Developing_
and_Writing_Structured_Survey_Questions.pdf
Edwards, E.J., Thomas, M.D., Rosenfeld, P., & Kewley, S.B. (1997). How to conduct
organizational surveys: A step-by-step guide. USA: Sage Publications, Inc.
Retrieved form
https://books.google.com.ph/books?id=BPJyAwAAQBAJ&pg=PA33&dq=wha
t+is+double+negative+in+writing+survey+question&hl=en&sa=X&ved=2ahUKE
wis25qUjf7qAhXT62EKHdCNB40Q6AEwCHoECAUQAg#v=onepage&q=what%
20is%20double%20negative%20in%20writing%20survey%20question&f=false](https://image.slidesharecdn.com/eappquarter2-module5writingaresearchreport-231211140310-7f877615/85/EAPP-Quarter2-Module5_-Writing-a-Research-Report-pdf-62-320.jpg)