Download to read offline

![A novel fuzzy rule based system for assessment of ground water potability: A case study in South India
www.iosrjournals.org 41 | Page
Mg 0.44%
Th 0.15%
Unaffected 48.22%
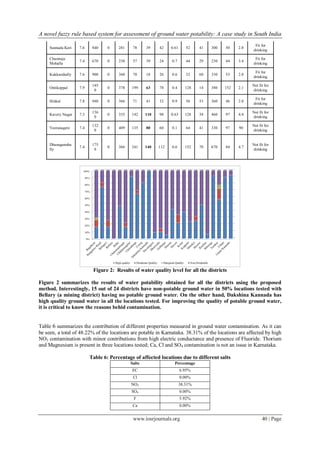
V. Conclusions
Potability of ground water is critical in India due to high population and repeated failure of monsoon
rains. Many contaminations affect potability of ground water. An automated system that can take salt
concentrations as input and generates level of potability of ground water as output is essential. In this paper, a
Fuzzy rule-based system is reported to assess the quality of water for potability based upon the concentration of
salts. It was found that twenty districts in Karnataka have a large percentage of ground water that is not suitable
for consumption and only few districts like Chikmagalur and Dakshina Kannada have good drinkable ground
water.
Acknowledgement
We would like to thank Central Ground Water Board, Bangalore, Karnataka, for sharing the data
required for our experimental analysis. I also thank Mr. Naveen Kumar H N for helping me out in fine tuning
my paper.
References
[1] Anastassia Ailamaki. Christos Faloutsos, Paul S. Fischbeck, Mitchell J. Small, Jeanne VanBriesen, An environmental sensor
network to determine drinking water quality and security, SIGMOD Record, Vol. 32, No. 4, December 2003, pp. 47-52.
[2] Expert System for Water Treatment Plant Design - A dissertation, Rand Affrikans University, Sept 2001.
[3] Ghisi E, Cardoso KA, Rupp RF, Short-term versus long-term rainfall time series in the assessment of potable water savings by using
rainwater in houses, Journal of Environment management, 2012 Jun 15;100:109-19.D.O.I. : 10.1016
[4] Han, J.; Kamber, M. Data Mining: Concepts and Techniques; Morgan Kaufmann: 2000.
[5] L.A. Zadeh, ”Fuzzy algorithms,” Info. & Ctl, Vol. 12, 1968, pp. 94-102.
[6] M. C. L. Yu, I. Cartwright, J. L. Braden, and S. T. de Bree, Examining the spatial and temporal variation of groundwater inflows to
a valley-to-flood plain river using 222Rn, geochemistry and river discharge: the Ovens River, southeast Australia, Hydrol. Earth
Syst. Sci. Discuss, 10, 5225–5267, 2013.D.O.I. :10.5194/hessd-10-5225-2013.
[7] Manoucher A, Mini karim C, Annette John, A comparison on a different rule based statistical models for modeling geogenic
groundwater contamination, Journal of Environmental modeling & Software, Vol 25, Issue 12, December 2010, pp. 1650-1657.
[8] Molina JL, Pulido-Velazquez M, LiopisAlbert C , Periahero S,Stochastic hydro-economic model for groundwater quality
management using Bayesian networks., Journal of Water Science technology, 2013;67(3):579-86. doi: 10.2166/wst.2012.598
[9] NatarajanVenkat Kumar, Samson Mathew, Ganapathiram Swaminathan, A Hybrid Approach towards the Assessment of
Groundwater Quality for Potability: A Fuzzy Logic and GIS Based Case Study of Tiruchirappalli City, India. Journal of Geographic
Information System, 2010, 2, 152-162.
[10] Oliver Meixner, Fuzzy AHP Group Decision Analysis and its Application for the Evaluation of Energy Sources, Proceedings of the
10 th International Symposium on the Analytic Hierarchy/Network Process Multi-criteria Decision Making, July 29 - August 1
2009, University of Pittsburgh
[11] RaffaeleIannone, Salvatore Miranda, Veronica Napoli and Stefano Riemma - A structured approach based on AHP and Fuzzy Logic
to estimate value of industrial assets. 2011 3rd International Conference on Information and Financial Engineering IPEDR vol.12.
[12] Rahimi D, Mokarram M. - Assessing the groundwater quality by applying fuzzy logic in GIS environment– A case study in
Southwest Iran. International Journal Of Environmental Sciences Volume 2, No 3, 2012
[13] Rossen Dimov, Weka: Practical machine learning tools and techniques with Java implementations, AI Tools Seminar University of
Saarland, WS 06/07, 2007
[14] Ting-Nien Wu, Jan-Yee Lee, Chen-Hsiang Huang, Application of Time Series Analysis on Temporal Variation of Fluoride in
Groundwater around Southern Taiwan Science Park. 2010 Seventh International Conference on Fuzzy Systems and Knowledge
Discovery (FSKD 2010).
[15] Thomas L. Saaty - Decision making with the analytic hierarchy process. Int. J. Services Sciences,Vol. 1, No. 1, 2008.13-19.
[16] Uttam kumar, Mukhopodhya C, Ramachandra T V, Spatial Data mining and modelling for visualization and urbanization, SCIT
Journal, ISSN-0974-5076, Volume 9, Aug 2009, pp. 1-9.
[17] Yonas Kassa Demissie, Data-driven models to enhance physically-based groundwater model predictions, Doctoral thesis,
University of Illinois at Urban- Champaign Champaign, IL, USA, ISBN: 978-0-549-63954-1, 2012.](https://image.slidesharecdn.com/e01523541-150114044610-conversion-gate02/85/A-novel-fuzzy-rule-based-system-for-assessment-of-ground-water-potability-A-case-study-in-South-India-7-320.jpg)

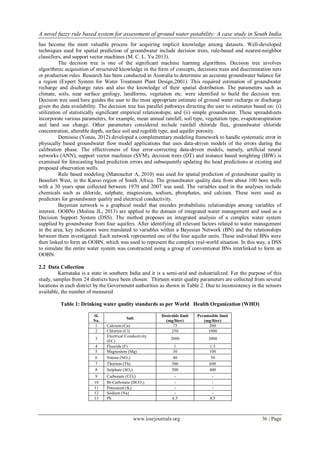
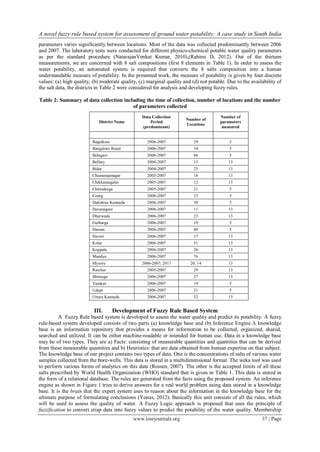
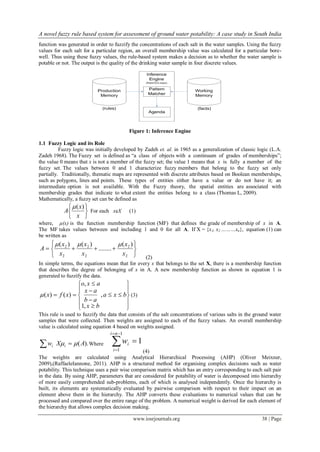
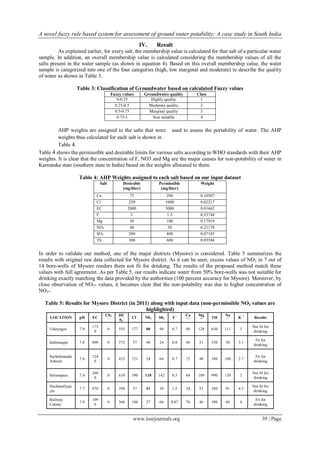
This document presents a novel fuzzy rule-based system to assess groundwater potability in South India. Groundwater samples were collected from 24 districts in Karnataka and analyzed for 8 water quality parameters. A fuzzy logic approach was used to convert parameter concentrations into fuzzy membership values. Analytic hierarchy process was applied to assign weights to parameters. Rules were generated to classify water samples into one of four potability categories. The system found that 51.78% of samples from the 24 districts were not suitable for consumption based on their salt contents. A knowledge base and inference engine were developed as the main components of the fuzzy rule-based system.


